International Journal of Energy Engineering

p-ISSN: 2163-1891    e-ISSN: 2163-1905

2020;  10(2): 46-58

doi:10.5923/j.ijee.20201002.03


Experimental Performance Evaluation of P&O and IC MPPT Algorithms for Photovoltaic Systems under Constant and Variable Environmental Conditions

Payam Soulatiantork

Department of Automatic Control and Systems Engineering, University of Sheffield, UK

Correspondence to: Payam Soulatiantork, Department of Automatic Control and Systems Engineering, University of Sheffield, UK.

Email:

Copyright © 2020 The Author(s). Published by Scientific & Academic Publishing.

This work is licensed under the Creative Commons Attribution International License (CC BY).
http://creativecommons.org/licenses/by/4.0/

Abstract

To enhance the performance and energy utilization of photovoltaic (PV) systems, efficient maximum power point tracking (MPPT) algorithms are required. The algorithms must be basically evaluated and their performances should be investigated before being implemented in actual systems. In order to experimentally evaluate the performance of MPPT algorithms, many PV testing systems have been designed, however, a low cost and simple experimental system is missing in the literature. In this paper, an efficient and simple PV testing system has been designed and the performances of two well-known MPPT algorithms such as perturb and observe (P&O) and incremental conductance (IC) algorithms have been investigated in real time. The evaluation is conducted under both stable and variable environmental conditions using a 180 W PV module. The system behavior is also challenged and investigated by changing the algorithm parameters such as step size and perturbation frequency and the optimized parameters are used for this application. The results show that the developed experimental testing system is a flexible and low-cost system, which aims to easily embed and simulate MPPT algorithms and evaluate them in various environmental conditions.

Keywords: Photovoltaic (PV), MPPT algorithms, Data Acquisition Cards, DC-DC converter

Cite this paper: Payam Soulatiantork, Experimental Performance Evaluation of P&O and IC MPPT Algorithms for Photovoltaic Systems under Constant and Variable Environmental Conditions, International Journal of Energy Engineering, Vol. 10 No. 2, 2020, pp. 46-58. doi: 10.5923/j.ijee.20201002.03.

1. Introduction

In many countries, PV energy is considered the future sustainable energy source. Amongst all renewable technologies, PV receives a strong support from the public and the politicians put an extreme attention to it. The characteristics of a solar cell, array, or module can be achieved only by experimentally characterizing those using current-voltage (I-V) and power-voltage (P-V) characteristic curves. I-V and P-V characterization curves and thus the output power of PV modules are extremely dependent on the varying module temperature (T) and solar irradiation (G). It can be concluded that connecting the PV module directly to the input port of a power system would be the worst choice of interest in harvesting energy, from power generation point of view.
Considering PV module is connected directly to a battery, the system forces the module to work on the battery voltage. If the battery voltage is higher than the PV module’s open circuit voltage (Voc), the system will not be able to drive the energy from the module. On the other hand, if the battery voltage is less than Voc, the battery voltage must be around the voltage at maximum power point (Vmp) to harvest the most energy from the module. As T and G levels are changing due to environmental condition changes, the Vmp is also changing. Therefore, it is almost impossible that the PV module delivers the maximum power in such a condition. Therefore, tracking maximum power point (MPP) is very important and MPPTs need to be implemented and validated. One of the conventional techniques to get maximum power from PV can be achieved by connecting a constant resistive load. This technique is very inefficient and will not be effective as the Vmp is changing during daytime by changing the irradiation and temperature, whereas the resistor is constant and being selected at the specific condition. Therefore, the direct connection of PV module to a battery or a resistive load cannot assure that the PV module is working at the MPP. As a result, a tunable hardware design is mandatory to locate between the PV module and load or battery, to adapt the module input voltage to Vmp. There also an MPPT tracking algorithm is required to identify the MPP in all the system operating points and supply the voltage reference for the tunable hardware.
As the Vmp changes over time, the power conversion system must have the capability to perform adaptively in the presence of these real-time variations. DC-DC power converters are considered as the best method and interface amongst all the other methods of PV testing systems. It is clear that using an interface will increase the cost of the system but the increment of the cost can be negligible in comparison with the amount of power generated by the module at MPP. The choice of the DC-DC power converter for this application is deeply discussed in [1].
It has been discussed that the employed MPPT algorithm and the interfaced hardware are very crucial for the maximization of power generation of PV systems. The overall system is called the PV testing systems. Figure 1 depicts the experimental test rig developed in this study as a PV testing system. As shown, PV module is connected to the load through a DC-DC power converter. The voltages and currents at the input and output of the converter are measured via dSPACE rti1104 controller board and the data are being processed by Matlab/Simulink and Control Desk interface by dSPACE, which is a cost-effective single board that can upgrade a PC to a development platform for fast control application.
Figure 1. Experimental test rig
G and T are also measured via ADAM 4000 series interface modules. The control signal, which is the output of the MPPT algorithms, then sends the pulse width modulated signal to the power converter to force the system working at MPP.
Regarding the reliability point of view, a PV system is divided into PV modules and a balance of system (BoS), which comprises all the non-module components of PV plants. From the reliability point of view, deep root failure causes of PV module and BoS are thoroughly studied to enhance the maintenance activities. A Markovian Model is built up, considering all the possible failure modes, in order to assess the probability of each failure mode occurrence and estimate the mean time to failure, probability density function of the time to module failure, hazard and survival functions of PV module and BoS [2] [3].
In this paper, particular focus is given to the implementation and evaluation of P&O and IC MPPT algorithms embedded in Matlab/Simulink using the experimental setup. The algorithms parameters have been changed to investigate the system performance using different parameters. Finally, algorithms performances have been evaluated in stable and variable environmental conditions using the optimum parameters for step size (d) and perturbation frequency (fp). The main contribution of this paper is to propose a simple algorithm together with a cost-effective experimental PV testing system which is capable of investigating and validating different types of MPPT algorithm in the constant and variable environmental condition. The system is specifically capable of comparing different algorithms at the same time in sudden changes in the environmental condition. Authors in [4] investigated an advanced P&O based self-adaptive step size MPPT algorithm however, there is no experimental setup to validate the algorithm. Some literature such as [5] and [6] has been used the experimental setup however they haven’t evaluated their algorithm under sudden changes in environmental conditions.
This paper is organized as follows; section 2 is dedicated to a literature review of different types of MPPT algorithms. The hardware setup is discussed in section 3. The experimental performance evaluation of P&O and IC algorithms are investigated in section 4 and section 5 respectively. Finally, the research outcomes are presented in Section 6.

2. MPPT Algorithms

There are several types of MPPT algorithms that can track the MPP of PV modules. In general, MPPT algorithms are dividing into two categories as; indirect and direct methods.
1) Indirect method
This method of MPP tracking is based on estimating the MPP according to some databases such as the prior information about the PV module and measuring the parameters such as G, T, Isc or Voc or using mathematical functions to estimate MPP. Obviously, the employed database does not necessarily include all the climate conditions. Therefore, one of the main drawbacks of this method is when the real condition is far from the estimated condition. In this case, the energy losses are very high and when a high precision of tracking is needed, direct methods would be more appropriate. Some of the indirect methods are explained in details as below.
A. Open circuit voltage
This method is based on the fact that the MPP voltage of PV module is linearly proportional to the Voc of the module as can be written as,
(1)
Figure 2 depicts the flowchart of the open circuit voltage method. As can be seen, the system is quite simple but finding an appropriate and optimal value for K1 is difficult.
In some literature, it is shown that the constant K1 is located at 0.76 of the Voc [7]. In some others, it is concluded that for different types of PV modules, values in the interval between 0.70Voc and 0.82Voc are good approximations of K1 [8]. A disadvantage of this method is that a switch must be put in series with the power converter to completely open the system in order to measure the Voc to find the Vmp, which results in energy losses during this test.
Figure 2. Open circuit voltage MPP tracking method
B. Short circuit current method
In this method, Imp considered having a linear relationship with Isc [9].
(2)
In order to measure the Isc, the PV module must operate in short circuit condition, which wastes a lot of energy during this measurement. Although the system is simple, the mentioned disadvantages decrease the use of this method.
C. Look up table method
For this method, Imp and Vmp for different environmental conditions are saved and used to compare with the real operating condition to find the real MPP [10]. This method has some drawbacks such as the need for huge amount of space to save all the data to compare with the operating point. In addition, these saved data are just dedicated to the PV module which the data has been collected.
D. Fuzzy logic method
Another method to obtain the MPP is the fuzzy logic approach. In a study [11], a boost converter connected to single-phase inverter is employed. The switch of the converter is being controlled by means of an adaptive fuzzy logic controller to track the MPP. Both conventional and adaptive fuzzy methods are compared numerically and experimentally and it is shown that the adaptive fuzzy logic can deliver more power than the conventional fuzzy approach. The inputs of the system are the error and the change of the error. Although the system with the fuzzy logic tracker is fast especially in rapidly changing conditions there must be an extensive knowledge of the system with an expert operator to make the rule base table which is difficult to obtain an optimal one [11].
E. Artificial network method
A neural network which can be used as an MPPT algorithm is another method in the group of indirect MPPT trackers. A novel neural network MPPT controller in PV applications is presented in a study [12]. This MPPT controller was developed in two operating modes. The first mode, which is called the offline mode, is the testing of different neural network parameters to find the most appropriate and optimized controller from the structure, training algorithm and the activation function points of view. The second mode, which is called online mode is the optimal neural network MPPT controller used in real-time to track the MPP. As can be seen from Figure 3, the inputs of the network are the derivatives of the input voltage and power of solar module due to a given cell temperature and solar irradiation and the output is a value between zero to one which increases or decreases the duty cycle of the boost converter.
Figure 3. Developed neural network to determine the duty cycle [12]
As the neural network must be designed for a specific environmental condition and PV module, the network must be trained on a regular basis which is time-consuming and a waste of energy during training.
F. Model-Based algorithms
The model-based (MB) MPPT techniques are in the group of indirect MPPT algorithms. In comparison with the P&O and IC algorithms, MB algorithms are more efficient in sudden environmental changes as they offer a better dynamic response. The conventional MB MPPT algorithms usually need some experimental equipment such as Pyranometer to be carried out. To this end, in a study [13] the authors of this study proposed a new MB MPP tracker which only needed the Pyranometer during identification of the parameters. As the MB algorithms need an accurate model of the PV module, a new single model of the diode is also described, which helps to find the parameters more easily than the previous ones [13] [14]. This simple method is used and some experimental results show an acceptable performance of the new MB MPP tracker [15]. The maximum power can be easily estimated by measuring the T and G since the PV model is known and used to find the accurate parameters of the MB algorithm. A disadvantage of this method was the system cost according to equipment needed to implement the algorithm. Therefore, in some studies [14] [16] [17], the authors describe an improved MPP tracker for PV application, which reduces the cost of the system implementation by eliminating the Pyranometer.
2. Direct methods
Direct methods need the measurement of the current and voltage of the PV module. The most outstanding feature of direct methods are that; there is no need of deep knowledge about the system and no disconnection of the hardware during tracking implementation is needed. Therefore, the MPP can be tracked independence by measuring G, T, the degradation and aging of the PV module with a very high robustness. Amongst a number of direct MPP trackers, in this paper, P&O and IC methods will be discussed and evaluated in detail.
A. Perturb and Observe Algorithm
The P&O method is one of the most widely used MPPT algorithms in different applications, which does not require the prior knowledge of the PV module characteristics. This technique operates by perturbing the output voltage of the PV modules and does a comparison between the power generated before and after the perturbation. If the power increases by the changes in the PV voltage, the operating voltage forces to move in the same direction by adding a constant value called the ‘step size’ to the reference voltage. Otherwise, the change to the operating voltage must be in the opposite direction by changing the sign of the step size. There are two configurations to implement the P&O algorithm [18] [19]. Figure 4 shows both techniques, which are using in literature to implement the algorithm.
Figure 4. P&O implementation configurations
As can be seen, the voltage reference perturbation configurations is using the PV module voltage as the control parameter. The reference voltage is the output of the MPPT algorithm and the controller which is usually a PI controller adjusts the duty cycle of the DC-DC power converter by means of PWM generator [20] [21]. The second method of implementing the P&O algorithm is using the duty cycle of the power converter as the control parameter and therefore, the output of the P&O algorithm must be directly the duty cycle which will be the input of the PWM generator. In most of operating conditions, Vmp has slower dynamics in comparison with the Imp. In addition, to prevent the controller to be oscillated with noisy current measurements, in this study the reference voltage perturbation has been chosen. The P&O algorithm flowchart which is used in this paper is depicted in Figure 5.
Figure 5. P&O flowchart diagram
Not only the choice of the perturbation ‘step size’ is very important but also the ‘perturbation frequency’ is another crucial parameter in designing the P&O algorithm. The perturbation frequency is the number of perturbations per second that made by the MPPT algorithm. Due to the importance of these parameters, Sections IV and V dedicated to the definition of the parameters, the procedure of validating the employed MPP algorithms and the effect of the perturbation time and step size on the dynamic and the steady state conditions. Finally, the procedure of finding the optimized parameters is discussed.
B. Incremental conductance Algorithm
Incremental conductance is a famous hill climbing MPPT algorithm [22] [23]. This algorithm is based on the fact that, the MPP is the point that the slope of the P-V characteristic curve is zero. On the left side the slope is positive and on the right side the slope is negative as can be written as the following equation.
(3)
where P is the module power and V is the module Voltage. As the 
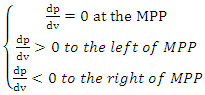
the equation can be rewritten as,
(4)
Therefore, the sum of incremental conductance 
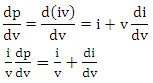
and instantaneous conductance 
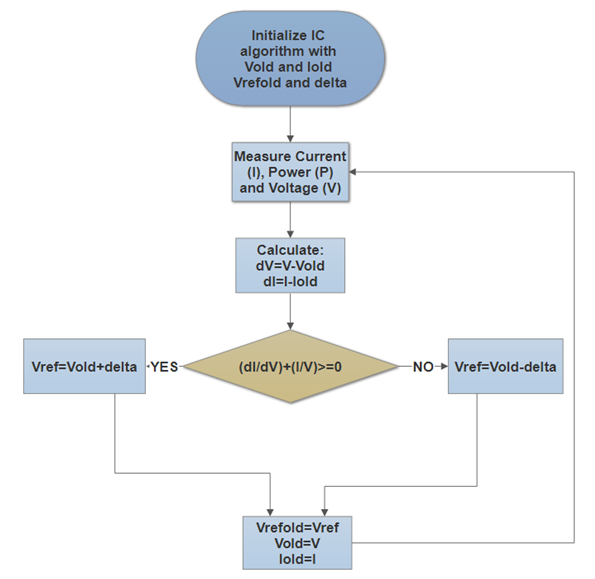
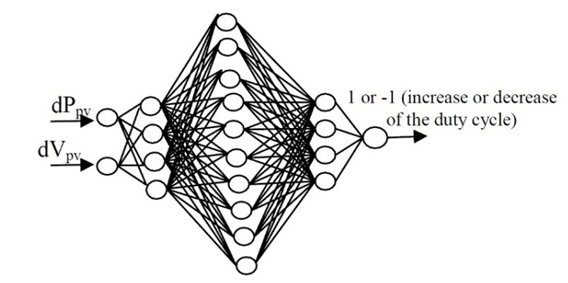
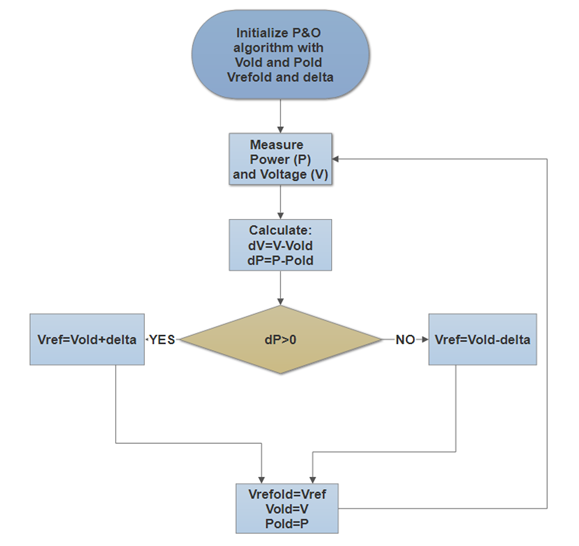
is zero at the MPP. The same as a P&O algorithm, two techniques can be used to implement the IC MPPT algorithm as shown in Figure 4. Due to the mentioned reasons in the previous section, the reference voltage is selected as the control parameter.
As shown in Figure 6, the algorithm increases or decreases the reference voltage by comparing the incremental conductance and . Several studies use the condition that It must be taken into account that this assumption is acceptable only if we neglect the dynamic of the MPPT algorithm and the noise of the system. In addition, it is not possible to find stable environmental conditions. For an experimental PV testing system, the last mentioned condition is not acceptable. Therefore in this paper, the IC algorithm strategy as shown in Figure 6 has been used.
Figure 6. IC Flowchart diagram used in this paper

3. Hardware Setup

The hardware platform has been designed for integrating real-time measurement to characterize PV modules and embedding MPPT algorithm. The experimental design has the capability to perform several functions, such as data collection in real-time for the current and voltage using the data acquisition card for plotting of I-V and P-V curves of the photovoltaic modules for the power up to 200W. In this test rig, the maximum power is checked by the robust MPPT algorithm according to the step size and period time of the algorithm in real-time processing.
The SEPIC converter enables embedded real-time measurement test rig by changing the duty cycle of the PWM signal at the gate of the MOSFET to modify the PV module voltage. The lifetime enhancement analysis of the converter is also presented and discussed in [24] [25].
A dSPACE rti1104 data acquisition and control card using PC can be used as the interface to acquire current and voltage measurements performed on the system in real-time. This signal is a control signal to force the PV module operating at a certain voltage to achieve the MPP using MPPT algorithms. The control system is based on PC and Simulink/MATLAB environment. The ControlDesk software by dSPACE has been used as a graphical interface between the Simulink and the experimental part of the system.
ADAM-40000 family is an intelligent interface between the sensors and the computers. These series of interfaces are module-computer based with a microprocessor embedded, which are suitable for creating a good remote input/output system. The RS-485 communication protocol is used to transmit the data in ASCII codes. They also provide several functions, including signal processing, the insulation, A/D and D/A conversion, the comparison of data, and digital communication functions.
To assure that the maximum power is driven from the PV modules, the DC-DC power converter must have the capability to trace any voltage in full range. As can be seen from Figure 7, by changing the duty cycle (control signal) from zero to one, any operating points of PV module can be achieved.
Figure 7. Input (top) and output (bottom) parameters measurements
The duty cycle must be varied on a regular basis by the controller to force the PV module to operate in the MPP point continuously. By measuring real-time input or output voltage and current of the power converter, the MPPT controller can change the duty cycle of the converter to track MPP.
MPPT controllers can maximize the harvested input power or the output power. Figure 7 shows both approaches that an MPPT algorithm can be implemented in a system to track the MPP in real-time by using the input or output parameters of the converter.
On one hand, MPPT controllers that use output parameters, have some advantages in comparison with those employing input parameters, because of using less number of sensors as the load is constant. This will result in simplifying the hardware and implies algorithm simplification. Therefore, just one sensor would be used for MPPT controllers to compute the Vmp [26].
On the other hand, MPP changes during the daytime along with the variation of the efficiency of the power converter. Therefore, the changes in G cause electrical stress from the current over devices in which the losses are completely affected by the stress. The changes in irradiance conditions impose an additional voltage stress to power devices. All these are negative factors, which can decrease the efficiency of the power converter. Due to this fact, an increase in the PV power leads to a lower efficiency and decreases the output power.
In literature, measuring the voltage and current of PV modules are considered as the most important parameters needed to track the MP and there must be a trade-off between the limitation of the cost and guarantee of an acceptable relation of the efficiency vs. power, as the higher the output power the higher the efficiency [26].
Based on the aforementioned reasons, the input voltage and current of PV module are measured and used to calculate the Vmp in this study. The calculated voltage is set as a reference of the controller to force the PV module to work at that point to achieve the maximum power.
T and G are acquired through a PT100 temperature sensor and a class 1 CMP21 Pyranometer sent through the sensor interfaced with the control board by means of a serial RS232 communication protocol. To measure the voltage provided by the PV module, two resistors are used in parallel with the PV module as a voltage divider. The current provided by the PV module is measured through the LEM LTS-6NP current sensor.
To perform experimental measurements, the converters are connected to a 180W monocrystalline solar modules installed on the roof of DEIB department at Politecnico di Milano University and the related parameters are summarized in Table 1.
Table 1. 180 W PV panel characteristics
     
Table 2 shows the component characteristics and products name used in the DC-DC convertor. As can be seen 5 ARCO high power resistors (22Ω, 50W) has been used in parallel making a total of 4.4Ω with up to 250W which is the power rating for the power converter.
Table 2. Components of the DC-DC convertor board
     
Figure 8 depicts the DC-DC converter PCB board designed by Target 3001 V17 software, which has the capabilities of; measuring the voltage and the current of the PV module, measuring the voltage and current of the load to calculate the efficiency of the converter and using the voltage follower and the filter in data measurement to avoid destruction of DAC input of the data acquisition card and get rid of noises.
Figure 8. DC-DC converter board
Figure 9 shows the experimental setup of the PV testing system.
Figure 9. The experimental PV testing system

4. Performance Evaluation of the P&O Algorithm

Two important parameters must be designed properly to assure that the MPPT algorithm can perfectly carry out. The parameters are the ‘step size’ and the ‘perturbation frequency’. For the reference voltage strategy shown in Figure 4, the PV operating point fluctuates around the real Vmp. This causes the current and output power of the PV module to fluctuate. To validate the performance of the P&O algorithm employed in this paper, a very low perturbation frequency is used to assure that the system can reach the steady state. In addition, the step size must be high enough to make sure that the control is not affected by the noise and has enough effect on the perturbation to change the output power for next perturbation decision [27].
1. Algorithm performance validation
In order to validate the performance of the P&O algorithm, controller, and experimental setup employed in this paper, a step size equal to 4V and the perturbation frequency equal to 1 Hz are selected. Current and voltage of the PV module are captured at G and T equal to 939 W/m2 and 319 K respectively. I-V and P-V characteristic curves at this operating point are shown on the top and bottom sides of Figure 10 respectively.
Figure 10. I-V characteristic curves
Considering the starting point of the algorithm at point 1 in 32V, the reference voltage is increased by 4 V (which is the step) size, moving to point 2 at 36V. Power is now measured after this perturbation occurred and because the power is decreased, the algorithm must reverse the direction of the perturbation. Thus, the reference voltage is decreased by the step size and goes back to point 1. In this situation as the measured power is increased, the algorithm will keep the direction of the perturbation resulting in being at point 3 in which the voltage is 28 V. In this case as the power at point 3 is higher than that at point 1, perturb and observe algorithm continues to decrease the reference voltage to point 4 at 24V, where output power falls down. As the power decreased, the algorithm reverses the perturbation direction by increasing the reference voltage to 28 V and comes back to point 3 and then point 1 and the sequence is repeated until there is a change in the T or G. As can be seen, point 5 is the maximum power point and the algorithm fluctuates at this point. This procedure assesses and evaluates the performance of the algorithm.
Figure 11 depicts the voltage, current and the power delivered by the PV module at the MPP. As can be seen, the MPP is approximately 132 W and Vmp and Imp are approximately 29.3 V and 4.50 A respectively. It must be mentioned that the results are under stable environmental conditions (G=939 W/m2 and T= 319 K) and data have acquired for 25 seconds.
Figure 11. Current, voltage and power for P&O algorithm
P&O algorithm utilized in this paper is validated and it has been shown that the algorithm and the PV testing system can perfectly track the MPP. Nevertheless, the optimal values of the step size and the perturbation frequency must be found to have a better power production. The next subsections are devoted to the effect of these two parameters in variable and steady-state conditions.
2. Effect of algorithm parameters
To show the importance of algorithm parameters and investigate the effect of them on system performance, several results have been presented by changing the parameters. As it is indicated on the top side of Figure 12, the step size is set to 0.5 V and the perturbation frequency kept constant at 1 Hz. In comparison with Figure 11, on one hand, decreasing the step size has the advantage of lower oscillations in steady state conditions. On the other hand, system response would be slower in sudden environmental changes. For instance, for the first case (see Figure 11), the system response to reach the steady state condition is around one second; however, in this case (see Figure 12), it is approximately 15 seconds.
Furthermore, as shown on the bottom side of Figure 12, the step size kept constant at 0.5 V and the perturbation frequency has been changed to 10 Hz. As shown, the system is much faster now in reaching the steady state and as it has been shown, the time to reach the steady state condition is approximately 2 seconds.
Figure 12. Effect of changes in algorithm parameter top (1Hz, 0.5V) and bottom (10 Hz, 0.5 V)
Figure 13 shows the performance of the algorithm using the step size and perturbation frequency equal to 4V and 10 Hz respectively. Although the response time is approximately one second in order to reach the steady state, the fluctuations over the MPP results in a very high power loss.
Figure 13. Effect of changes in step size 10 Hz, 4V
It can be concluded that there must be a trade-off between the step size and the perturbation frequency. It is crucial to mention that firstly, the perturbation time cannot become lower than the settling time of the system response. If this happens, the system never reaches the steady state, the response is affected by previous perturbations, and further decrease in the perturbation time may result in the PI controller to lose the stability. Secondly, very low step sizes in a practical system might be more affected by noise especially in power converters with switching devices that make noise. Next subsection dedicated to the procedure of finding optimum parameters used in current study.
3. Algorithm parameters optimization
The MPP trackers are used to track the maximum power of PV modules. Therefore, they must be designed in a proper way to force the system work in a highest possible efficiency. Different studies report different efficiencies by utilizing the P&O MPPT algorithm. The efficiencies are reported as 68% to 81.5% in [28] [29]. Therefore, these parameters have a crucial effect on the efficiency of the PV system and they must be optimized in a proper way. There are not too many methods to optimize these parameters. The step size and the perturbation frequency have been previously defined in some literature by the trial and error method [30]. In a study [31], the authors used the duty cycle reference to find the optimal values for these two parameters. They assumed that the optimum step size is the one that does not make the algorithm to be confused with variable solar irradiation condition. An equation is derived to calculate the step size, which depends on the inherent parameters of the used solar cell. The equation also depends on the rate of change in solar irradiation, which varies at different times of the day and from a solar farm to another. In addition, the cell parameter must be calculated in advance because they rarely can be found in the manufacturer datasheet. Another method to choose the best parameters of P&O is completely described and has been employed to optimize the step size and the perturbation frequency in this paper. This method is simple, and it does not need any previous knowledge about the system or the PV module parameters and can be done by some easy mathematical calculations [32].
As shown in Figure 14, the procedure starts with initializing the step size and the perturbation frequency to 10% of the Vmp at steady state and 1 Hz respectively. The Vmp at steady state is 35V, which can be found from the specifications of the PV module in the datasheet. The system must continue working until the algorithm opeartes in correct condition called three level operation. If the operations more than three are captured, the perturbation frequency must be decreased until the system settled in a steady state. For the reference voltage perturbation used in this study, then the settling time must be measured. Having the settling time, the perturbation frequency can be acquired. In fact, lower settling time results in a faster system, especially in dynamic responses due to the sudden environmental changes.
Figure 14. Parameter optimization procedure
The step size must be chosen in a proper way that has a low steady-state error and an acceptable speed of convergence, especially in rapid environmental changes. Therefore, the transient time of the P&O algorithm for the first track must be also taken into account. For the system under test, the settling time is measured at approximately 30ms as shown in Figure 15.
Figure 15. P&O Performance in tracking the reference voltage
Therefore, the perturbation frequency can be equal to 30 Hz. By assuming the transient time equal to 30 mS when the algorithm starts working on the open circuit (around 40V) to reach Vmp (is considered as 35V from datasheet) results in a 0.5V as step size. Because there are 10 steps of 0.5V to reach Vmp (35V) from Voc (40V). System noise is another factor that has a significant effect on the choice of step size. The optimized step size must be big enough to assure that the algorithm is not confused by the noises produced by the switching DC-DC converter. In this study, as the algorithm starts from the point very close to the Vmp, these parameters guarantee that the algorithm does not confuse in any case.
Next section is dedicated to the evaluating of the optimized P&O algorithm under stable and variable environmental conditions.
4. The performance under stable and unstable environmental condition
To assess and validate the algorithm with optimized parameters, the system forced to work in the clear and variable weather for 600 seconds. Figure 16 shows the performance of the algorithm for a clear sky day. As shown in Figure 16, the PV testing system and the designed P&O algorithm can perfectly track the MPP in stable environmental condition. The test has been conducted for G and T equal to 939 W/m2 and 319 K respectively for the power up to 128 W.
Figure 16. Performance of P&O algorithm in constant environmental condition
To show the performance of the algorithm under variable conditions, the test is conducted for 600 seconds. Fig. 17 shows T and G captured during the test. Ac can be seen, T varies in between 307.1 K up to 310.8 K and G is in the interval between 260 W/m2 and a bit less than 1200 W/m2.
Figure 17. Module temperature(top) and solar irradiation (bottom)
Figure 18 depicts the current, voltage and power during the test. As can be seen, the algorithm can perfectly track the maximum power point in variable environmental conditions.
Figure 18. P&O algorithm performance in variable environmental condition

5. Performance Evaluation of IC Algorithm

The same procedure of testing and evaluating used for P&O algorithm has been done to evaluate the performance of the IC algorithm. Another test for 600 seconds have been done under stable and variable environmental conditions showing that the IC algorithm and the PV testing system employed in this paper can accurately track the MPP.
1. Algorithm performance validation
The perturbation frequency and the step size are set to 1HZ and 4V. The test has been conducted over a stable period of time and the module temperature and solar irradiation were measured at 315 K and 887 W/m2. I-V and P-V characteristic curves at the above operating point are shown in Figure 19.
Figure 19. I-V curve (top) P-V curve (bottom)
Figure 20 shows the voltage, current and the power delivered by the PV module at the MPP. As can be seen, the measured power is approximately 124.42 W and the Vmp and Imp are 30.09 V and 4.13 A respectively.
Figure 20. Current, voltage and power for IC algorithm
The IC MPPT algorithm employed in this paper is validated and showed that the algorithm can precisely track the MPP. The next subsections are discussing the effect of the step size and perturbation frequency on the dynamic and steady-state conditions.
2. Effect of perturbation size and step size and the optimal values
Two different tests have been conducted with different step sizes and perturbation frequencies. In addition, the dynamic responses of the algorithm in different cases are compared using different step sizes and MPPT frequencies. As it is indicated in Figure 21, the step size is set to 0.5 V for both cases and the perturbation frequency is changed and set to 1 Hz and 10 Hz for individual tests. These tests have been shown on the top and bottom side of Figure 21.
Figure 21. Effect of changes in fp 1Hz and 0.5v and 10 Hz 0.5V
On one hand, lower the step size, lower the oscillations in steady state condition. On the other hand, system response would be slower in sudden environmental conditions. For G and T equal to 887 W/m2 and 315 K respectively, the system response to reach the steady state reported as approximately 15 s and 1 s. As it was expected, the system is much faster when the perturbation frequency is higher.
Figure 22 depicts the IC algorithm performance with the step size and perturbation frequency set to 4V and 10 Hz respectively. Although the response time is approximately 0.5 second in order to reach the steady state, the fluctuations in the MPP results in power loss as the points are far from the MPP. As can be seen, the IC algorithm is quite faster than P&O in dynamic point of view as the convergence for the P&O algorithm is reported as 1 seconds for the same testing condition.
Figure 22. Effect of changes in step size 10 Hz and 4v
For the IC algorithm, the simple method of finding the optimized parameters described completely in the previous section has been used. As shown in Figure 15, for the system under test, the settling time is measured at approximately 30 ms and therefore, the MPPT frequency must be equal or more than 30Hz. The same procedure done for the P&O algorithm, the step size set to 0.5 V. Next section is dedicated to the performance of optimized IC algorithm under stable and variable environmental conditions.
3. IC performance under different environmental condition
To test and evaluate the optimized algorithm the system is forced to work for 10 minutes for two different cases. The first case, which is the clear day and the result, is depicted in Figure 23.
Figure 23. IC Performance at the stable environmental condition
To evaluate the algorithm under variable environmental conditions, the test is done for 10 minutes and Figure 24 depicts the G and module T in the mentioned condition. As can be seen, the temperature variation on PV module is low; however, irradiation varies between 580 W/m2 and 1200 W/m2.
Figure 24. Module temperature (top) and solar irradiation (bottom)
Current, voltage and power measured during the test are captured and plotted in Figure 25, which shows the algorithm can track maximum power point in a good performance. The results show an acceptable performance of the IC algorithm and the proposed testing system under stable and variable environmental conditions.
Figure 25. IC algorithm performance in variable environmental condition

6. Conclusions

This paper presents an experimental PV testing system design and development, which has the capability of embedding different types of MPPT algorithms in order to evaluate their performances. The testing system for PV application has been developed according to some constraints such as flexibility and ease of use, low cost, capability of algorithms simulation, and capability of tracking MPP on the base of different MPPT algorithms using a DC-DC power converter.
P&O and IC algorithms performances have been investigated individually. The algorithms parameters such as step size and perturbation frequency have been firstly changed to show the system performance in changing the algorithms parameters. Then the procedure to find the optimum value of the parameters is discussed.
Finally, both algorithms performances have been evaluated during a 600 seconds test under stable and variable environmental conditions. The experimental results show that although IC has a faster response in dynamic condition, both MPPT algorithms using the optimized parameters can perfectly track the MPP and the developed experimental system is a flexible and low-cost system to evaluate the MPPT algorithms performances.

References

[1]  M. Faifer, L. Cristaldi, L. Piegari, and P. Soulatiantork, "Design of a converter for photovoltaic modules testing," Clean Electrical Power (ICCEP), 2015 International Conference on, Taormina, 2015, pp. 674-681. DOI: 10.1109/ICCEP.2015.7177564.
[2]  L. Cristaldi, M. Khalil, P. Soulatiantork, “A root cause analysis and a risk evaluation of PV balance of systems failures”, The International Measurement Confederation Journal (IMEKO), Vol. 6, No.4, pp. 113-120, Dec 2017. DOI: http://dx.doi.org/10.21014/acta_imeko.v6i4.425.
[3]  Cristaldi, M. Khalil, M. Faifer, P. Soulatiantork, “Markov process reliability model for photovoltaic module encapsulation failures”, 4th international conference on renewable energy research and applications, Palermo, Italy, pp. 22-25 Nov 2015. DOI: 10.1109/ICRERA.2015.7418696.
[4]  Zhu, Y.; Kim, M.K.; Wen, H. Simulation and Analysis of Perturbation and Observation-Based Self-Adaptable Step Size Maximum Power Point Tracking Strategy with Low Power Loss for Photovoltaics. Energies 2019, 12, 92.
[5]  Loukriz, A., Messalti, S. & Harrag, A. Design, simulation, and hardware implementation of novel optimum operating point tracker of PV system using adaptive step size. Int J Adv Manuf Technol 101, 1671–1680 (2019).
[6]  Meenakshi Sundaram, B., Manikandan, B.V., Praveen Kumar, B. et al. Combination of Novel Converter Topology and Improved MPPT Algorithm for Harnessing Maximum Power from Grid Connected Solar PV Systems. J. Electr. Eng. Technol. 14, 733–746 (2019).
[7]  J.H.R. Enslin, M.S. Wolf, D.B. Snyman, and W. Swiegers. "Integrated photovoltaic maximum power point tracking converter", IEEE Transactions on Industrial Electronics, 44(6): 769–773, 1997.
[8]  W. Xiao, W.G. Dunford, P.R. Palmer, and A. Capel., "Application of centered differentiation and steepest descent to maximum power point tracking", IEEE Transactions on Industrial Electronics, 54(5): 2539–2549, 2007.
[9]  T. Noguchi, et al., "Short-current pulse-based adaptive maximum power point tracking for a photovoltaic power generation system, Elect. Eng. Japan 139 (1) (2002) 65–72.
[10]  H. E. S. A. Ibrahim, F. F. Houssiny, H. M. Z. El-Din and M. A. El-Shibini, "Microcomputer controlled buck regulator for maximum power point tracker for DC pumping system operates from photovoltaic system," Fuzzy Systems Conference Proceedings, 1999. FUZZ-IEEE '99. 1999 IEEE International, Seoul, South Korea, 1999, pp. 406-411 vol.1.
[11]  Pongsakor T., Somyot K. and Chaiyan J. "Maximum Power Point Tracking Using Fuzzy Logic Control for Photovoltaic Systems". proceeding of the International MultiConf of Engineers and Computer Scientists 2011 vol.2, IMECS, Hong kong, 2011.
[12]  Hiyama T., Kouzum S. a "Identification Of Optimal Operating Point Of PV Modules Using Neural Network For Real Time Maximum Power Tracking Control, " IEEE Trans. Energy Convers., vol. 10, no. 2, , Jun. 1995. pp. 360–367.
[13]  L. Cristaldi, M. Faifer, M. Rossi, S. Toscani “MPPT Definition and Evaluation: A New Model-Based Approach” in Proc. IEEE Int. Instrum. Meas. Technol. Conf., Graz, Austria, May 13-16, 2012, pp.594–599.
[14]  L. Cristaldi, M. Faifer, M. Rossi, and S. Toscani, "A simplified model of a photovoltaic module,” in Proc. Int. Instrum. Meas. Technol. Conf., May 2012, pp. 431–436.
[15]  M. Faifer, L. Cristaldi, S. Toscani, P. Soulantiantork and M. Rossi, "Iterative model-based Maximum Power Point Tracker for photovoltaic modules," 2015 IEEE International Instrumentation and Measurement Technology Conference (I2MTC) Proceedings, Pisa, 2015, pp. 1273-1278. DOI: 10.1109/I2MTC.2015.7151456.
[16]  L. Cristaldi, M. Faifer, M. Rossi and S. Toscani, "An Improved Model-Based Maximum Power Point Tracker for Photovoltaic Modules," in IEEE Transactions on Instrumentation and Measurement, vol. 63, no. 1, pp. 63-71, Jan. 2014.
[17]  P. Soulatiantork, ‘Performance comparison of a two PV module experimental setup using a modified MPPT algorithm under real outdoor conditions’, Solar Energy, Volume 169, 15 July 2018, pp. 401-410.
[18]  P. Soulatiantork, L. Cristaldi, M. Faifer, C. Laurano, R. Ottoboni, S. Toscani, A Tool for Performance Evaluation of MPPT Algorithms for Photovoltaic Systems, Measurement, 2018, ISSN 0263-2241, https://doi.org/10.1016/j.measurement.2018.07.005.
[19]  Soulatiantork, P., 2016. Experimental Performance Evaliation of MPPT Algorithms for Photovoltaic Systems. P.h.D theses, Politecnico di Milano, Milano, Italy.
[20]  P. Solatian, S. Hamidreza Abbasi, and F. Shabaninia, “Simulation Study of Flow Control Based on PID ANFIS Controller for NonLinear Process Plants,” Am. J. Intell. Syst., vol. 2, no. 5, pp. 104–110, 2012
[21]  Payam Soulatiantork, Alireza Alghassi, Marco Faifer, Suresh Perinpanayagam, IGBT Thermal Stress Reduction Using Advance Control Strategy, Procedia CIRP, Volume 59, 2017, Pages 274-279. https://doi.org/10.1016/j.procir.2016.09.040.
[22]  Q. Mei, M. Shan, L. Liu, and J. M. Guerrero, "A novel improved variable step-size incremental-resistance MPPT method for PV systems, " IEEE Trans. Ind. Electron., vol. 58, no. 6, pp. 2427–2434, Jun. 2011.
[23]  A. Safari and S. Mekhilef, "Simulation and hardware implementation of incremental conductance MPPT with direct control method using cuk converter, " IEEE Trans. Ind. Electron., vol. 58, no. 4, pp. 1154–1161, Apr. 2011.
[24]  Alireza Alghassi, Payam Soulatiantork, Mohammad Samie, Adrian Uriondo Del Pozo, Suresh Perinpanayagam, Marco Faifer, Fault Tolerance Enhance DC-DC Converter Lifetime Extension, Procedia CIRP, Volume 59, 2017, pp 268-273. https://doi.org/10.1016/j.procir.2017.02.014.
[25]  M. Faifer, M. Khalil, L. Piegari, P. Soulatiantork, S. Toscani, " Improvement in the efficiency of DC-DC power converters by controlling the switching frequency," in proceeding of IMEKO TC10 Workshop on Technical Diagnostics, Advanced measurement tools in technical diagnostics for, systems' reliability and safety, Milan, Italy, June 2016.
[26]  D. Shmilovitz, "On the control of photovoltaic maximum power point tracker via output parameters," in IEE Proceedings - Electric Power Applications, vol. 152, no. 2, pp. 239-248, 4 March 2005.
[27]  R. Sankarganesh and S. Thangavel, "Maximum power point tracking in PV system using intelligence based P&O technique and hybrid Cuk converter," Emerging Trends in Science, Engineering, and Technology (INCOSET), 2012 International Conference on, Tiruchirappalli, Tamilnadu, India, 2012, pp. 429-436.
[28]  M. A. Elgendy, B. Zahawi and D. J. Atkinson, "Assessment of Perturb and Observe MPPT Algorithm Implementation Techniques for PV Pumping Applications," in IEEE Transactions on Sustainable Energy, vol. 3, no. 1, pp. 21-33, Jan. 2012.
[29]  T. Tafticht, K. Agbossou, M. L. Doumbia, and A. Chériti, "An improved maximum power point tracking method for photovoltaic systems", Renew. Energy, vol. 33, pp. 1508–1516, 2008.
[30]  A. Safari and S. Mekhilef, "Simulation and hardware implementation of incremental conductance MPPT with direct control method using Cuk converter," IEEE Trans. Industrial Electronics., vol. 58, no. 4, pp. 1154–1161, Apr. 2011.
[31]  K. H. Hussein, I. Muta, T. Hoshino, and M. Osakada, "Maximum photovoltaic power tracking: An algorithm for rapidly changing atmospheric conditions, " in Proc. Inst. Elect. Eng., Generation, Transmission and Distribution, 1995, vol. 142, pp. 59–64.
[32]  N. Femia, G. Petrone, G. Spagnuolo, M. Vitelli, "Optimization of perturb and observe maximum power point tracking method", IEEE Trans. Power Electron. 20 (4) (2005) 963–973.