E. C. Merem1, Y. A. Twumasi2, J. Wesley1, D. Olagbegi1, M. Crisler1, C. Romorno1, M. Alsarari1, P. Isokpehi1, A. Hines3, G. S. Ochai4, E. Nwagboso5, S. Fageir6, S. Leggett7
1Department of Urban and Regional Planning, Jackson State University, 101 Capitol Center, Jackson, MS, USA
2Department of Urban Forestry and Natural Resources, Southern University, Baton Rouge, LA, USA
3Department of Public Policy and Administration, Jackson State University, 101 Capitol Center, Jackson, MS, USA
4African Development Bank, AfDB, 101 BP 1387 Avenue Joseph Anoma, Abidjan, AB 1, Ivory Coast
5Department of Political Science, Jackson State University, 1400 John R. Lynch Street, Jackson, MS, USA
6Department of Criminal Justice and Sociology, Jackson State University, 1400 John R. Lynch Street, Jackson, MS, USA
7Department of Behavioral and Environmental Health, Jackson State University, 350 Woodrow Wilson, Jackson, MS, USA
Correspondence to: E. C. Merem, Department of Urban and Regional Planning, Jackson State University, 101 Capitol Center, Jackson, MS, USA.
| Email: |  |
Copyright © 2020 The Author(s). Published by Scientific & Academic Publishing.
This work is licensed under the Creative Commons Attribution International License (CC BY).
http://creativecommons.org/licenses/by/4.0/

Abstract
In an era saddled by mounting energy dependency and insecurity, some are not only turning to renewable geothermal energy to ensure access, but it is growing in usage in the Western region of the United States of America. Notwithstanding the United States role as a major producer of geothermal resources globally, geothermal energy has over the last several years found ample use in various spheres of daily endeavors within communities. The surging demand is much so that, it now contributes quite significantly in the generation of electricity to power households and farming activities and to sustain domestic supplies essential to segments of the economy for communities from California to Nevada. With much of the production levels, installations and plant capacities of geothermal power fully entrenched in the western region of the country considering the geologic and physical attributes, California stands out as the largest producer of geothermal power compared to its neighbors in the western region. For that, the demand for geothermal resource has been recurrent in quite a few counties over the years on the California side of the US Western region. In the face of widespread demands in the region, geothermal energy infrastructure in the form of new plants has gradually penetrated different states under varying level of production and installed capacities to boost energy security and sustain development of the areas. Even at that, very little has been done in the literature to undertake a regional assessment of the potentials of geothermal energy using a mix scale approach of spatial analysis anchored in Geographic Information Systems (GIS). Accordingly, this study will fill that void in research by utilizing mix scale tools of GIS and descriptive states in analyzing the geothermal energy potentials of states in the Western region of the United States. Emphasizing the issues, trends, impacts, production, factors and future efforts through recommendations, the results point to growing usage and changes in a whole set of energy indicators ranging from production and demands, installed capacity to others over time in the region with much of that in California coupled with an uptick in geothermal portfolio. Additionally, the GIS mapping of the trends highlights gradual dispersion of changing patterns in consumption and presence of infrastructural facilities visibly concentrated in a cluster of areas located in the western region. With all these attributed to a host of socio-economic and physical factors, the paper proposed suggestions ranging from the design of a regional geothermal energy information system, the education of the public and more infrastructural development in the sector.
Keywords:
GIS, Geothermal energy, Western region, Impacts, Factors, Changes, Production, Capacity
Cite this paper: E. C. Merem, Y. A. Twumasi, J. Wesley, D. Olagbegi, M. Crisler, C. Romorno, M. Alsarari, P. Isokpehi, A. Hines, G. S. Ochai, E. Nwagboso, S. Fageir, S. Leggett, Evaluating Geothermal Energy Potentials in the US Western Region with GIS, International Journal of Energy Engineering, Vol. 10 No. 2, 2020, pp. 23-40. doi: 10.5923/j.ijee.20201002.01.
1. Introduction
In an era saddled by mounting energy dependency and insecurity, some are not only turning to renewable geothermal energy to ensure access, but it is growing in usage in the Western region of the United States of America [1,2]. Notwithstanding the United States role as a major producer of geothermal resources globally [3], geothermal energy has over the last several years found ample use in various spheres of daily endeavours within communities in the zone [4]. Considering its attributes as clean, safe, dependable, flexible, and constant [5,6,7,8], geothermal power remains among America’s top selections for cheap renewable energy production essential in multiple applications in both domestic and industrial settings. For that, it has found ample usage in the heating and cooling and in the generation of power to serve communities [9,10]. Even though conventionally, vapor rotary engine at elevated degree of hotness in geothermal resources were required to generate electricity. Current scientific inventions have not only aided electricity production under lesser temperatures with much of that in the Western region, changes in federal regulations in 2005 allowed geothermal energy operations on areas under state control by removing roadblocks to locating amenities therein, yet the sector has not fully grown to the level anticipated [11,12]. However, the prospects for geothermal power remains quite substantial in the US. With numerous accomplishments under a short period and the capacity to generate huge volumes of energy when constructed in line with specifications and market appeal, geothermal power can play a meaningful part in meeting the energy requirements of the country [13]. The surging demand is much so that, it now contributes quite significantly in the generation of electricity to power households and farming activities and to sustain domestic supplies essential to segments of the economy for communities from California to Nevada [14,15]. With much of the production levels, installations and plant capacities of geothermal power fully entrenched in the Western region of the country considering the geologic and physical attributes. California stands out as the largest producer of geothermal power compared to its neighbours in the Western region. Accordingly, current studies by the USGS opine that about over a dozen states in US Western region contain 73,286 megawatts (MW) of geothermal assets that are currently untapped and yet to be discovered. If the region’s geothermal assets are to be fully explored, substantial amounts of employment opportunities are likely to follow in different areas of the country. In that light, the proportion of geothermal operations in a couple of states like California, Nevada, Utah, Hawaii, and Oregon, directly engage up to 1.17 regular employees per MW. Such employment rate seems noticeably higher than coal facilities with 0.18 regular employees per MW [16]. Among the states, geothermal electric production stands as a vital component of daily activities especially in California and Nevada when compared to the basis of power supply in the region. As such, the geothermal power production in California accounts for around 4.4% of the state’s energy use. In the case of Hawaii, about 20% of electricity power supplies comes from geothermal energy. Electricity power generation through power extends also to a handful of states made up of Alaska, Idaho, New Mexico and Oregon. For that, the demand for geothermal resource has been recurrent in quite a few counties over the years within the California side of the US western region [17,18]. In the face of such widespread demands in the region, geothermal energy infrastructure in the form of new plants has gradually penetrated different states under varying level of production and installed capacities to boost energy security and sustain development of the areas[18,19,20,21,22]. Knowing that all these trends do not operate in a vacuum, they are attributed to a set of factors ranging from socio-economic, policy, demographic, physical and ecological forces located within the larger energy milieu of the US Western region [13].Because the environmental impacts of geothermal power hinges on the way it is used or transformed to valuable energy. Direct usage and geothermal high temperature tubes do not have serious adverse effects on the ecosystem [23,24]. Aside from the low carbon footprint, the recourse to geothermal power comes with some upsides, in that it minimizes the utilization of energy sources that impact the ecosystem destructively [25]. Knowing that geothermal power facilities do not burn fuel to produce electricity, discharged atmospheric toxins are minuscule. At the same time, geothermal power amenities provide valuable uses in the areas of domestic heating, aqua culture and together with the energy saving potentials [14]. Even at that, very little has been done in the literature to undertake a regional assessment of the potentials of geothermal energy using a mix scale approach of spatial analysis anchored in Geographic Information Systems (GIS). More so, given the widespread demands. This study will fill that void in research by utilizing mix scale tools of GIS and descriptive states in analyzing the geothermal energy potentials of states in the western region of the United States [26,27,28,29,30,31,32]. There is emphasis on the issues and trends, production and usage and factors. With that, the paper has five objectives. The first aim involves the use of spatial technology to assess geothermal energy use and variations, while the second objective is to create a support device for decision makers. The third aim emphasizes the development of a novel technique for standardizing geothermal power index. The fourth objective is to design a method for regional energy planning with mix scale techniques. The fifth goal is to appraise geothermal energy trends. In terms of organization, the paper is divided into five sections. The first part covers the introduction, while the second part highlights the methods and materials. Section three presents the results of data analysis made up of descriptive statistics, spatial analysis of GIS mappings and factors. Section four deals with discussions while section five provides the conclusions and recommendations.
2. Methods and Materials
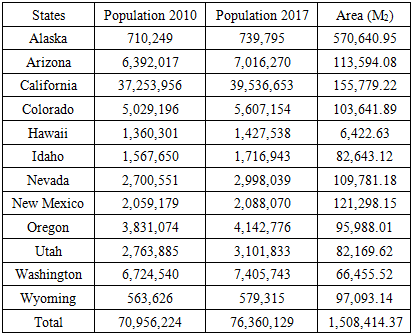
The vast proportion of most geothermal resources are usually adjacent to tectonic plate boundaries and in the US, geothermal power plants are in the Western states and Hawaii, where the energy resources are close to the earth's surface [13]. The study area (Figure 1) with a population of 76 million people as shown in Table 1 [33], covers 1,508,414m2 area in the US Western region. The area stretches from California's St Andreas fault to Imperial Valley, San Francisco, the Cascadian Subduction Zone of Washington and Oregon, the basin and range geologic provinces in Nevada and Idaho [13,34]. The huge reservoirs of hot steam from sub terrains therein, remains vital in unlocking US thermal energy potentials [6,35,36]. Under such a setting, the energy prospects also span all through the rocky fault lines and volcanic sites on the Cascadian Subduction Zone (CSZ) and the central Nevada seismic zone as well as the others pointing North to South. Given that the Western region has vast geothermal reserves estimated at over 9,057 MWe [12]. Separately, California boasts of 5,000 MW in likely new development and around 11,000 MW geothermal assets are awaiting discovery in the state [37,8]. In California where some of the electricity are generated from geothermal energy, the Geysers dry steam reservoir in the Northern part stands as the largest known dry steam field in the world and has been producing electricity since 1960 [37].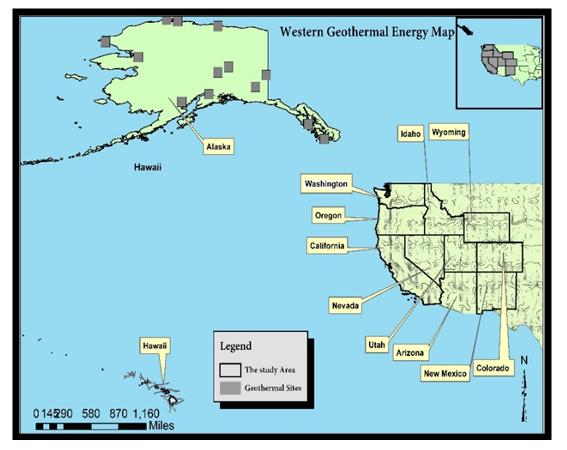 | Figure 1. The Study Area, Western United States |
Table 1. The Population and Size of The Study Area 2010-2017
 |
| |
|
Also, the leading states, (California, Nevada, Utah) have 50-60% of their reserves intact [21]. Since the region ranks as leading producer, geothermal power plants which convert steam generated from shallow hot water reservoirs and rocks deep underground into electricity [38,39,40], are a vital component in the US Western energy security. These sources have ecological benefits considering the low carbon footprint and less emission of Green House Gasses (GHGs) [41]. In that way, the prospects for extended output from traditional and improved geothermal schemes are encouraging with new developments as advances in high tech precision machineries augmented growth in localities that were before un-targeted. Thus, in the August of 2008, about 103 new projects were put into operation in 13 different states. Once fully operational, these ventures may well possibly provide about up to 3,979 MW of electricity, serving the demands of almost 4 million households. At this rate of development, geothermal production in the United States could exceed 15,000 MW by 2025. Just as thousands of megawatts (2,530 MW) exist in seven states: California, Idaho, Nevada, New Mexico, Utah, Oregon and Hawaii, Geothermal power plants in these places do not burn fuel to produce electricity, so their emission levels are quite low [41,42]. They characteristically discharge less than 1 percent of the carbon dioxide emissions of a fossil fuel plant and about 3 percent of their acid rain emissions. In addition to its reliability and sustainability compared to conventional sources [5]. Geothermal energy can power more than 10% of the nation’s electricity [40]. Accordingly, the chief applications consist of ground-source (geothermal) heat pumps (88%) followed by fish farming and swimming pool heating as well as snow melting, and agricultural drying. With the energy savings from all geothermal use in current settings at 11.2 million tons (MT) of equivalent fuel oil per year (74.7 million barrels), the air smog cuts represent about 10.0MT of Carbon and 28.0 MT of CO2 yearly [14].
2.1. Method Used
The paper uses a mix scale approach involving descriptive statistics and secondary data connected to GIS to assess geothermal energy use and potentials and the related issues in Western US over the last several years. The spatial information for the enquiry was obtained principally from several agencies consisting of the United States Department of Energy Department (US DOE), Think Geo Energy, The United States Energy Information Administration (US EIA), the United States Geological Survey (USGS) and Global Energy Development Institute (GENI). Other sources of spatial info emanate from the United States Geothermal Energy Association (GEA), National Renewable Energy Laboratory, International Energy Association, Institute for Energy Research, Oregon Department of Geology and Mineral Industries and American Geosciences Institute. In addition to that, Renewable Energy Network, the Oregon Institute of Technology, International Geothermal Association also offered other essential information in the research. Generally, most geothermal indices germane to the US Western region and the states were obtained from the Oak Ridge National Laboratory, the California Energy Commission (CEC), the US Department of the Interior (DOI) and the Nevada Bureau of Mines and Geology for some of the years.On the one hand, the International Energy Agency (IEA), International Renewable Energy Agency (IRENA), US Department of Energy, Energy Information Administration, Geothermal Energy Association, US-East Africa Geothermal Partnership (EAGP) and United States Energy Association (USEA) provided the secondary data on the ranking, averages and totals of capacity, percentages and production index. On the other, The Nevada Governor's Office of Energy, Frontier Observatory for Research in Geothermal Energy (FORGE) and Sandia National Laboratories and World Energy Council offered the time series data, physical information on geothermal stocks on the major sites highlighting the potentials in the region. For additional data needs, the Lawrence Berkeley National Laboratory, National Geothermal Energy Data Systems and Bureau of Land Management, The Organization For Economic Cooperation and Development (OECD) and the World Energy Council were respectively critical in the procurement of information on the availability of hydrothermal prospects, consumption, prices, and econometric data highlighting usages and the changes. Give that regional and federal geographic identifier codes of the nation were used to geo-code the info contained in the regional data sets. This information was processed and analyzed with basic descriptive statistics, and GIS with attention paid to the temporal-spatial trends at the national, state and regional levels in the west. The relevant procedures consist of two stages listed below.
2.2. Stage 1: Identification of Variables, Data Gathering and Study Design
The initial step in this research involved the identification of variables required to analyze the extent of geothermal energy availability, output and changes at the regional level from 2007 to 2018. The variables consist of socio-economic and environmental information, energy indicators, made up of distribution of temperature of geothermal systems, geothermal infrastructure, the geothermal exploration regions, identified hydrothermal sites and deep enhanced geothermal potential. This is followed by geothermal power generation, hot wells and springs on geothermal sites and geothermal ranking of the country. The number of developing projects, developing PCA, resource and nameplate capacity, utility scale facility net generation, all sectors generation, share of US geothermal electricity produced and percentage and installed geothermal capacity in megawatts are also listed. The others encompass geothermal projects, percent of geothermal developable resource estimate, heat pump shipments, percentage of heat pump shipments, changes in heat pump shipments, geothermal energy consumption estimates and percentage, geothermal capacity in perspective, installed capacity, annual energy produced, percent of installed capacity, percent of annual energy produced, number of units, percent of units, the population and area size. These variables as mentioned earlier were derived from secondary sources made up of government documents, newsletters and other documents from NGOs. This process was followed by the design of data matrices for socio-economic and energy variables covering the periods from 2007, 2010, 2014 to 2018. The design of spatial data for the GIS analysis required the delineation of county boundary lines within the study area as well. Given that the official boundary lines within the country and its regions remained the same, a common geographic identifier code was assigned to each of the states’ area units for analytical coherency.
2.3. Stage 2: Data Analysis and GIS Mapping
In the second stage, descriptive statistics and spatial analysis were employed to transform the original socio-economic and energy data into relative measures (percentages, ratios, averages and rates). This process generated the parameters for establishing, the extent of geothermal energy potentials, production and usage, projections, and capacities, installed facilities, new facilities, heat pump shipments prompted by growing demands for alternate power type and the tendencies being felt throughout the states in the US Western region through measurement and comparisons overtime. While the spatial units of analysis consist of counties, region and the boundary and locations where geothermal power operations and growing use and potentials and prospecting flourished. This approach allows the detection of change, while the tables highlight the actual frequency and impacts, rankings, outputs, and the intensity of usage and the trends as well as the economic costs. The remaining steps involve spatial analysis and output (maps-tables-text) covering the study period, using Arc GIS 10.4 and SPSS 20.0. With the spatial units of analysis covered in the regions and counties (Figure 1), the study area map indicates boundary limits of the units and their geographic locations. The outputs for each state and counties were not only mapped and compared across time, but the geographic data for the units which covered boundaries, also includes ecological data of land cover files and paper and digital maps from 2007-2018. This process helped show the spatial evolution of location of various activities and the trends, the ensuing economic and environmental effects, potentials, benefits, as well as changes in other variables and factors driving geothermal energy surge in the west.
3. The Results
This section of the paper emphasizes temporal and spatial analysis of energy trends in the study area. There is an opening focus on the assessment of geothermal potentials based on energy infrastructure, distribution proportion of power generation and projects. The other portions cover geothermal heat pumps across the states, energy consumption and the capacity using descriptive statistics. This is followed by other parts of the section comprising of GIS mappings, and the factors shaping geothermal energy use in the US Western region.
3.1. Energy Infrastructure
Bearing in mind the significance of new infrastructure in the delivery of geothermal power to communities in the Western region. Out of the overall number of 630 projects at an average of 63 between a span of 5 years in study area. The total number of developing projects by states between 2011-2015 shows Nevada and California as the two leading states with the 267 to 135 at a rate of 24.1 to 43.3% ahead of the others. In the same vein, a trio of states most notably Oregon, Utah, and Idaho accounted for the remaining number (78,66 to 44) of developing geothermal projects. Elsewhere, additional projects even though lower than the previous groups are the ones in several states from Arizona, Hawaii, New Mexico to Wyoming where the number of projects stood at 6, 12 to 2 (Table 2). Added to that, are the total of 7,511 on an average of 750 in the development of PCA, resource and nameplate capacity by state in 2014 in which California and Nevada accounted for 4,731 to 1,460 MW receptively at percentage levels of 62.98% to 19.43% compared to the other states in the zone (Table 3). Of the total of thousand mega hours (Tmhr) in utility facility net generation produced in the Western region between 2017-2018, both California and Nevada outpaced the other states. In the process, the utility scale net generation by sector in the Western region in the fiscal year 2017-2018 shows the state of California held on to the top spot with 867-983 Tmhr. Nevada closely followed up in generated output of 272-288 Tmhr. Among the other states, Utah, Hawaii, Oregon and New Mexico finished behind the top two states as already mentioned (Table 4).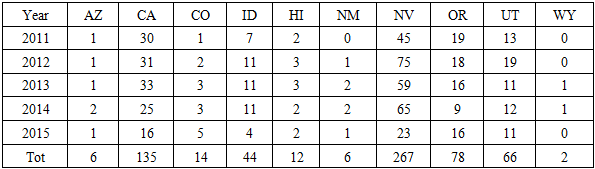 | Table 2. Number of Developing Projects by State |
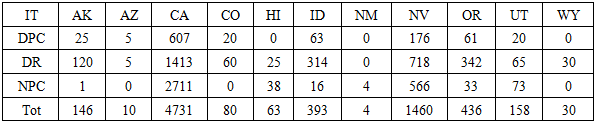 | Table 3. Developing PCA, Resource & Nameplate Capacity by State 2014 |
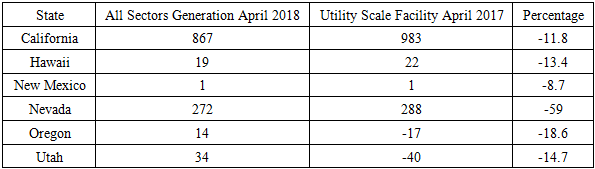 | Table 4. Utility Scale Facility Net Generation From Geothermal Sector April 2018-2017 (Tmhr) |
3.1.1. Distribution Proportions of Power Generation and Projects
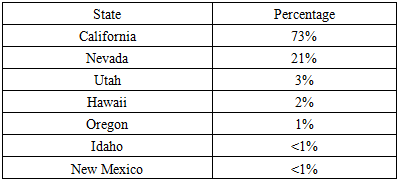
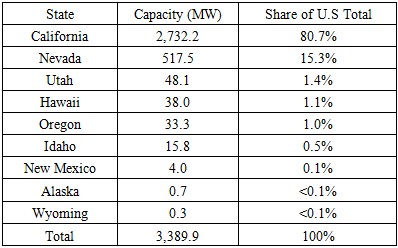
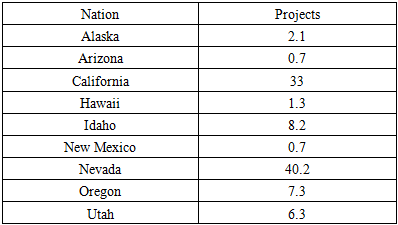
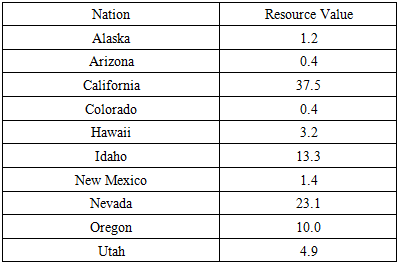
In terms of the distribution levels which US geothermal electricity generated in each state in 2017, California and Nevada held combined 94% of the total share of 73% to 21% respectively while the other quintet of states finished in single digits. The states consist of Utah, Hawaii and Oregon at 3 to 1% along with Idaho and New Mexico at less than one percentage point each in the geothermal power loads during the fiscal year 2017 (Table 5). The same trends hold in 2013 in the study area where the installed geothermal capacity power load among the states in the country indicated major dominance of California with 2,732.2 MW or over 80% of the overall amount of a load of 3,389.9 MW. When compared to the 517.5 MW to 48.1 MW or 1.4 -11% in installed geothermal capacity for Nevada and Utah during the same period, their respective and combined capacity loads are very significantly lower than California. Notwithstanding the 38.0 to 33.3 MW in capacity loads in Utah and Hawaii which represents only1.1% to 1.0% in the share of US total. The installed geothermal power loads among the other states such as Idaho, New Mexico, Alaska and Wyoming in the Western region as of February 2013 remains quite minuscule in comparison to the group of leading states (Table 6). As far back as the 2007 period, the temporal percentage distribution of major US geothermal projects held steady in two states made up of California and Nevada as the former accounted for 33% and the later 40.2%. This represents about 73.2% for the entire US at that time. Another group of states (Utah, Oregon and Idaho finished in the high single percentage digits (6.3, 7.3 to 8.2%) in terms of geothermal projects ahead of the quartet of other areas which comprised of Alaska, Arizona, Hawaii, and New Mexico. The percentage breakdown during May of 2007 for these states were in the order of 2.7 to 0.7% to 1.3% to 0.7% (Table 7). Regarding the projected US geothermal developable projects slated for the long term in 2025 in the various states, again both California and Nevada, will have much higher resource values of 37.5 to 23.1 while neighboring Idaho and Oregon shall also maintain double digit proportions of 13.3 to 10.0%. The third-tier states on the tabular listing have lower percentage geothermal resource values estimated at 3.2 to 0.4 (Table 8).Table 5. Share of U.S. Geothermal Electricity Produced By Each State in 2017
 |
| |
|
Table 6. Installed geothermal capacity in megawatts (MW) by state as of February 2013
 |
| |
|
Table 7. U.S. Geothermal Projects as of May 2007 In Percent, by State (Source GEA)
 |
| |
|
Table 8. U.S. Geothermal Developable Resource Estimate (WGA)*In Percent, By State, Long-Term 2025
 |
| |
|
3.1.2. Geothermal Heat Pumps Distribution
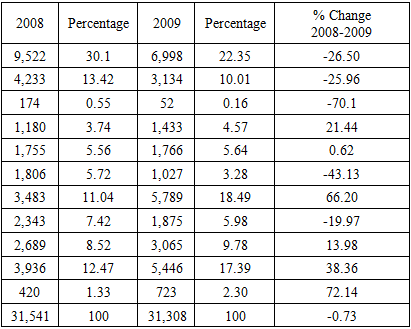
In the other years, the total value of geothermal heat pomp shipments in 2008 through 2009, went from 31,541 to 31,308 tons in the entire region. Among the states, California and Colorado saw notable drops of 9,522 to 6,998 and 4,233 to 3,134 tons in geothermal heat pump shipments. In a similar vein, during 2008 to 2009, Oregon also posted declines in heat pump distribution from an opening value of 2,343 tons to 1,875 tons. At over 3000 to 5000 tons in heat pump deliveries from 2008 through 2009, North Dakota and Washington experienced upticks in their shipments by destinations. While the states of Utah, Wyoming, Idaho and Montana all had increments in heat pump shipment as the respective high temperature fluid volumes for the states ranged from 2,689 to 3,065 tons, 420 to 723 tons, 1,180- 1,433 tons and 1,755 -1,766 tons (Table 9). With California accounting for the highest percentage compositions and volumes of heat pump shipments all through 2000 to 2009. During the same periods, the individual state percentage levels in thermal pump shipment for California and Colorado dropped substantially from 30.1 to 22.3 and 13.42 to 10.01% respectively. Elsewhere, the percentage levels of geothermal heat pumps for North Dakota and Washington grew notably in double digit values of 11.04 to 18.49% and 12.47 to 17.39% all through 2008 and 2009 fiscal year. Among the group of other states in the medium tier group and active in geothermal heat pump shipments across the US Western region. Oregon and Utah saw their percentage share of the market vacillate in the order of 7.42 to 5.98 and 8.52 to 9.78, while Idaho, Montana and New Mexico maintained low single digit values of 3.74- 4.57% and 5% plus between 2008 through 2009. Wyoming and Hawaii on the other hand posted varying percentage levels in geothermal energy shipments estimated at 1.33 to 2.30 and 0.55-52% as well. The changes in the geothermal heat pump volumes from 2008 to 2009 showed a mix of gains and declines with over -25% in drops in geothermal shipments by destinations in both California and Colorado coupled with -70.1% for Hawaii. The other states that experienced declines (of -43.13 to-19.97%) in heat pump shipments during 2008 to 2009 includes New Mexico and Oregon. Another twist to the extent and nature of gains as evidenced in the table involves the level of surge in shipments of heat pumps valued at 66.20% to 72.14% in North Dakota and Wyoming as a trio of states Idaho, Utah and Washington finished with further gains of 21.44, 13.98 to 38.36% (Table 9).Table 9. Geothermal Heat Pump Shipments by Destination, 2008 and 2009 (rated capacity in tons and %)
 |
| |
|
3.1.3. Energy Consumption and Capacity
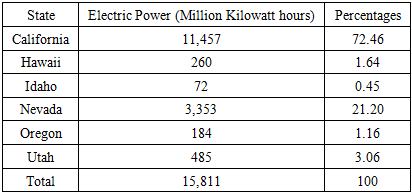
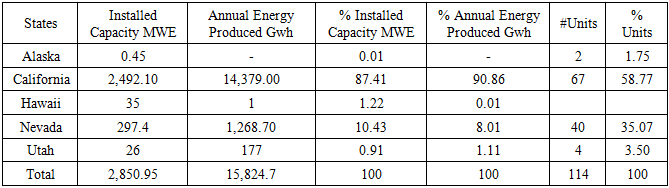
In 2016, the state of California stood out as the largest consumer of geothermal energy in the Western region. The power loads of 11,457 of Mkwh and 72.4% of the 15,811 Mkwh in total values for the state during that year is a testament to the growing activities and usage levels. Nevada being the nearest state when it comes to consumption, used up to 3,353 Mkwh, which ranked as equivalent to 21.2%. This was followed by Oregon, Utah, Hawaii and Idaho where geothermal energy uses mostly in the low single percentage digits of 3.06% to 0.45 ranged from 485 to 72 Mkwh in 2016. At an average of 2,635 Mkwh and 15,811 Mkwh in total geothermal energy consumption estimates in 2016 for 6 states in the study area. Note that even though both California and Nevada accounted for 93.66% of the entire load. The states of Utah, Oregon and Hawaii and Utah all finished in single digits (Table 10). In putting geothermal capacity into perspective, see that the study area holds a total of 2,850.95 Mwe to15,824.7 Gwh under 114 units. Of all these indicators, the state of California and Nevada once again surpassed the rest of the areas in terms of the loads and the actual units. From the Table on geothermal energy capacity based on installed capacity and annual energy output alongside the percentages and the units. Among the major producers California had installed capacity and yearly output load of 2,492.10 MWE to 14,379.00 Gwh at percentage equivalents of 87.41 to 90.86%. The energy produced comes from 67 units out of the total of 114 representing 58.77%. In the case of Nevada, geothermal capacity indicators ranged from 297.4 mwe to 1,268.70 Gwh in installed capacity and yearly power output with percentage levels of 10.43 to 8.01% from 40 units (Table 11). Table 10. Geothermal Energy Consumption Estimates, 2016
 |
| |
|
 | Table 11. Geothermal Capacity In Perspective |
3.2. GIS Mapping and Spatial Analysis
The distribution of temperature of geothermal systems in the study area reflects many scales representing high, medium and low in different colors of blue, light green, light yellow, yellow, orange and light red spread across the states. The spatial mapping involves collection of objects in space denoting sites of geothermal systems of certain temperatures from the Pacific North west zone of Washington to the Desert South West area of New Mexico. Accordingly, the schematics embedded in the map further shows that from the different metrics listed on the legend box. The highest temperature scales of 86-110 to 114-140 in orange and light red colors seemed more visible in central, western and Eastern Nevada, Northern and Southern California, upper and lower Idaho, Northern Oregon and Northern New Mexico. The spatial concentration of medium scale (46-65 to 66-85) forms of geothermal systems in yellow color spans from middle and lower Washington on to central Oregon and multiple places in Southern Idaho. The spatial patterns continued by a notable stretch with clusters of that all over upper and lower Nevada, western and north Western Utah, north western New Mexico and portions of southern California and Arizona. The lower temperature scales of 23-32 and 33-45°C in blue and light green seemed fully concentrated in Utah, Nevada and Idaho amidst meagre clusters in California, Washington, Oregon and New Mexico (Figure 2).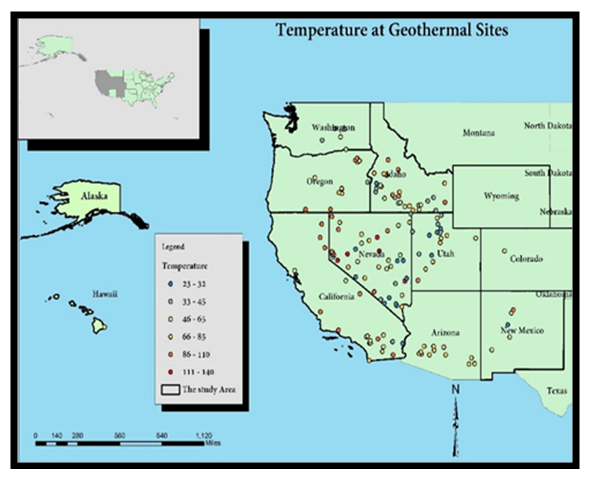 | Figure 2. Temperature at Geothermal Systems Sites |
When it comes to geothermal infrastructure, the map highlights a mix of projects captioned under development and those power plants already in existence represented in black and purple colors. It is obvious in the display that apart from quite a few spots with projects solely under development in upper Washington, emergent projects are evident in central Colorado and Eastern Arizona. In areas where both indicators (projects under development and existing power plants) flourished, both Southern, central and Northern California showed signs of activities in both areas. In the nearby states of Oregon and Idaho and Utah, these types of projects remained in full swing in different places. Of great importance are the notable spread of sites in black and purple dots dedicated to geothermal facilities in South Eastern Oregon and central Oregon and Southern Eastern Idaho. In the middle of the map, see also the convergence of those dual amenities in Northern and Southwest Utah along the singular spot in Southern New Mexico as well. Interestingly, the dominance of Nevada in every category of the geographic display of geothermal facilities is so remarkably firm in space that the designated sites in black and purple colors extends from the entire South west, the North west to the North east portions of the state (Figure 3).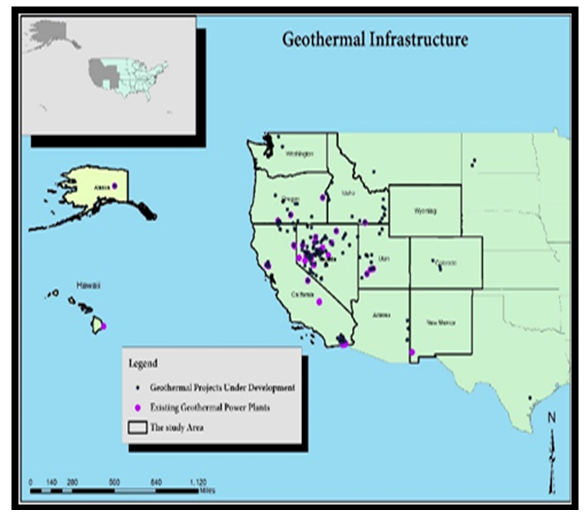 | Figure 3. Geothermal Infrastructure |
In a part of the United States where the geothermal exploration regions in yellow extends from portions of upper and lower Washington and Oregon, Wyoming, and sizable areas in Idaho and California. The entire places in Nevada and vast portions of Utah and Arizona, Colorado and New Mexico all form part of the western geothermal zones where the activities are continually springing up. From such patterns, it is then unsurprising that the geothermal spots of the highest order in favorability sites in red remain intact. Being tagged potential areas with the subterranean hot rocks and assets. The locations span the geologic provinces from the upper pacific north west states of Washington, Oregon, portions of southern California to Idaho. As an area deeply rich in geothermal assets, it traverses parts of Nevada, Utah and Colorado in the center to New Mexico in the Desert South west area as well. The sites with limited potentials in blue under the respective forms are also quite visible (Figure 4). 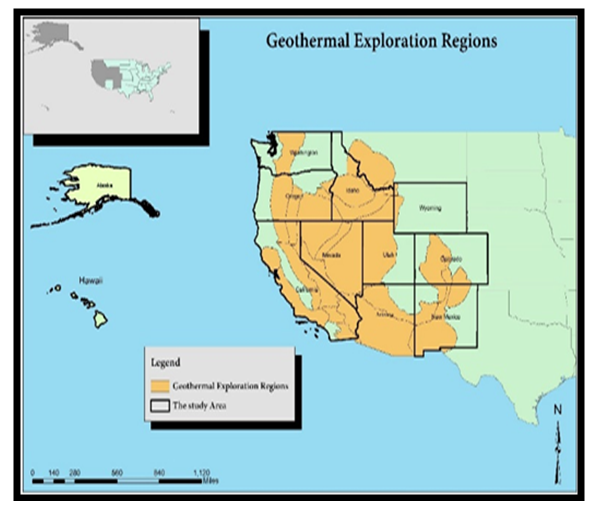 | Figure 4. Geothermal Exploration Regions |
Looking at the (major) identified hydrothermal sites scattered around all through the study area, much of the locations seem concentrated notably along Oregon, the Nevada, Idaho and northern California Axis and Alaska. The robust network of identified hydrothermal sites in those five group of states exceeds those found in a handful of states from south west Utah, central Colorado to upper and lower New Mexico. This coincides with the spatial dispersion of the western volcanic fault lines beginning from the upper north west areas of Washington, Alaska, Hawaii, Oregon and upper portions of California onto the Pacific Ocean and pockets of areas within the states of Idaho, Utah, Arizona and the New Mexico axis (Figure 5). 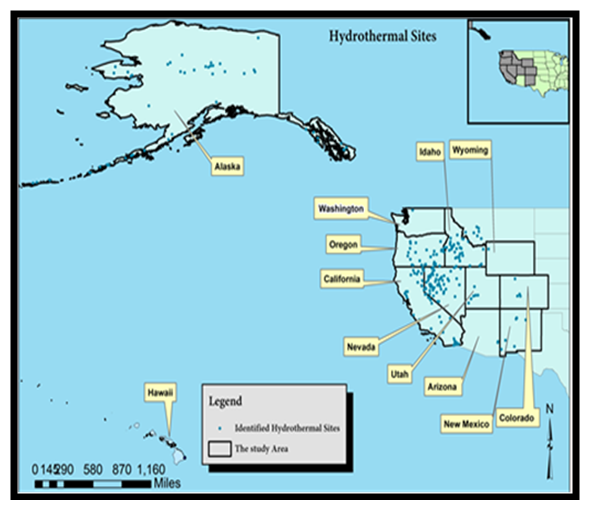 | Figure 5. Hydrothermal Sites |
When it comes to deep enhanced geothermal potential, the most compelling evidence of the presence as manifested from the map entails various indices made up of the most favorable spots as indicated in red and the least favorable in light green. The others include those lacking the necessary data. In taking that into consideration, one thing that stands out as shown in the maps is that most points in space denoted by much favorability, stretches from the Pacific North West end to the South west Desert ecozone. In a much closer look, note that the red-hot spots in deep enhanced energy potentials maintained strong visibility in a trio of places made up of the states of Washington to nearby Oregon and Idaho in red and orange and in some portions of Wyoming. Clusters of areas with deep enhanced favorability in geothermal potentials also exist alongside the less favorable sites in green along the upper and lower portions of California especially around the North East border with Nevada and South east border near Arizona as well as the North East part of Oregon. Elsewhere, while the Nevada and Utah axis share identical terrains favorable to deep enhanced geothermal outlook, sizable chunk of Colorado land areas have high favorability in the South, North West and Central areas. The same can be said of Arizona and New Mexico where the potential sites run from the Upper North, Western and South west areas (Figure 6). Other aspects of the thermal favorability in the context of geothermal potential under different scales can be gleaned from Figures 7 to 8. 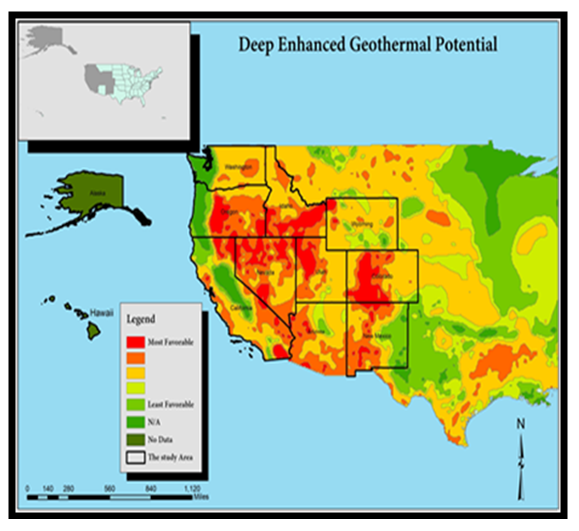 | Figure 6. Deep Enhanced Geothermal Potential |
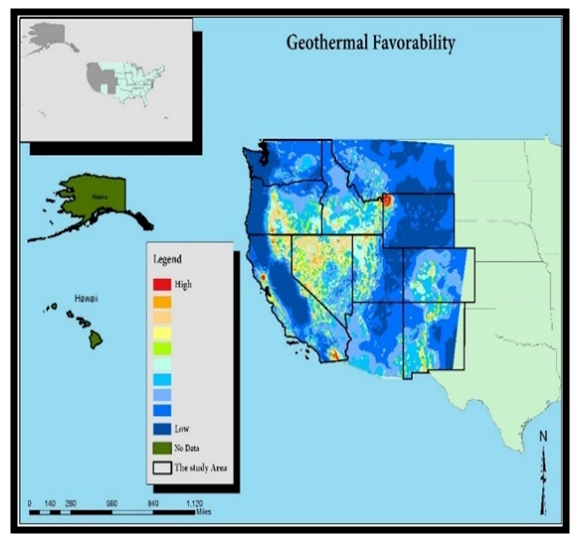 | Figure 7. Geothermal Favorability |
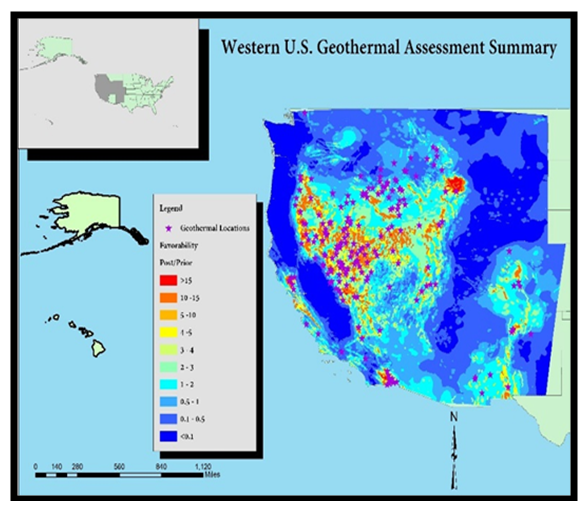 | Figure 8. Western US Geothermal Assessment Summary |
The extent and forms of hot wells and springs on geothermal sites point to enormous presence of these indicators beginning from the upper north west zones of the study area to the central portions and lower coastal zone and the desert southwest. With the springs and wells classified under blue and red colors, there seem to be sizable shift in terms of wells towards the southern part of the study area. While the distribution of wells involves visible presence of red dots spread across southern parts of California, lower and upper Arizona and New Mexico and other areas in the upper north west states. The hot springs distribution in place, reflects a robust pattern that is ideal and favorable to geothermal production in the designated sites in space throughout the states (Figure 9). This is followed by the spread of volcanic sites and other geothermal potential areas germane to production and delivery of power (Figures 10 -11).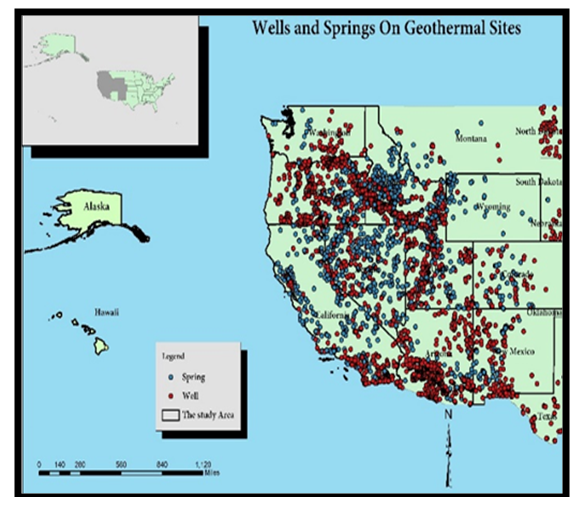 | Figure 9. Wells and Springs On Geothermal Sites |
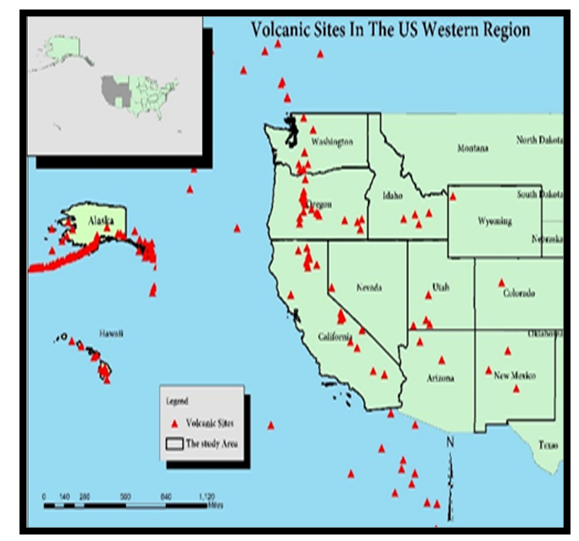 | Figure 10. Volcanic Sites In US Western Region |
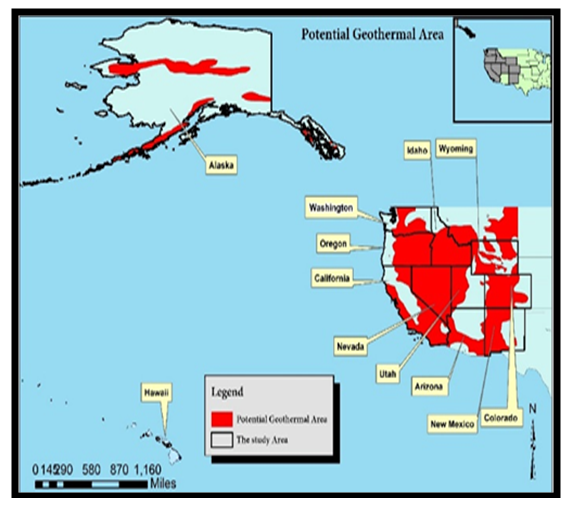 | Figure 11. Potential Geothermal Area |
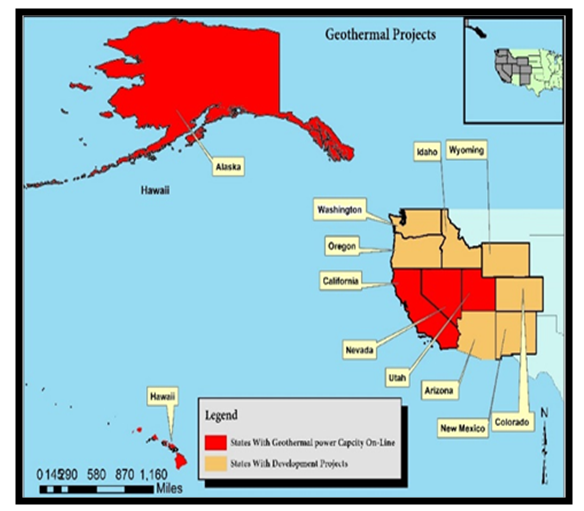
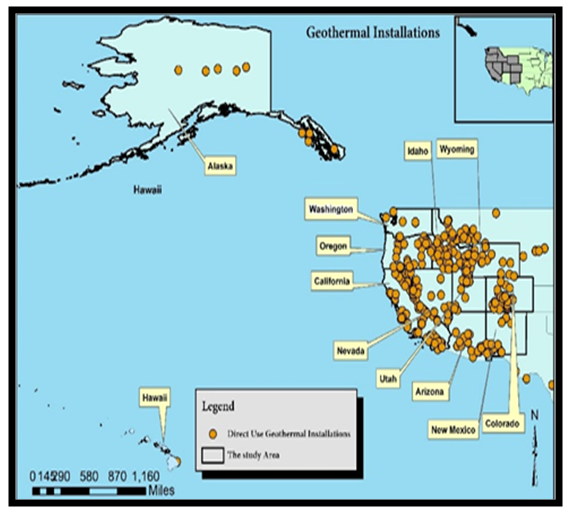
From the geothermal ranking of the country, the top four states comprise of California in the southern zone rated as the number 1 alongside the two central states of Nevada and Utah, listed as 2 and 3 and the 4th state Hawaii in the south Pacific. Note also the presence of other ranked states along the Pacific North made up of Oregon and Idaho classified as 5th and 6th in geothermal power ranking in the US. Elsewhere in the Desert south west axis, New Mexico stands out as the 7th ranked state in geothermal power (Figure 12). In the context of geothermal power generation, the variables in the map show areas with currently installed and planned facilities in white and yellow. Among the states in the study area, California and Nevada lead the other states in all geothermal indicators with 2,565.5 to 426 in currently installed power production coupled with 1,609.7 to 1,997.7 and 2,120.43 -3,66.43 mw in planned geothermal loads. Aside from the trends in Oregon, Utah and Idaho, both currently installed and planned power output were miniscule in the rest of the states from Wyoming, Colorado, Arizona to New Mexico as well as Hawaii and Alaska (Fig 13). Added to that, are the places with geothermal projects under the dual categories of online capacities and development projects. In the former, as denoted in red color, California, Utah, Nevada, and Hawaii and Alaska maintained the dominance, while development projects in brown extends extensively from the upper side of the map in Washington, Oregon, Idaho, Wyoming, Colorado and New Mexico (Figure 14). From the mappings, note also the spatial concentration of geothermal installations based on direct use stretching from Hawaii to Colorado (Figure 15). 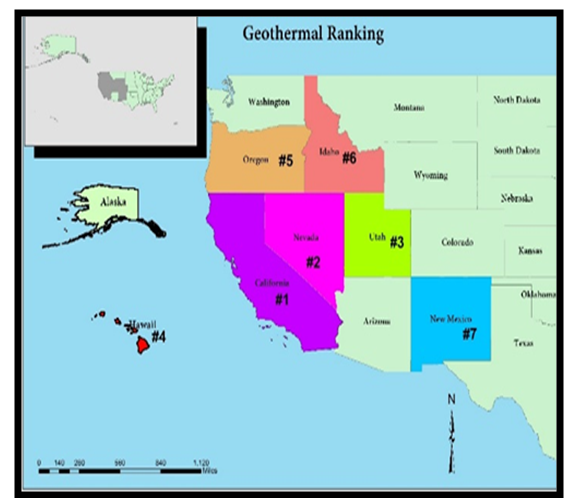 | Figure 12. Geothermal Rankings |
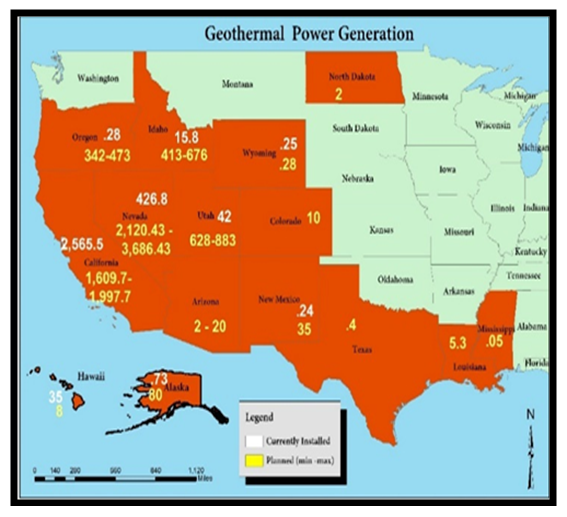 | Figure 13. Geothermal Power Generation Installed and Planned |
 | Figure 14. Geothermal Projects Power Capacity and Developed Projects |
 | Figure 15. Geothermal Installations based on Direct Use |
3.3. Factors Driving Rising Use in Geothermal Energy
This section of the paper describes factors behind the activities in the sector. Considering the place of the US Western region as the nation’s premier hub for geothermal power generations, the extent of usage and production capacity in the last several years did not happen by coincidence. Surely, it is attributed to many elements associated with policy, socio-economic parameters, physical and geological terrains and environmental benefits. These four elements are listed in the paragraphs below one after the other.
3.3.1. Policy Promulgation
Looking at the US policy environment at the federal level over the years in the energy industry, the geothermal power sector benefited immensely given the volume of funding opportunities. The disbursement of such funds was instrumental in the execution of several programs deemed crucial to growth in the industry in the US western region. Being a major catalyst critical in the ensuing surge in the sector. Providing such pools of needed funds to entities tied to the sector exemplifies rightful ways of fulfilling the objectives of government policy while ensuring their chances of success. The presence and the award of 216 nationally funded geothermal power projects in 2016 in such settings augmented the probability of program delivery as witnessed in the geological provinces throughout the US western region. Also, the enactment of the American Recovery and Reinvestment Act in 2009 added further boosts to the sector through the delivery of $360 million towards innovative geothermal research and development, the design of pilot projects and job opportunities. Added to that are the spark furnished from the availability of state Renewable Energy Portfolio standards (RPS) which demands that some proportion of electric power be supplied via renewables [12]. Another dimension to the role of policy in the geothermal sector stems from the state of California, where state legislators are deliberating if power consumers in San Diego should support proposed group of new geothermal power facilities in the area. The planned policy stresses ample commitment of state backed power companies such as San Diego Gas and Electric and others to jointly purchase 500 MW of electric power through fresh geothermal facilities wherever in California in the ensuing 10 years, enough to serve about 300,000 households. Supporters opine that the law is intended to spark geothermal resurgence along the Salton Sea part in the Imperial Valley, now ranked as the number two among such centers in the country’s biggest hubs [43].
3.3.2. Socio-Economic Viability and Population Change
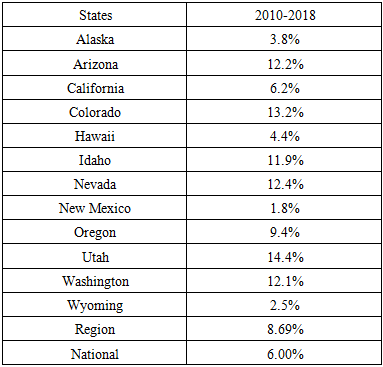
The favourable economic conditions prompted by the directions of fiscal policy at the state and federal levels set the stage for the changes in geothermal production witnessed in the US western region. While these parameters influenced the pace of growth and the prevalent activities in terms of distribution, sale and supply of geothermal energy resources to needy consumers in the zone over the years. It remained indispensable in fuelling sudden penetration into sectors like agriculture and households in various communities where power generation from geothermal facilities served useful purposes. That seems to be the case in the Desert south west state of Nevada where its second to none pro-business setting for geothermal energy resonates among investors across continental USA and the world in general. Current insights among program designers and insiders indicates that the government agenda in Nevada ensures expedited access for potential financiers wishing to undertake resource exploitation, considering the large volumes of geothermal assets and operations therein. In that way, the state of Nevada ranks quite high nationally and globally in terms of nameplate capacity. Further on the economic front, consider also that the upsides from the extension of production tax credit (PTC) scheme through the US Congress till 2015, and its 2.0 cent for every kwh credit, convinced many businesses to commence fresh ventures. While additional inducements consist of the then $400 million stimulus capital earmarked for geothermal power and disbursed towards different geothermal ventures. The tax rebate of 30% which focused on heat pump as part of the 2005 energy policy act with extensions deep into 2009 fiscal year, optimized the confidence level in the energy market. The US government on its part, further authorized another 30% investment tax rebate to sustain the marketing activities of geothermal power facilities. This made it possible for the sector to penetrate consumers within the energy booming markets in a region where average population growth rates of 8.69% over the years outpaces the rest of the nation (Table 12). In serving the energy needs of local consumers that way, the policy initiatives fully augmented the capacity of geothermal power to match fossil fuel production in electricity supply and common usage among consumers.Table 12. The Population Change In Percentages 2010-2018
 |
| |
|
3.3.3. Physical and Geological Terrains
Another way to explain the reasons behind the ongoing changes in geothermal thermal power output in the study area of US Western region revolves around the physical and geological factors inherent in the zone. The dominance of the western zone in geothermal output generated in areas like California, Nevada and Utah did not happen by accident considering its presence in the pacific ring of fire, the natural abundance and occurrence of the essential raw materials needed in power generation [35]. Such relative advantage in the West coincides with the rudiments vital in the siting of geothermal power facilities. Since most geothermal facilities usually are constructed in places near to naturally occurring sub terrain thermal reservoirs measured at least 2 mile deep. Geothermal power often comes back into land surface or exterior plain through multiplicity of forms including volcanic eruptions, geothermal heated ground water out of the earth crust (hot springs) and geyers. For that, in the fiscal year 2017, when US geothermal facilities accounted for 16 billion-kilowatt hours kWh, representing 0.4 percentage points of US overall electricity output. Much of that geothermal power with the capacity to sustain electricity production occur largely in the US western region known for its fresh volcanoes and mountain formation process. This includes the San Andreas Fault lines, which extends via California through the Imperial Valley to the San Francisco Bay area and the Cascadian Subduction zone along the shoreline lines of Northern California. All these sources together represent the foundations driving the considerable part of the geothermal production process in the US, hence the extent of variations witnessed in the study area over time. With that, the geologic provinces spread across many states represent a zone of unprecedented growth in geothermal production. Accordingly, the Salton Sea part of Imperial county as an exceptional terrain, not only also provides opportunities for hot geothermal water bound to the surface to produce power loads estimated at 1,700 MW to 2,900MW, but the geothermal assets in the zone exhibits the largest capacity factor of 92% in terms of reliability.
3.3.4. Environmental Considerations
Seeing that the activities that influenced the production of geothermal power in the last several years emanated from host of other elements. The ecological forces behind the surge in the US Western region are not farfetched. Given the limited carbon footprints from most geothermal power operations in the states under analysis and the benefits, had they been viewed as threatening to areas adjacent to production facilities, regulatory interventions would have clamped down the operational activities and the rising power output as witnessed. Because that was never the case, geothermal producers involved in the daily generation of power from their facilities fully focused on the continual supply to consumers in the region, hence the consistency in output among the major producers in the Western region. Accordingly, geothermal power production and distribution to consumers had some lasting impacts on the welfare of communities as it lessens the over consumption of energy resources known for damaging presence on the ecology. Because geothermal facilities produce minimum volumes of toxic pollutants synonymous with fossil fuel in the generation of electric power loads, the exposure to hazards and threats to public health is limited. The other advantage is that since geothermal energy facilities utilize scrubbers to eliminate naturally occurring hydrogen sulfide in geothermal basins, the facilities only discharge 97%-99% fewer sulfur compounds associated with acid rain and CO2 than fossil fuel powered plants [41]. Accordingly, the energy conservation and pollution prevention benefits from geothermal power utilization are ecologically benign, hence the adoption in the region.
4. Discussion
Based on the assessment carried out, the enquiry highlighted the various potentials of geothermal power parameters made up of developed projects, electricity power generation, capacity, rankings and the changes, averages and totals amongst numerous indicators over time. With these trends fuelled partly by a host of socio-economic, policy and environmental health elements associated with geothermal usage and output in the US Western Region’s energy sector and the country in general. Mix scale tools of descriptive statistics and GIS reinforced the linkages among the factors and the recurrent consumption of geothermal power loads in the study area. Moreover, the sequence of noticeable geographic patterns symbolizing volcanic sites, hot wells and springs, geothermal sites, production, usage levels and temperature across space, serves as a measure of the activity levels in the West. Whereas the spatial visualization presented detailed clusters and diffusion patterns of the distinct geothermal energy indices like favorability, hydrothermal sites, temperature scales, production capacity, generation, deep enhanced sites infrastructure and potentials along the identified locations areas across the various periods. The ensuing spatial forms that held firm in certain places and only to evolve over time, ushered in insights onto the operations of the sector pertaining to output, ranking, energy usage and geothermal power amenities, facilities and projects development around the geologic provinces of the Western region. This includes sites holding the nation’s existing (and untapped geothermal) potentials in the study area where more than 12 states sit on over 73,000 megawatts (MW) of geothermal resources with California as the leading source.This comes in the wake of rising importance of geothermal power among users in different facets of the political economy and the environment ranging from residential areas, industries, power and utility and CO2 pollution prevention, and energy conservation. Such observation stands out quite remarkably well, given the rising pace of energy costs and fluctuations in the marketplace, at a time in which geothermal energy accounts for 10% of US electricity power supply. The ongoing assessment of geothermal power potentials in the study area as well, re-echoes the notion that throughout the entire US, the Western region ranks exclusively as the principal source of geothermal energy, while the states therein, dominate by over 90% in the volume of electricity power produced by geothermal energy in the country. Seeing the widespread capacities in place, it serves useful purpose to underscore the extent to which fiscal and ecological significance that come with geothermal power keeps driving policy incentives and support for it at various tiers of governance in the country. Having seen the lower carbon footprints in comparison to conventional sources based on reliability and sustainability as explained from the applications through heat pumps, aquaculture, swimming pool heating and energy conservation and power generation for communities. Much of that would be unthinkable without electricity production via geothermal power loads.Additionally, geothermal energy assets and facilities in the Western region showed some steadiness beginning in the California's St Andreas fault lines to Imperial Valley and the Cascadian Subduction zone. Besides, there are clusters of areas near to the geologic provinces in Nevada and Idaho sitting on top of these non-conventional energy possessions. Further on the geothermal exploration regions emerges portions of places in upper and lower Pacific North West areas near to Washington and Oregon that are germane to the regular supply of power. The same can be said of the network of enhanced geothermal potential corridors marked by favorability index stretching through the Pacific North West zone to the South west Desert ecozone. Regarding the temporal distribution of the individual indicators amongst the states and their respective weights, out of 630 geothermal projects under a period of 5 years in the zone. The profile of developing projects by states all through 2011-2015 points to Nevada and California as the top states accounting for 267 to 135 of them which represents 24.1 to 43.3% of the totals. In a similar vein, California and Nevada held combined 94% of the total level of share of US geothermal electricity generated, among producers in each state in 2017, as groups of other states posted marginal proportions respectively in the lower digits. Given its size, it is not surprising that California was ranked high as the largest geothermal consumer in the West in 2016. The power load of 11,457 kwh and 72.4% of the 15,811 kwh total values for the state during that year, affirmed the surge in activities and usage, as the nearest state Nevada used up 3,353 kwh to 21.2%. Additionally, geothermal heat pumps shipments to serve communities points to a mix of gains and declines among some of the states. In the context of the factors, the policy support towards geothermal power development in the region, comes from the accrued benefits from consistent funding possibilities available to the sector, and crucial in project deliverables. Added to that, are the presence of critical geophysical materials from volcanic sites to others highly indispensable in power production in Nevada, California and Utah in the form of hot steams. Aside from the proper use of applicable fiscal tools which set in motion the respective policies fuelling the surge in the region. Geothermal power supply adds some essential benefits to the wellbeing of communities, given the capacity to shield vulnerable ecosystems from the destructive exposures to the risks posed by CO2 and noxious emissions through fossil fuel barely seen in geothermal facilities. Overall, these results point to changes, surge in output and usage, growing capacity, new projects and California’s dominance, while the GIS mapping pinpointed dispersal of geothermal activities and potentials. With the uptick in geothermal and ecological benefits attributed to socio-economic and physical elements, the paper proffered suggestions ranging from the design of a regional geothermal energy information system to the need for more power infrastructure. See the Appendix for more on the suggestions.
5. Conclusions
This enquiry assessed the state of geothermal energy potentials and usage in the US Western region known for its vast abundance in sub terrain geologic treasures driving the ongoing surge in the production of power loads with notable outcomes under the ensuing headings. a) geothermal energy plentiful; b) completely rooted as power source; c) deep potentials in the sector; d) mix-scale method efficient; e) the surge in geothermal use linked to many elements. Based on the study, the US Western region contains considerable volumes of geothermal energy assets buried beneath the tectonic plate boundaries and volcanic sites along the states where the energy resources are adjacent to the earth's surface. This frontier of energy spans from the grid lines and geothermal sites starting from the California’s St Andreas fault to Imperial Valley, San Francisco Bay, the Cascadian Subduction Zone of Washington and Oregon, the shorelines of Northern California and the geologic provinces in Nevada and Idaho. This is occurring at a time in which the huge reservoirs of hot steam from sub terrains therein; the foundations of US geothermal energy potentials under higher temperature are the centerpiece of public debates. This is occurring amidst geologic prospecting and speculative activities among decision makers and investors on geothermal power output given the low carbon footprint. Accordingly, the Western region contains large-scale geothermal reserves valued at over 9,057 MWe. Because the geothermal power in the zone come through various systems including volcanic eruptions, hot springs and geyers. The western region’s geothermal power base possesses the capacity to sustain much of the electricity production given its fresh volcanoes and mountain formation process. The gathering of such facts on energy index in this research, remains highly indispensable in the energy commodity and project design settings. In such places where prospecting and speculative activities on tradable resources are of importance to cities and investors in major centers of the US western region with appeal to stakeholders. The enquiry as a result does hold promise as an essential device for policy makers, resource analysts and energy planners in the renewable industry, charged with advancing the sector and courting investors to fund ventures in such a rapidly growing frontier of geothermal power in the US Western region. Stressing US Western region’s geothermal power abundance information in this way reiterates the import of this study in enhancing the ability of policy making through better insights for the industry.Essentially, the magnificent surge in the geothermal energy industry over the last decades in the St Andreas fault, the Imperial Valley, San Francisco Bay, the Cascadian Subduction Zone of Pacific North West and the geologic provinces in Nevada and Idaho along the US western region stems from the foundations and activities inherent in those settings. With the natural geologic ingredients intact in various states on its side than the other regions in the country. The opportunities therein spurred investments and usage at various levels over the years in geothermal power. Surely, the sector seemed to have completely established itself as legitimate actor and a non-conventional provider of energy given the acceptance and spectra of infrastructure springing up across the states in the region over the years with both state and private sector backings. The current info on a set of geothermal energy indicators as revealed by output, distribution, project development and the naturally occurring sources, shows they are spread over the region. This involves the activities beginning in 2011-2015 and the projections into developable resources slated for 2025. Such endeavors and prospects affirmed the full reliance on geothermal loads in electricity power production essential for continued access and energy security in the region. This has been reinforced by the infusion of hundreds of millions of dollars through the passage of the American Recovery and Reinvestment Act in 2009 to sustain the geothermal industry in the march towards innovation and creativity, and the generation of employments. Against that background, over time, geothermal energy activities saw greater currency under various categories of indicators with growing infrastructure, installations, capacity and consumption levels in the face of novel projects serving energy demands of many communities and industries. The capacity of this study in highlighting the growing part of geothermal power as reliable alternative in energy planning in the West, provides a tool for managers focused on presenting the industry as the option to non-renewables in energy security.From the aggressive pursuit, the essence of novel facilities in driving geothermal energy supply of the communities in the Western region remains evident by the presence of 630 amenities in the zone. The penetration of the bulk of projects deep into the principal states of California and Nevada comes in the face of resurgence in the energy markets of these areas. Given the over 73,000 MW in unused geothermal treasures among states in the western region. Unlocking those geologic assets would not only boost energy security through supplies to communities, but numerous job prospects have potentials to turn those areas around in and outside the zone. In view of that, existing records opine that volumes of geothermal operations in a quintet of states made up of California, Nevada, Utah, Hawaii, and Oregon, clearly serve about 1.17 workers for every MW. Realizing how the generation of geothermal electric power output, remains an essential dimension of everyday operations specifically in California and Nevada, in the context of energy distribution in the zone. What seems overlooked herein, stems from the emergent role of geothermal developable projects likely to hit the marketplace in the study area in the upcoming years. Since many investments from the sector in the Western region draws from the future potentials, especially in the next couple of years like 2025 throughout the states. The projected values allotted to individual states (California, Nevada, Idaho and Oregon) show, they will gain the center stage in terms of resource values for the long term. Out of the totals (2850.95 Mwe to15,824.7 Gwh) in the capacity of current operations under installed annual volume and yearly energy output. California and Nevada notably dominated by 87.41 to 90.86% and 10.43 to 8.01% in those categories of indicators. Accordingly, the need for geothermal assets has grown around many counties in the last years in the California axis of the study area. Such prospects in the sector has consolidated the Western region as the center of US geothermal power and the largest source nationwide with California on top of it.Besides, the direct uses of mix scale methodology as investigative device remain very efficient and precise. Coupling descriptive statistics and GIS mappings within the framework as operational tools, added novel thoughts in evaluating the extent and form of geothermal power consumption and output. The model appeared overly essential in defining the place of study and sorting the activities therein, alongside the compilation of data on the various factors and array of variables from the number of developing projects to heat pump shipments and host of others. This model is very vital to scholars and planners focussed on the mission of assessing geo-spatial dimensions of the underlying issues in geothermal energy enquiry in the US Western region. While GIS mapping pinpointed the spatial dispersal of geothermal activities and potentials, and their sources spread along the geologic provinces across the Pacific North West area, the South west Desert ecozone and the Nevada and Idaho basins. As an energy planning tool, it is quite essential in stressing the presence of vast geothermal energy indicators, the level of their dispersal and the evolving patterns across space. Such advantages illustrate a key leap into efficient energy planning, given the large presence of geothermal assets in the Western region. From the GIS analytics, critical energy parameters germane to the geothermal sector showed vast concentration in many points in space indicative of the enormity of thermal treasures beneath the geologic fault lines crucial to the production and distribution of power loads over time. The capacity of spatial mappings in highlighting the various potentials from project development to temperature scales over the years, did stand out as the region braces for new opportunities destined to boost geothermal energy production and usage. In that way, the use of mix scale techniques based on GIS assessments as a tool, enhances future understanding in a manner that improves decision making and capacity of managers in geothermal power planning in the West.Furthermore, socio-economic, population, policy and physical and environmental elements located in the regional geothermal energy structure played an indispensable part in appraising the evolving state of the industry in the western region. In showcasing the relevance of these indices in the region’s geothermal energy activities. The enquiry indicated the extent to which good policies shape production and new developments in the sector, amidst continual relevance in the welfare of cities reliant on the successes of funded programs and the pro-business environment. Above all, the physical attributes of the geothermal areas therein, based on the geology of the San Andreas Fault lines, the Cascadian Subduction zone, the elevated temperatures and the hot springs are in abundance than any place in the US. Their presence in the region at capacity/reliability factor of over 90% furnished the ingredients that spurred energy supply to communities and industries considering the booming markets and growing populations. Thus, it is then unsurprising that the areas located within the geologic provinces from Nevada to Western Utah saw notable uptick in geothermal output, hence the variations in output in the zone over time. In as much as the conducive fiscal climate that trickled through the study area set the stage for the resurgence in the geothermal sector. During an era in which mounting ecological liabilities from the energy sector often draw stiffer penalties from regulatory agencies. The environmental benefits of geothermal power like low carbon footprint, minimal discharge of Green House Gases, and energy conservation, may have induced investors and government officials, who masterminded the growth in the power sector of the region to remain. Having seen the socio-economic and physical elements linked with geothermal surge in the western region, the study ushered in a pathway for tracing these factors and understanding their significance in the face of rising prospects in the development of new projects and deficits in some variables. Planners in that way, are offered greater probabilities to assess the behaviour of these elements by evaluating their implications in the overall energy security in the years ahead. Seeing the growing energy requirements of the US Western region and the potentials of geothermal power and in building from the findings of this research. Planners in the region will be expected in the years ahead to seek quick responses to many vital questions essential to geothermal power management in the long term. The queries consist of what patterns will the geographic dispersion of geothermal energy indicators assume in the US Western region? Which emerging factors can influence the surge in the geothermal sector? What levels will geothermal power production in the western region be at over time? Will geothermal power expand into operational terrains reserved for conventional sources of energy in electricity generation? In posing these queries, endless openings exist in them for those scholars and policy makers entrusted with the duty of project developments, identification of potential sites and facilities and distribution networks to reorganize the plans on geothermal power production with guidelines highlighting wise use, continual production and meagre carbon foot print in the policy domain. This will ensure that the industry remains on a sustainable renewable path and best management practices anchored in outcomes built on environmental protection and energy security in the years ahead.
Appendix
4.1. Recommendations 4.1.1. Undertake Regular Ecological Monitoring of Geothermal Power Activities Over the years, the benefits of geothermal production in the US Western Region has largely been touted as a huge success considering the unprecedented applications from energy facilities designed to supply the daily electricity power needs in a handful of sectors such as agriculture, households, industries, heating and snow melting operations. However, there exists huge concerns about the likely risks from minute volumes of sulfur compounds and CO2 emissions and the reported impacts in areas like Hawaii and others. To that effect, environment and energy interface monitoring pertaining to the sensitivity and compatibility of a set of indicators germane to the operations and location of geothermal productions in the western geologic provinces should be carried out periodically in order to ensure the safety of the communities and the adjoining ecosystems. These kinds of assessments are so indispensable that they would go a long way in not only averting any unwarranted risk exposures in the natural and built up environments. But they can calm the minds of skeptics who often question the viability of geothermal power amidst the dominance of conventional of energy sources and common familiarity with them in the larger economy.4.1.2. Design a Regional Geothermal Energy Information System Throughout the onset of this enquiry, efforts to garner access to geothermal related information over different years and scales proved unnecessarily cumbersome. This occurred due to the absence of comprehensive energy data clearing house with updated information on the both temporal and spatial parameters highlighting the trends in an interactive and consistent format for the researcher to discern essential patterns in a timely manner. Even when they existed in a few states, they appeared under different formats and units and geographic scales disjointed in a pool of inconsistency which hinder quicker data gathering and assessment. In other words, while the time series differed at the state levels, very little existed at the county levels given the recurrent voids in essential data critical in the execution of the research and the strengthening of decision support potentials needed in the geothermal power sector, amidst the rising prices in energy markets in the region. For that, the paper recommends the need for the design of an interactive regional geothermal energy information systems with data on multisectoral parameters consistent over time and space with the capability to pinpoint precisely the evolution of production, reserves, opening and closing accounts, use patterns and capacity and geographic locations in a manner to guide managers, users, policy makers and commodity traders interested in information access to make better decisions in their daily activities. 4.1.3. Mount a Vibrant Public Enlightenment Campaign The year to year growth in geothermal power production and activities among the group of states in the US western region has over time raised the profile of the zone as the final frontier of thermal energy throughout the entire United states. Being the undisputable hub for geothermal power crucial in the periodic distribution and trade in the country, confers some legitimacy to the zone as an essential component and center piece of US thermal power scheme, indispensable in local and interstate supply of electricity to destinations in communities across the region. However, going by the way geothermal power activities and production levels and the sector are presented in both official policy and public circles. The coverage for geothermal power remains meagre compared to those directed at the conventional sources of renewable and non-renewable energy in terms of general acceptance and awareness regarding viability, potentials and essence to society. The fact that very little is known about geothermal power in ordinary energy lexicon among the general public demands the need for rigorous educational initiatives targeting a much broader audience across different demographics and school levels. This will afford society and investors and public officials and future consumers a better grasp of the sector likely to deepen appreciation for its contribution to the country’s renewable energy discourse. This will also help popularize the sector and improve the continual inroads of geothermal operations and traders into conventional energy markets. 4.1.4. Bolster the Development of More Geothermal Power Infrastructure In the current era known for recurrent volatility in the energy markets due to fluctuating prices and production levels precipitated by the activities of major cartels controlling access to conventional sources in the global marketplace. Limited access and supply to needy places and consumers among economically challenged communities struggling to afford higher tariffs for regular electricity power supply often breed energy insecurity likely to impede sustained capacity essential in operational effectiveness of businesses and households. Just looking at the distribution of geothermal energy facilities in the face of production and capacity changes among the entire states in the study area of US Western region. The obvious dominance of a trio of states like California, Nevada and Utah seems to mask the visible voids in critical power infrastructure in the other states considering the consistent patterns of emerging deficits highlighting the disparities among the group of states in the zone. Bridging these gaps in production requires the aggressive development of additional facilities that would boost future capacity in geothermal operations and supply to households, industries and agriculture and consumers in various states.
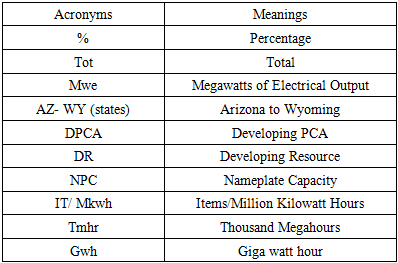
Acronym
References
| [1] | Glitnir Geothermal Research. (2007). United States Geothermal Energy Market Report. Glitnir Geothermal Research. |
| [2] | Sifford, Alex. (2000). Geothermal Electric Power Production In The United States: A Survey and Update For 1995-1999. Proceedings World Geothermal Congress 2000 Kyushu - Tohoku, Japan, May 28 - June 10, 2000. |
| [3] | Union of Concerned Scientists 2018. How Geothermal Energy Works. Retrieved From https://www.ucsusa.org/resources/how-geothermal-energy-works. |
| [4] | Rotheborg, Daniel. (2017 Sept). The Indy Explains Geothermal Energy In Nevada. Nevada Independent. |
| [5] | Institute For Energy Research (IER). (2018). Encyclopedia Geothermal. DC. Washington. Institute For Energy Research. |
| [6] | Renewable Energy World Editors. (2017 December). New Geothermal Plant in Nevada Will Help Power Los Angeles. Renewable Energy World. |
| [7] | Environment America (2019). Geothermal Energy. Moving Toward 100% Clean Renewable Energy On Campus. Environment America Research and Policy Center. |
| [8] | Marshall, Jonathan. (2014 March). Geothermal part 1: Time to Tap California's Potential?. San Francisco, CA. Pacific Gas and Electric. |
| [9] | Guess, Megan. (2014 August). Geothermal Energy Has Success In Nevada, Wants To Spread To the Rest of the West. Ars Technica. |
| [10] | Valley, Jackie. (2015 March). Nevada A hotbed For Geothermal Activity. 5-miniute Expert. Las Vegas Sun. |
| [11] | Oregon Department of Energy. (2018 June.) Geothermal energy. Salem, Oregon. Government of Oregon. |
| [12] | Geothermal Energy Association (GEA). (2016). Annual U.S. and Global Geothermal Power Production Report. DC. Washington. GEA. 1-36. |
| [13] | Merem, E. C. (2019, March). Assessing Geothermal Energy Potentials in The Western Region of the US With GIS. 27th Annual AEHS Conference. San Diego, CA. |
| [14] | Boyd, T. (2015 April). The USA Country Update 2015. Proceedings World Geothermal Congress. Melbourne, Australia. |
| [15] | O’Halloran, Parker. (2016). The U.S. Energy Information Administration (EIA) has released their data About geothermal electricity generation for 2016. DC. Washington. EIA. |
| [16] | Environmental and Energy Study Institute (EESI) (2016 March).Geothermal Energy: Heating Up. DC. Washington. Environmental and Energy Study Institute. |
| [17] | Thermal Zones. (2020). Geothermal Energy Zone Owners In California. Bureau of Land Management Chattanooga TN. |
| [18] | US Department of Energy (DOE). (2018 January). 2017 Annual Report. DC. Washington. Geothermal Technologies Office pp 1-18. |
| [19] | Richter. Alexander. (2017 Nov). CEO of NV Energy Highlights Great role of Geothermal for State of Nevada Think Geoenergy. pp 1-2. |
| [20] | Fleischmann, Daniel. (2007). An Assessment of Geothermal Resource Development Needs in the Western United States. Geothermal Energy Association. Washington, D.C. |
| [21] | Geothermal Energy Association (GEA). (2014). Annual U.S. and Global Geothermal Power Production Report. DC. Washington. GEA. |
| [22] | Geothermal Energy Association (GEA). (2015). Annual U.S. and Global Geothermal Power Production Report. DC. Washington. GEA. |
| [23] | International Energy Agency (IEA) (2010). Renewable Energy Essentials: Geothermal. Paris. IEA. |
| [24] | Bromley, C.J. (2010). Contribution of Geothermal Energy to Climate Change Mitigation: Proceedings of the World Geothermal Congress 2010, Bali, Indonesia, 25-30 April. 1-5. |
| [25] | Rybach, Ladislaus. (2010). Proceedings of the World Geothermal Congress 2010 Bali, Indonesia, 25-30 April. |
| [26] | Merem, E. C. (2019). Assessing Water Resource Issues in the US Pacific North West Region. International Journal of Mining Engineering and Mineral Processing, 8(1): 1-19. |
| [27] | Merem, E. C. (2019). Analyzing Geothermal Energy Use in the East African Region: The Case of Kenya. Energy and Power, 9(1): 12-26. |
| [28] | Merem, E. C. (2019). Regional Assessment of Climate Change Hazards in Southern Nigeria with GIS. Journal of Safety Engineering, 8(1): 9-27. |
| [29] | Merem, E. C. (2018). Assessing The Effects of Fuel Based lighting: The Case of Kerosene Use and Disasters In Nigeria. Public Health Research, 8(1), 1-17. |
| [30] | Merem, E. C. (2018). Assessing Renewable Energy Use In Ghana: The Case of the Electricity Sector. Energy and Power, 8(1), 1-17. |
| [31] | Merem, E. C. (2016). The geography of wind energy use in the mid-west region of the U. S. Journal of Energy and Power, 6(1), 1-15. |
| [32] | Merem, E. C. (2017). Regional assessment of energy trends in West Africa using GIS. International Journal of Energy Engineering, 7(1), 1-27. |
| [33] | US Census Bureau. (2017). Census Quick Facts United States. DC. Washington. US Department of Commerce. |
| [34] | Wikipedia (2019). Geothermal Energy In The United States. |
| [35] | American Geosciences Institute. (2018). Geothermal Energy Basics. Alexandria, VA: American Geoscience Institute. |
| [36] | Martin, Shelley. (2017 September). Subsurface Modelling Explores New Geothermal Hot Spots For Renewable Energy. Pittsburgh, PA. DOE National Energy Technology Laboratory. |
| [37] | Nyberg, Michael. (2018). Geothermal Energy Statistics and Data. Sacramento, State of California: California Energy Commission. 1-4. |
| [38] | Government of Utah. (2018). Resource Profile: Geothermal Energy In Utah. Salt Lake City, Government of Utah. |
| [39] | The Montana Department of Environmental Quality (2018). Geothermal Resources: Geothermal Energy Sites. Bozeman. MT: Government of Montana. |
| [40] | Hawaii Business Magazine. (November 2013). Sustainability. Geothermal is a Red-Hot Topic. |
| [41] | US Energy Information Administration (EIA) (2017). Geothermal Explained: Geothermal Energy and the Environment. Retried On September 2019 From https://www.eia.gov/energyexplained/geothermal/geothermal-energy-and-the-environment.php. |
| [42] | Geothermal Energy Association (GEA). (2013). Annual U.S. and Global Geothermal Power Production Report. DC. Washington. GEA. |
| [43] | Morgan, Lee. (2018). Underground Energy Debate Powering Up. San Diego Union Tribune. |

 Abstract
 Reference
 Full-Text PDF
 Full-text HTML