-
Paper Information
- Previous Paper
- Paper Submission
-
Journal Information
- About This Journal
- Editorial Board
- Current Issue
- Archive
- Author Guidelines
- Contact Us
International Journal of Energy Engineering
p-ISSN: 2163-1891 e-ISSN: 2163-1905
2020; 10(1): 16-21
doi:10.5923/j.ijee.20201001.03

Measurement of Thermal Stability of Polymeric Cable Wires Using Thermogravimetric Analytical Technique
 Abstract
 Reference
 Full-Text PDF
 Full-text HTML
Usman Armaya’u, Zakariyya Uba Zango, Ziya’ulhaq Umar Masanawa, Suleiman Gani Musa
Department of Chemistry, College of Natural and Applied Sciences, Al-Qalam University Katsina, Nigeria
Correspondence to: Zakariyya Uba Zango, Department of Chemistry, College of Natural and Applied Sciences, Al-Qalam University Katsina, Nigeria.
| Email: |  |
Copyright © 2020 The Author(s). Published by Scientific & Academic Publishing.
This work is licensed under the Creative Commons Attribution International License (CC BY).
http://creativecommons.org/licenses/by/4.0/

TGA measurements have been known to provide valuable information that can be used to select materials for certain applications and to predict product performance giving way for possible improvement. Polymeric cable wires were exposed to TGA analysis (after subjecting them different preheating treatments) which leads to determining their thermal stability through comparative analysis between the fingerprints of the preheated and the non-preheated samples obtained. Very reliable and valuable information was obtained which would help in predicting the product performance giving way for possible improvement of the materials.
Keywords: Analysis, Cable wire, Measurement, Polymer, Stability, Thermogravimetry
Cite this paper: Usman Armaya’u, Zakariyya Uba Zango, Ziya’ulhaq Umar Masanawa, Suleiman Gani Musa, Measurement of Thermal Stability of Polymeric Cable Wires Using Thermogravimetric Analytical Technique, International Journal of Energy Engineering, Vol. 10 No. 1, 2020, pp. 16-21. doi: 10.5923/j.ijee.20201001.03.
Article Outline
1. Introduction
- TGA measurements have been known to provide valuable information that can be used to select materials for certain applications and to ascertain the product performance of materials and predict how it can be improved towards a certain applications. TGA measures the weight changes in a material as a function of temperature or time in a controlled atmosphere. In TGA technique, the mass of a substance is monitored as the temperature changes under a controlled atmosphere [1] [2] [3].A polymer is a macro molecules obtained by building up of numerous smaller molecules called monomers, these smaller units are joined relatedly in order to form the desired polymer molecule. These large molecules may be simple linear, can still be slightly branched depending on the method of polymerization or even highly interconnected, while the smaller molecules used as the basic building blocks for these molecules are called monomers [4]. Plastic products such as thermosets and thermoplastics possessed outstanding features as light-weight, durability and versatility, and the cost of production is low [5] [6]. Cable insulation wire is a form of thermoplastic polymer that is used to protect the electric wire from direct exposure to the environment. During the course; variety of additives are incorporated into the plastics to improve physical properties, such as colour hardness and resistance to flame. These additives could be polymeric, inorganic or organic substances with different molecular weight. Among the most common additive are plasticizers that improve the plasticity and viscosity of the plastics. For example, polyvinyl chloride (PVC) polymer must contained plasticizers such as phthalates and bisphenol to minimize the effects of thermal and photo-degradation [7]. At a more fundamental level, thermogravimetric analysis (TGA) and pyrolysis techniques have been used to evaluate basic characteristics of thermal degradation on the chemical kinetics of reactions at elevated temperatures. These techniques have been applied to many polymer materials in general for the electronics, corrosion and environmental monitoring applications [8] [9]. Thermogravimetric analysis (TGA) provides an effective alternative to chemical analysis for the characterization and analysis of materials [10] [11]. It measures the mass loss of a sample subjected to a heating program under specific conditions in an inert (pyrolysis) or oxidative (combustion) atmosphere [12]. This technique has been extensively used to study and examine polymeric materials such as thermoplastics [13], thermosets, plastic films and elastomers. It has also been employed in the study of composite materials such as glass epoxy and in the thermal analysis of fibres, epoxy thermosets, coatings and paints [14] [15]. Thus, TGA has been used to examine and assess oxidative stabilities for a number of materials in a desired temperature range and determine a correlation between the thermal stability and lifetime in the field [16] [17].Broken wire damages has been a major challenge in cable wire related engineering practices. Cables wires are widely used in engineering applications particularly to make structures such as cable bridges suspension bridges and electrical conducting cable wires [18] [19]. However corrosion as a spontaneous environmental chemical process usually takes place on such materials mostly under intense harsh environmental conditions [20] [21]. These processes therefore reduce the mechanical stabilities of the materials, as such, causing damage of or reduce their life span to a shorter time. Thermogravimetric analysis (TGA) and pyrolysis techniques has been largely used to characterize the thermal history, stability and decomposition of polymeric and composites material [22] [23]. Also some researchers have employed the technique to biological and inorganic materials. The advantage of this kind of analysis is that they give a rapid assessment of the value, the temperatures and time at which these materials degraded or decomposed and where the combustion starts and ends and other characteristics such as thermal history, reactivity temperature or total combustion time of the materials [24] [25] [26]. Thus, researchers from various fields employed the use of this technique to identify the damage through monitoring changes of mechanical strength undergone by the materials. First, accurate and effective quantitative analysis of the effect of the broken wire damage on the mechanical properties of cables is vital. However, due to the broken wire damage, the existing analytical method for mechanical characteristics of intact cables is inapplicable to damaged multi-wire cables. Therefore, developing a theoretical me. The purpose of this current work is to examine the thermal stability of polymeric cable wires by performing a thermogravimetric analysis on pre-heated and non-preheated cable polymers samples.
2. Experimental
2.1. Materials
2.1.1. Polymers
- Insulation cables were collected from the school departmental store and used as samples, while different plastic materials were randomly collected around University Huddersfield UK.
2.2. Methods
- In the course of the experiment, insulation cables were collected from the school departmental store and used as samples. While other different plastic polymer materials were randomly collected around University Huddersfield UK. The polymer samples were then categorised into three classes namely the pre-heated samples (these are samples that were pre-heated under different oven temperatures of 50°C, 100°C, 150°C, 200°C and 250°C, to enable the determination of the thermal history of polymers used as electrical insulation), the non-pre-heated samples (these are the pure and/or original non treated samples directly obtained and used from the store. They are the normal cable insulation wires for electric wiring purposes), and the other polymers (they includes a plastic bottle cover, takeaway food containers, water pipes, toothbrush plastic cover and they were not pre-treated).
2.2.1. TG Experiment
- Thermogravimetric (TG) analysis data were obtained using a Shimadzu TGA – 50. All measurements were conducted at ambient pressure (760.00 mmHg) using a 50 ml/min Nitrogen purge flow and 10°C/min as heating rate. This heating rate value enables to detect whether some irregular situations arise in the experiment.
2.2.2. Different Heating Rates
- (1) Programmed from 25°C (room temperature) to 500°C (hold to the end of analysis) at 25.00 K/min under nitrogen at 50 ml/min flow rate.(2) Programmed from 25°C (room temperature) to 500°C (hold to the end of analysis) at 50 K/min under nitrogen at 200 ml/min flow rate.
3. Results and Discussion
3.1. Thermogravimetric Analysis (TG)
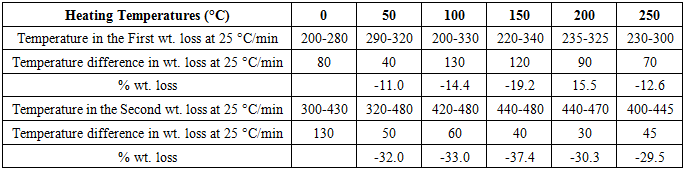
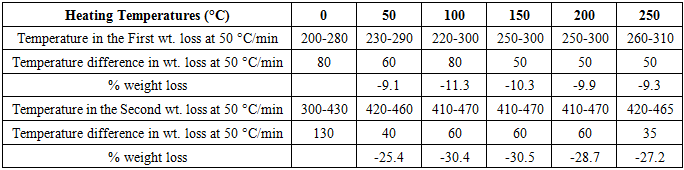
- The TG thermograms of all the polymer samples were recorded under dynamic conditions from room temperature 25°C - 500°C at a different heating rate of 25 K/min, and 50 K/min under nitrogen atmosphere. The representations of thermometric data are presented in tables 1 and 2, while figures 1(a-b) shows a curve representation of non-pre-heated samples of insulation wire at the two different heating rates of 25 K/min and 50 K/min run constantly to the end of the experiment. The thermograms of the treated samples (pre-heated insulation wire) at 50 K/min were presented in figures 3(a-e) that show the thermograms characteristics at different degree of pre-heating temperature rates of 50°C, 100°C, 150°C, 200°C and 250°C respectively. While figures 2(a-e) thermograms of the treated samples (pre-heated insulation wire) at 25 K/min at different degree of pre-heating temperature rates. The thermograms clearly displayed the thermal degradation of the different pre-heated samples showing practically an identical behaviour which indicates a high degree of characteristic similarities between them, even though they were pre-heated under different temperatures and under different reaction times. The thermogravimetric curves obtained provides clear characteristic decomposition profiles of each pre-heated sample, when compared with the non-pre-heated sample, the difference starts from the onset of the weight loss which often defines the upper limit the polymer sample can attain in term of thermal stability.The TG data obtained for non-pre-heated samples clearly shows a major one-stage weight loss in all the two different heating rates of 25°C/min and 50°C/min with a mass loss of 42.66% and 36.53% both of which falls in temperature around 200-290°C respectively and a second stage (minor) shorter stage weight loss of 4.42%, and 4.35% both within a temperature range of 300-300°C respectively. The thermograms of all the two different heating rates indicates a good similarities between the samples which proves that the samples are from the same macro molecules, with all the two (non-pre-heated) samples having two weight loss steps; the first weight loss step is caused by the separation of moisture and the second weight loss step is the pyrolysis step where the weight loss starts. Tables 1 and 2 showed a basically identical behaviour in all the five pre-heated samples, even though treated under different heating temperatures, there is no observed difference in the thermograms.
|
|
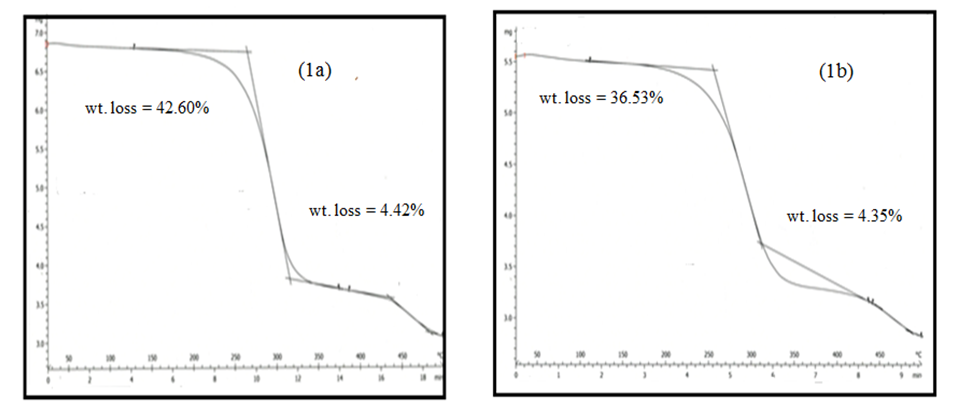 | Figure 1(a-b). TG curves of non-pre-heated samples at 25 K/min and 50 K/min |
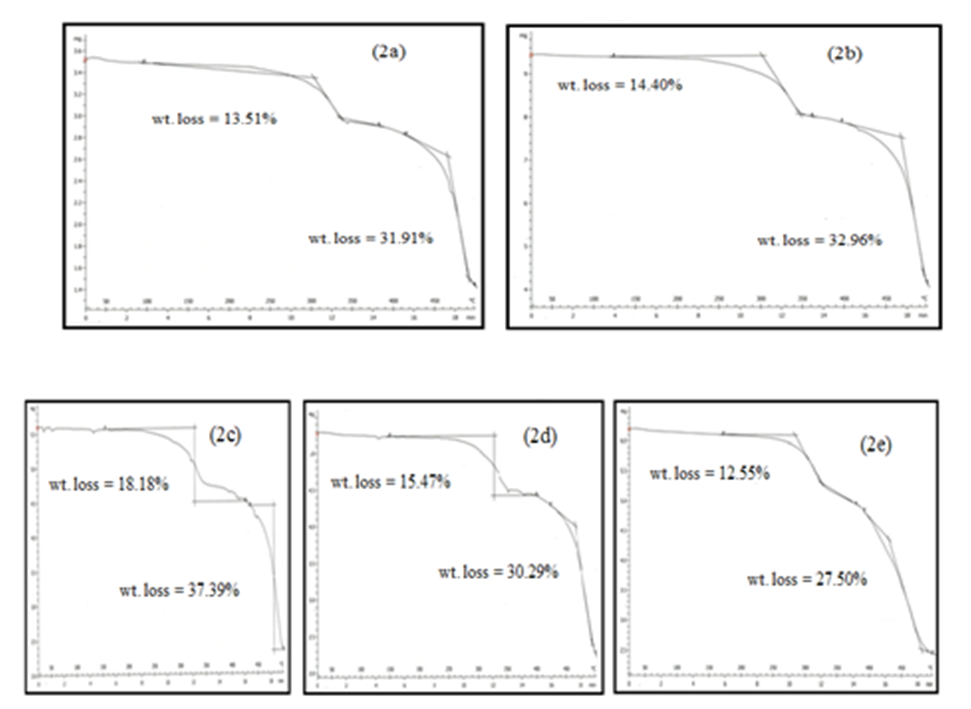 | Figure 2(a-e). TG curves of pre-heated 50°C, 100°C, 150°C, 200°C and 250°C at 25°C/min |
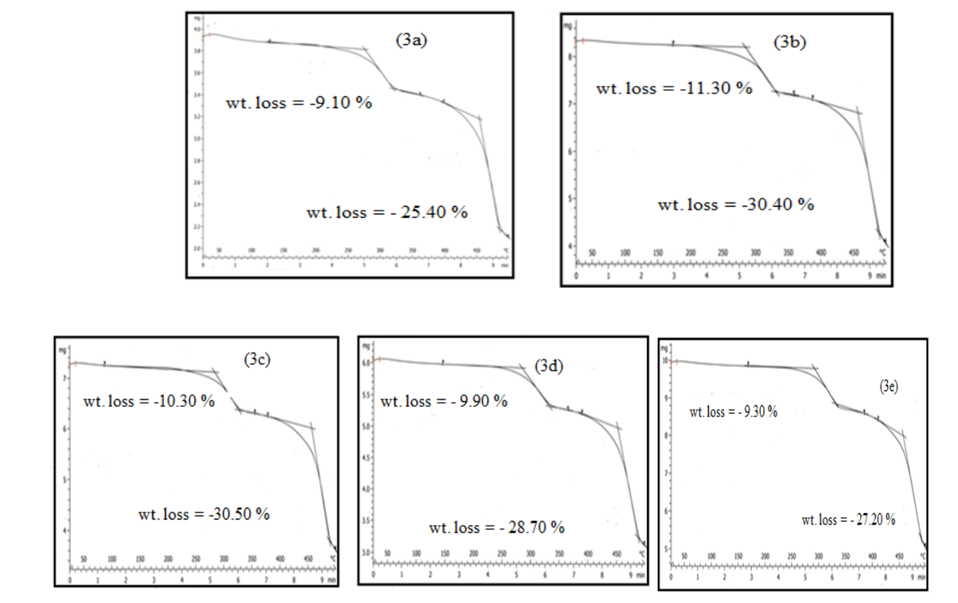 | Figure 3(a-e). TG curves of pre-heated treated samples of 50°C, 100°C, 150°C, 200°C and 250°C at 50°C/min |
4. Conclusions
- From the results of the experimental analysis, it is apparently clear that thermogravimetric (TG) analysis can be used to obtain precise information on the thermal history of polymeric cable insulation wire. From the results on experimental analysis the TG thermograms have a two steps weight loss, with an average major weight loss between the temperatures of 200°C to 280°C on the non-pre-heated sample at both the two runs of 25°C/min and 50°C/min runs. On the pre-heated sample, the major weight loss was observed between 260°C to 480°C at 50°C/min, while the major weight loss at 25 K/min was observed between 230°C to 300°C. The second weight loss at 50 K/min was observed between 410°C to 470°C and second weight loss at 25°C/min was observed between 320°C to 480°C. The overall results of both the 25°C/min and 50°C/min were presented in tables 1 and 2. The results obtained from the thermograms (as shown in tables 1 and 2) point out the difference between the thermally treated samples and non-treated samples. The thermogravimetric curves obtained provides clear characteristic decomposition profiles of each pre-heated sample, when compared with the non-pre-heated sample, the difference starts from the onset of the weight loss which often defines the upper limit the polymer sample can attain in term of thermal stability. Thus, thermogravimetric analysis can be employed to best identify the thermal stability of cable insulation wires used for electrical purposes. This information obtained would help to predict the product performance of the polymer materials and thereby leading to possible improvement of the materials.
ACKNOWLEDGEMENTS
- The authors wish to send profound gratitude to Dr. Gareth Parkes Post-graduate course Leader in the Department of Chemical and Biological Sciences, Universityof Huddersfield, United Kingdom and Al-Qalam University Katsina, Nigeria.