International Journal of Energy Engineering

p-ISSN: 2163-1891    e-ISSN: 2163-1905

2019;  9(2): 36-44

doi:10.5923/j.ijee.20190902.02


Household Energy Utilization and Changing Behaviours: Evidence from Western Kenya

Stephen Kimutai1, 2, Ambrose Kiprop1, 3, Denyse Snelder4

1Department of Mechanical & Production Engineering, Moi University, Kenya

2Department of Chemistry, Moi University, Kenya

3Africa Center of Excellence in Phytochemicals, Textile and Renewable Energy, Moi University, Kenya

4Vrije Universiteit Amsterdam, Centre for International Cooperation (CIS-VU)

Correspondence to: Stephen Kimutai, Department of Mechanical & Production Engineering, Moi University, Kenya.

Email:

Copyright © 2019 The Author(s). Published by Scientific & Academic Publishing.

This work is licensed under the Creative Commons Attribution International License (CC BY).
http://creativecommons.org/licenses/by/4.0/

Abstract

The impact of rising household energy demands on the development of various regions in Kenya is not clearly understood due to lack of energy consumption behavior data among rural and urban households. The purpose of the study was to investigate households’ energy consumption behavior and examine factors that influence this behavior among households in rural and peri-urban areas in Western Kenya. Stratified random sampling technique was used to select a sample of 560 households in the counties of Bungoma and Uasin Gishu. Results showed that rural households are dependent largely on kerosene and electricity for lighting purposes and majorly firewood for cooking, while electricity and charcoal form a major source of energy for lighting and cooking in peri-urban households respectively. Also, a small fraction of households uses solar panels as their source of energy for lighting among other uses. Further, results shows that household energy utilization is characterized by multiple fuels use, conforming to energy stacking theory rather than energy ladder hypothesis. Generalized linear model (GLM) results on household energy utilization supported the energy ladder model which showed income level as the most influencing factor. Renewable energy use for cooking showed a reduction of firewood and charcoal as household energy sources. The research findings offer insights to enhance household energy policy making in Kenya and countries alike.

Keywords: Household energy, Convectional fuels, Energy staking, Energy ladder, Renewable energy, Bungoma, Uasin Gishu, Kenya

Cite this paper: Stephen Kimutai, Ambrose Kiprop, Denyse Snelder, Household Energy Utilization and Changing Behaviours: Evidence from Western Kenya, International Journal of Energy Engineering, Vol. 9 No. 2, 2019, pp. 36-44. doi: 10.5923/j.ijee.20190902.02.

1. Introduction

Africa will experience the fastest growth in population world-wide with a projected rise of 2.2% per year on average, its population will increase from 1.2 billion in 2016 to 2.0 billion in 2040 [1]. The economy of Africa has grown as well, at an average rate of 5% between 2000 and 2014, [2]. Growth at such scale will have major implications for energy consumption [3] and likely outpace the rate of electrification across different parts of the continent. The predictions are that, by 2030, around 600 million people in sub-Saharan Africa will still remain without access to electricity and continue to depend on conventional energy from biomass (e.g., wood, straw and manure), coal, or kerosene for cooking [4].
Continued dependence on conventional energy sources will have a serious impact on human health from indoor air pollution [5, 6, and 7]. It will likewise affect the environment by forest degradation and enhanced carbon emissions in the atmosphere resulting from wood-fuel consumption [8]. Moreover deforestation associated with timber cutting, agriculture and other forms of resource exploitation reduces the availability of biomass-based energy sources [9], forcing people to increase their efforts in securing wood fuel and travel longer distance between home and fuel source [10], limiting their fuel consumption (e.g., lower frequency or intensity of fuel use); or, also in view of the reduction of adverse health effects, diversify their fuel use and look out for renewable and cleaner alternatives e.g., from wind, solar [11].
The transitions in energy source utilization reflect a change in households’ energy consumption behavior (ECB) with the mode and direction of change depending on multiple factors, aside from scarcer biomass resources. These include factors, such as, household income or socio-economic status [12]; household composition and size; gender; cultural preference [13]; education; rural or urban residence; fuel use purpose; monetary or technological investment; reliability of fuel supply; fluctuations of energy prices; [8,14- 22].
The academic literature on household energy transition reveals energy ladder and energy stacking hypothesis, however, contrasting views on how households move towards the use of other fuels as income rises [22]; is not clearly understood. One school of thought supports the energy ladder concept, i.e., discontinuation of the use of conventional fuels and adoption of cleaner and modern fuels such as electricity and gas; [23]. The other school adheres to the energy stacking concept of simultaneous use of various types of fuels, i.e., continued use (temporarily) of conventional fuels and gradual adoption of cleaner and modern ones; [24,25]. However, the process of fuel stacking has not been carefully examined, especially in Africa [25,26].
An increasing share of Africa’s population is expected to live in cities and towns. Whereas urban areas comprise 472 million people at present, it is expected that this number will double over the next 25 years as more people will be pushed out of rural areas [27]. The rate of urbanization is projected to increase from 41% in 2016 to 51% in 2040 [27, 28, and 29]. It is likely to be accompanied by a rise in appliance and vehicle use and increased demand for construction materials, including energy-intensive products such as steel and cement [30]. However, lack of access to electricity may form a major barrier to urban development, and Africa’s economic development in general. Electricity access is the lowest in Sub-Saharan Africa, both in urban and rural areas, with rates at 58% and 12% respectively [10,30].
Households in cities and surrounding rural areas differ in energy use and supply needs. Whereas urban dwellers use relatively less firewood compared to their rural neighbors, they typically employ more charcoal which is usually cheap and readily available. Various energy studies on sub-Saharan Africa confirm an increase in charcoal consumption with rising urbanization levels [12,32]. Furthermore, grid electricity is usually available in cities, yet, it is not accessible to all particularly the urban poor who mostly live at neglected localities deprived of basic infrastructure (i.e., slums). In rural areas, homesteads are often dispersed and, consequently, not connected to grid electricity because of high transmission and distribution costs associated with grid extension. The latter is particularly evident in Eastern and Southern Africa where the majority of the rural population resides in dispersed homesteads [33]. As a consequence, rural households resort to conventional energy sources, yet at the same time, rural areas are perceived as the ideal place for deployment of new and innovative electrification technologies such as those based on solar energy [33].
Like elsewhere on the African continent, the energy demand in Kenya is expected to rise at a fast pace in the coming decade. The country is currently characterized by a population growth of 2.6% [34] and an economic growth of 6% [35]. While its current urbanization rate of 26.7% is well below those reported for SSA and Africa (37% and 40%; [27], it is estimated that nearly half (44%) of the entire population of Kenya will be urban by the year 2050 [36]. However, most parts of the country still rely on conventional sources of energy, with firewood being the first-choice cooking fuel for the majority of households as shown by various studies ([37], [38] and [17].
The impact of rising energy demands on the development of the various regions and the standard of living of people is not clearly understood [39]. The projected trend in urbanization may increase pressure on available energy resources to such an extent that acute shortages may develop at a temporary basis leading to price fluctuations, as happened in the past [3]. Government efforts are therefore directed at accelerating the transition towards innovative energy technologies based on more sustainable and cleaner fuels. However, in most counties, the data on energy consumption behavior among rural and urban households are incomplete or even lacking [17,37,40].
The demographic trends in Kenya, like in most African countries, underline the challenge faced by government institutions in meeting the increasing energy demands, providing access to renewable and cleaner energy sources and stimulating efficient and conservative energy use in order to control GHG emissions. There is a need to identify transition pathways that will facilitate a shift from conventional fuels such as firewood towards more modern fuels, such as, biogas or electricity from wind or solar energy sources. In order to do so, a better understanding is required of the energy consumption behavior - and factors that may influence this behavior - among households in areas subject to different urbanization rates and access to conventional firewood sources.
Therefore, the aim of this research was to contribute to a better understanding of energy consumption behavior among rural and peri-urban households for the design of evidence-based policies on energy conservation.

2. Empirical Studies on Modelling

The factors that dominate the change in household energy usage reportedly vary by country, between urban and rural regions and between high- and low-income groups such as in Ethiopia, Nigeria [41], Cameroon [42], China [43,44], India [44] and Mexico [45], thus implying that each country needs a country-specific designing policy [41,46].
Mbaka [47] studied households’ energy preference and consumption intensity in Kenya. The study utilized a nationally representative cross-sectional household dataset (3663 households) across Kenya. Cragg’s double-hurdle model was chosen on the fact that the model postulates that households must pass two separate hurdles before a positive level of consumption is observed. Results found that households’ energy preference and consumption intensity are mainly affected by location (rural or urban), household’s decision maker on energy use, education level, age of the household head, and the average monthly income.
Mutua & Kimuyu [48] investigated the main determinants of household energy conservation and savings using discrete choice and Tobit models from National Energy Survey Data for Kenya 2009. They found that demographic variables, such as the household head’s gender and occupational and educational attainment, as well as household location and size, are key determinants of not only the propensity to conserve energy but also levels of actual energy savings.
Relations between variables affecting household energy use and sources are often more complex than simple bivariate relations between a predictor and a criterion as used by many researchers. Correlation analysis and regression modeling are the most familiar methodologies for analyzing the relationship between household energy and factors influencing its use. However, there are concerns regarding the estimation of these factors based on regression modeling [49].
Analyzing household energy utilization using generalized linear models with the help of SPSS may be useful, as it describes simultaneous examination of the effects which are relevant and allows for the investigation of more complex research relationships. Generalized linear models have a common algorithm for the estimation of parameters by maximum likelihood; this uses weighted least squares with an adjusted dependent variant, and does not require preliminary guesses to be made of the parameter values. Generalized linear models accommodate unequal variances through the introduction of variance functions that may depend on the mean value through a known function of the mean [50].

3. Research Area and Methods

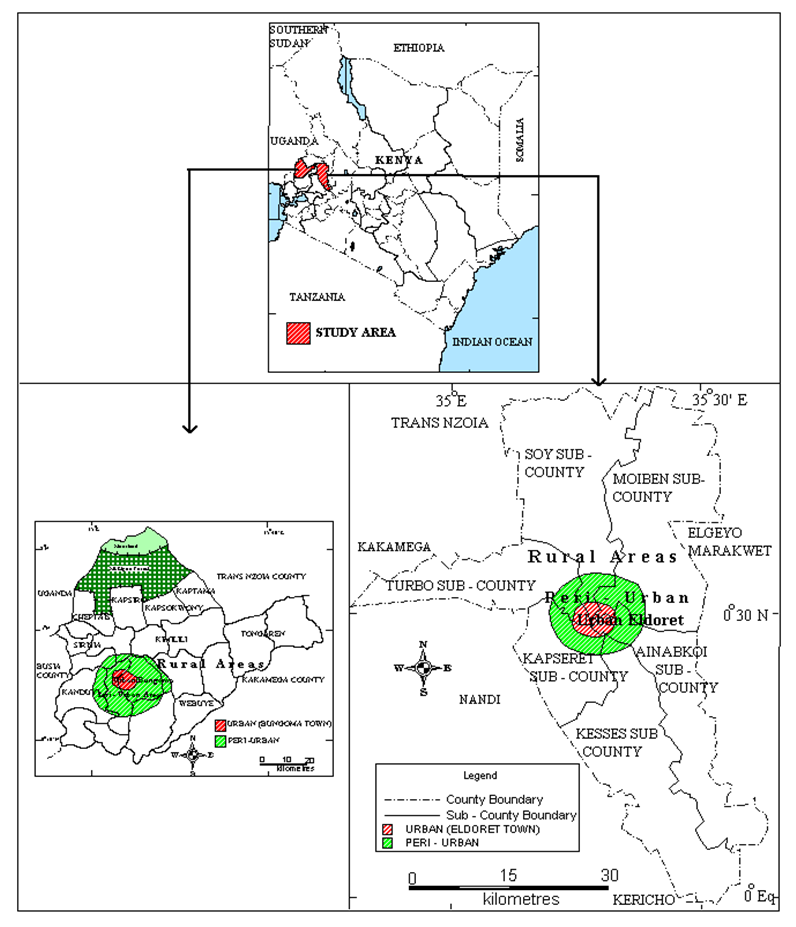
The study was conducted among rural and peri-urban households in two counties with different levels of peri urbanization, urbanization and forest coverage, i.e., Bungoma (percent urban population: 22%; forest cover as percent cover of total county area: 21%;) and Uasin Gishu (39%; 11%), in Western Kenya as shown in figure 1.
Figure 1. Map of two Counties Bungoma and Uasin Gishu showing the urban, peri – urban and rural areas. (Source: World Maps (2019))
Bungoma County is located in Western Kenya; its geographical coordinates are 0° 34' 0" North, 34° 34' 0" East. It covers an area of 3,593 km2 (see Table 1). According to the 2009 Kenya Population and Housing Census the population is 1,375,063 and has 270,824 households. The major economic activity is maize farming, making the county a vital component of the country’s bread basket.
Table 1. Forest coverage and population in the counties of Bungoma and Uasin Gishu, Western Kenya
Uasin Gishu County is situated in the former Rift Valley Province. It borders Nandi County to the South, Trans Nzoia County to the North, and Elgeyo Marakwet County to the East. It shares some rather short borders with Bungoma County to the West and Kericho County to its South Eastern strip. It occupies an area of 3,345 Km2 with a population of 894,179 people and 202,291 households (KNBS, 2015). The County’s headquarters is Eldoret town that boasts of population taking just over 32% of the county’s population.
The study targeted a total number of 202,291 and 270,824 households in Uasin Gishu and Bungoma counties respectively. The stratified random sampling technique was used to select a sample of 560 rural and peri-urban households in total. The selection of both counties as study area was guided by experts at the Kenya Forestry Research Institute who carried out a baseline survey to identify the regions within the country where critical ecosystem services for human well-being are stressed (‘Baseline Survey Report on Energy Sources in Mt. Elgon and Cherengany Ecosystems’, n.d.). Moreover, the level of urbanization and availability of forest resources, using forest area (i.e., area under different types of forest as shown in Table 1) as indicator, served as criteria for site selection level of urbanization and availability of forest.
Data on energy consumption behavior was collected by means of a household survey conducted in 2017 and 2018, using semi-structured questionnaires. Also, focus group discussions with local communities in both counties were conducted to provide additional information on household energy consumption. More specifically, the surveys included the collection of data on household sizes, type of energy sources used, gender of household head, average income, type of energy sources used, with energy sources, renewable energy use and accessibility (distance to nearest fuel collection point and number of energy sources supplying selling shops in the village).
A generalized linear model with the help of SPSS version 23 was used to assess the magnitude of the factors on the household energy sources changing behaviour. In GLM, households are assumed to be rational in making household energy-choice decisions on the type of household’s energy sources to be used for cooking. The assumption is that a household selects a certain type of household energy sources in such a way as to maximize its satisfaction [25] and enhance energy security. Where a household makes a choice j at a time, then Yij is the maximum utilized types of the fuel sources. The estimated GLM is as follows:
(1)
Where; P (Yi j) = the probability of choosing one of the type of household energy instead of the based category variable; i= the individual household; α = intercept, β = weights of the factor, GNDi= gender of the head of household i; AGEi= age of the head of household i; HHSi = size of the household i; INCi= Average income of the of household i; LOCi= home location of the household i; REDi = Residential status; ACCi= distance to the nearest energy source supplying shops; RENi= Renewable energy use; DISi = Distance of the household i to energy source; NOSi = Number of suppliers in the village i; LOSi = level of satisfaction; Xi = other factors; e = error term.
Generalized linear model equations was used to test weights of the factor (β ) of an outcome (type of fuel) with a predictor, to quantify the degree of association, or to estimate the mean value of the outcome for given values of the predictors.
Determination of Adequate Sample Size
According to Dillman (2011), the formula for determining a good representative sample size is as follows;
(1)
Where;
S = Minimum required sample size (= 384); N = the population size (= 693,800); P = the population proportion expected to answer in a particular way (the most conservative proportion is 0.50); B = the degree of accuracy expressed as a proportion (0.05); and C = the Z statistic value based on the confidence level (in this case, 1.96 is chosen for the 95 per cent confidence level [51].
Research hypothesis
The research question revolves around energy ladder and energy stacking hypothesis within the context of western Kenya. Secondly, I attempt determine the extent to which the household characteristics affect household energy changing behaviours. A third question centers on the difference in household fuel choice between rural and Peri urban.

4. Results and Discussions

4.1. Trends in Household Energy Utilization

Pattern of Energy Use for Cooking
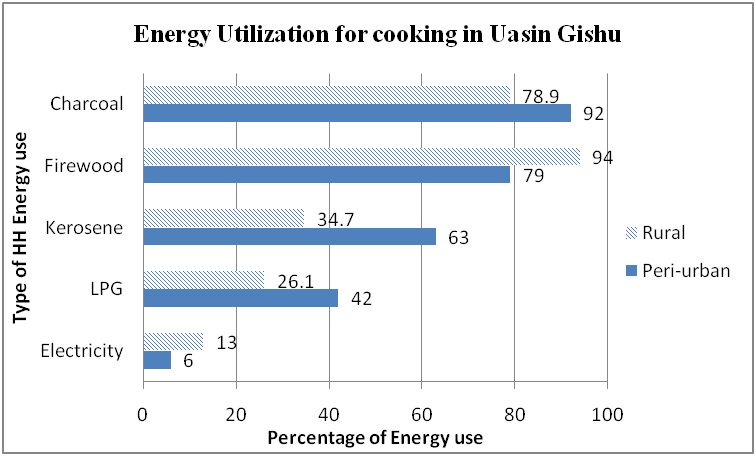
Figure 2 presents the percentage of households that use specific type of energy source for cooking in Uasin Gishu. The proportion of households that use fire wood declines from 94% to 79% as one move from rural to peri-urban, while the use of charcoal increases from 78.9% to 92% in the same case. On the other hand, the use of LPG and kerosene increases from 26.1% and 34.7% to 42% and 63% respectively.
Figure 2. Energy used for cooking by households in Uasin Gishu expressed as a percentage of total number of households
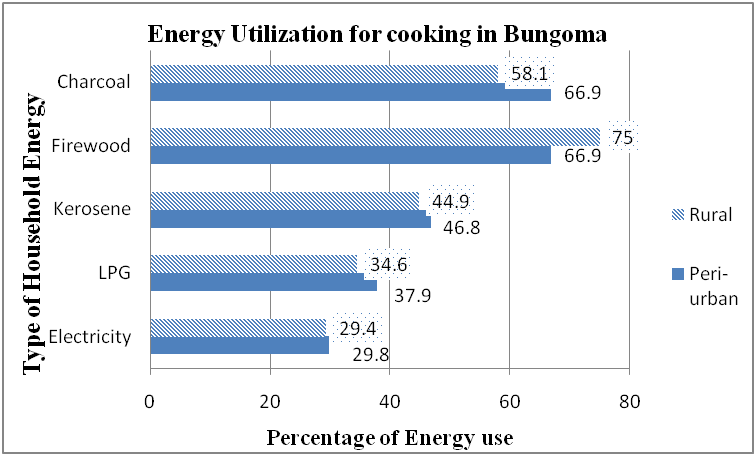
Figure 3 shows the percentage of households that use specific type of energy source for cooking in Bungoma. The proportion of households that use fire wood declines from 75% to 67% as one move from rural to peri-urban, while the use of charcoal increases from 58% to 67% in the same case. On the other hand, the use of LPG and kerosene increases from 44.9% and 34.6% to 46.8% and 37.9% respectively. Households in peri-urban have significantly higher fuel choices than households in the rural areas. Firewood and charcoal are the most common combination of multiple fuel use for both peri urban and rural households.
Figure 3. Sources of household energy for cooking in Bungoma (Source: Author’s (2019))
Among the rural households, firewood remains the main fuel source as majority households still depend on firewood for their cooking needs. Households using liquid fuels (LPG) and kerosene are mostly found in peri-urban areas. This shows that there is a shift towards charcoal, LPG and kerosene as one move from the rural to peri-urban areas which supports the research done by [17] and [28].
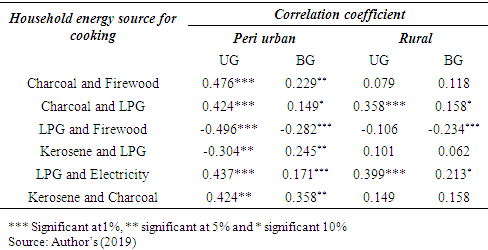
Table 2 show different energy sources combinations and they include; firewood, charcoal, kerosene, LPG and electricity. The results showed positive and significant association between the use of charcoal and firewood both for the peri - urban and rural households. There were positive associations between LPG and electricity and between kerosene and charcoal for both peri – urban and rural households. Also, negative and significant association between LPG and firewood both for the peri - urban and rural households was noted.
Table 2. Pairwise correlation coefficients of the household energy sources for cooking
     
The revelation on positive and negative correlation between the numbers of energy sources used by households concurs with [52]. The use of charcoal and firewood is negative associated with the diversification in peri urban while its use in rural is positive significant. Contribution of diversity of household energy sources (such as; LPG, Kerosene and electricity) to the domestic energy system enhances energy security by reducing the risk of energy supply shortages and cost fluctuations [53].
Pattern of Energy Use for Lighting
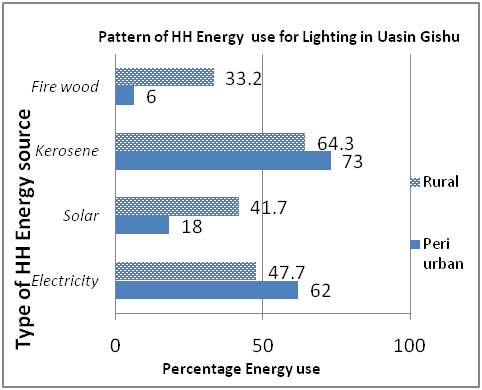
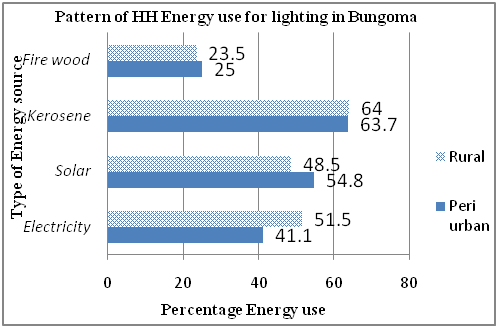
Figure 4 presents the percentage of households that use specific type of energy source for lighting on average for the two counties. In Uasin Gishu, there is reduced tendency of using firewood and solar as one move from rural to peri urban areas. The use of kerosene and electricity also increases as households move from rural to peri urban areas. The pattern of energy use for lighting presented in Figure 5 shows that there are small differences in the use of firewood, kerosene and solar between the rural and urban households. There are visible differences in terms of electricity and solar uses for lighting between the two groups of households.
Figure 4. Sources of household energy for Lighting in Uasin Gishu (Source: Author’s (2019))
Figure 5. Sources of household energy for Lighting in Bungoma (Source: Author’s (2019))

4.2. Determinants of Energy Sources Changing Behaviour for Cooking Sources Using GLM

Estimated models for rural and peri urban areas were generated using generalized linear model for the usage of LPG, electricity, charcoal and firewood for cooking. The overall model was significant when the omnibus test was applied for both peri urban and rural households (p – values were both 0.000 < 0.01).
(i) Determinants of LPG usage
The equation for peri-urban is as follows:
(2)
The equation for rural is as follows
(3)
(ii) Determinants of Electricity usage
The equation for peri-urban is as follows
(4)
The equation for rural is as follows
(5)
(iii) Determinants of charcoal usage
The equation for peri-urban is as follows
(6)
The equation for rural is as follows
(7)
(iv) Determinants of firewood usage
The equation for peri-urban is as follows
(8)
The equation for rural is as follows
(9)
(v) Determinants of kerosene usage
The equation for peri-urban is as follows
(10)
The equation for rural is as follows
(11)
Where; y = the probability specific household energy sources, HHs = Household size, INC = Average income earned per day in KSH, AGE = Age of HH head, NCS = Number of charcoal supplying shops in village, NLS = Number of LPG supplying shops in village where respondent lives, DCS = Distance to nearest charcoal supplying shop in km, DLPG = Distance to nearest LPG supplying shop in km, RENb= biogas for cooking, MS = Marital status, GHH= Gender of Household head AE=Access to electricity, e = random error term.
Generalized linear model was used to estimate the magnitude and significance of effects of determinants of energy sources changing behaviour for household energy choice for cooking. Income level showed the highest weights of the factor and significantly associated among all the fuels implying that the choice of household fuel is to a large extent a function of household income level and hence supporting research done by [54]. It was found that LPG has the highest weights of the factor of 213.39 and 161.0 followed by electricity 208.38 and 193.05 in rural and peri-urban respectively implying that households utilizes modern cooking fuels with increase in income.
Model also found that age of the household head play an important role in influencing a household’s decision to choose energy source. Age of the household head are positively associated with the use of firewood in rural and peri-urban, because it is considered to be less dangerous compared to energy sources such as LPG and charcoal at household level. Household with older male tend to use firewood. In developing countries, female household members are involved in cooking and collecting firewood; therefore, female head of households are more likely to choose clean energy sources such as LPG and electricity as shown by GHH in equation 3, and they are less likely to choose firewood and kerosene that affects their reproductive health [28].
GLM further showed that size of the household (HHS) is negatively and significantly associated with changing to clean cooking fuel such as LPG and electricity both in rural and peri-urban. Household size is positively associated with the use of firewood, kerosene and charcoal in Peri-urban areas while it is positively associated with the use of firewood in rural areas.
It was revealed that distance to the nearest retail shops selling charcoal (DCS) measured in kilometers is negatively associated with the charcoal utilization and positively associated with retail shops selling LPG (DLPG), indicating that with increase in distance to retail shop, households opt to use energies which are not further away from the retail shops. There is a negative and significant relationship in distance to LPG retail shops households and the use of LPG which concurs with [55]. The use of renewable energy sources such as biogas showed a reduction in the use of firewood and charcoal for cooking among the rural. The results further showed that there is positive association between the number of retail shops selling household energy and the type of fuel used at household level for cooking implying that nearest to diverse supplying shops selling fuel is positively associated with household changing behaviour. Accessibility to electricity also is associated with its use for cooking. The results furthermore found that there is a shift towards LPG and charcoal with increase in income and as one move from the rural to peri-urban.

5. Conclusions

The findings showed that biomass (firewood and charcoal) is still being used highly by households in peri urban and rural areas as primary or secondary fuel for cooking energy. The use of LPG for cooking increases as one moves from rural to peri urban in both counties of western Kenya. The results further show that, many of the households use multiple fuels to enhance their energy security in the study areas. The household energy utilization, pattern and changing behaviour follow the energy stacking model as household transit gradually to modern fuels with increase in income. The research findings offer insights to enhance household energy policy making in Kenya and countries alike. There is need for research on the influence of the level of education on household energy utilization.

ACKNOWLEDGEMENT

The author acknowledges the support from ASALI project which was funded through the legacy of Late Ms Grietje Wille.

References

[1]  Unies, N. (2017). World population prospects: the 2015 revision: key findings and advance tables. UN.
[2]  AfDB, O. E. C. D. (2016). African economic outlook 2016: sustainable cities and structural transformation. In African development bank, organization for economic co-operation and development. United Nations Development Programme Tunis.
[3]  Karekezi, S., Kimani, J., & Onguru, O. (2008). Energy access among the urban poor in Kenya. Energy for Sustainable Development, 12(4), 38-48.
[4]  AfDB/OECD/UNDP. (2016). African Economic Outlook 2016: Sustainable Cities and Structural Transformation, OECD Publishing, Paris.
[5]  Duflo, E., Greenstone, M., & Hanna, R. (2008). Indoor air pollution, health and economic well-being. SAPI EN. S. Surveys and Perspectives Integrating Environment and Society, (1.1).
[6]  Fullerton, D. G., Bruce, N., & Gordon, S. B. (2008). Indoor air pollution from biomass fuel smoke is a major health concern in the developing world. Transactions of the Royal Society of Tropical Medicine and Hygiene, 102(9), 843-851.
[7]  Ezzati, M., & Kammen, D. M. (2001). Indoor air pollution from biomass combustion and acute respiratory infections in Kenya: an exposure-response study. The Lancet, 358(9282), 619-624.
[8]  Rahut, D. B., Ali, A., & Behera, B. (2017). Domestic use of dirty energy and its effects on human health: empirical evidence from Bhutan. International Journal of Sustainable Energy, 36(10), 983-993.
[9]  Idiata, D. J., Ebiogbe, M., Oriakhi, H., & Iyalekhue, H. (2013). Wood fuel usage and the challenges on the environment. International Journals of Engineering Sciences, 2, 110-114.
[10]  Rahut, D. B., Ali, A., & Behera, B. (2017). Domestic use of dirty energy and its effects on human health: empirical evidence from Bhutan. International Journal of Sustainable Energy, 36(10), 983-993.
[11]  Chuang, M. C., & Ma, H. W. (2013). Energy security and improvements in the function of diversity indices—Taiwan energy supply structure case study. Renewable and Sustainable Energy Reviews, 24, 9-20.
[12]  Arnold, M., Köhlin, G., Persson, R., & Shepherd, G. (2003). Fuelwood Revisited: What has changed in the last decade?.
[13]  Akpalu, W., Dasmani, I., & Aglobitse, P. B. (2011). Demand for cooking fuels in a developing country: To what extent do taste and preferences matter?. Energy Policy, 39(10), 6525-6531.
[14]  Ruiz-Mercado, I., & Masera, O. (2015). Patterns of stove use in the context of fuel–device stacking: rationale and implications. EcoHealth, 12(1), 42-56.
[15]  Burger, P., Bezençon, V., Bornemann, B., Brosch, T., Carabias-Hütter, V., Farsi, M., ... & Sander, D. (2015). Advances in understanding energy consumption behavior and the governance of its change–outline of an integrated framework. Frontiers in energy research, 3, 29.
[16]  Louw, K., Conradie, B., Howells, M., & Dekenah, M. (2008). Determinants of electricity demand for newly electrified low-income African households. Energy policy, 36(8), 2812-2818.
[17]  Van der Kroon, B., Brouwer, R., & Van Beukering, P. J. (2013). The energy ladder: Theoretical myth or empirical truth? Results from a meta-analysis. Renewable and Sustainable Energy Reviews, 20, 504-513.
[18]  Smith, M. G., & Urpelainen, J. (2014). The effect of feed-in tariffs on renewable electricity generation: An instrumental variables approach. Environmental and resource economics, 57(3), 367-392.
[19]  Musango, J. K. (2014). Household electricity access and consumption behaviour in an urban environment: The case of Gauteng in South Africa. Energy for Sustainable Development, 23, 305-316.
[20]  Mutua, J., & Kimuyu, P. (2015). Household energy conservation in Kenya: estimating the drivers and possible savings. Environment for Development Discussion Paper-Resources for the Future (RFF), (15-04).
[21]  Lusambo, L. P. (2016). Households. Income Poverty and Inequalities in Tanzania: Analysis of Empirical Evidence of Methodological Challenges’. J Ecosys Ecograph, 6, 183.
[22]  Choumert, J., Motel, P. C., & Le roux, L. (2017). Energy Ladder or Energy Stacking: A Panel Data Analysis of Tanzanian Households’ Energy Choices.
[23]  Hosier, R. H., & Dowd, J. (1987). Household fuel choice in Zimbabwe: an empirical test of the energy ladder hypothesis. Resources and energy, 9(4), 347-361.
[24]  Heltberg, R. (2004). Fuel switching: evidence from eight developing countries. Energy economics, 26(5), 869-887.
[25]  Masera, O. R., Saatkamp, B. D., & Kammen, D. M. (2000). From linear fuel switching to multiple cooking strategies: a critique and alternative to the energy ladder model. World development, 28(12), 2083-2103.
[26]  Mekonnen, A., & Köhlin, G. (2008). Biomass fuel consumption and dung use as manure: evidence from rural households in the Amhara Region of Ethiopia. Environment for Development Discussion Paper-Resources for the Future (RFF), (08-17).
[27]  Lall, S. V., Henderson, J. V., & Venables, A. J. (2017). Africa's cities: Opening doors to the world. The World Bank.
[28]  Gatama, M. N., & Planning, E. (2014). Factors influencing household energy consumption: the case of biomass fuels in Kikuyu district of Kiambu county, Kenya.
[29]  Noorloos, Femke van and Kloosterboer Marjan. 2019. Africa’s new cities: The contested future of urbanization, Urban Studies Journal Limited, Vol. 55(6), 1223–1241.
[30]  International energy Agency (IEA), 2017. World Energy Outlook (2017).
[31]  Crousillat, E., Hamilton, R., & Antmann, P. (2010). Addressing the electricity access gap. Background paper for the World Bank Group Energy Sector Strategy, World Bank, Washington, DC.
[32]  Mwampamba, T. H. (2007). Has the woodfuel crisis returned? Urban charcoal consumption in Tanzania and its implications to present and future forest availability. Energy Policy, 35(8), 4221-4234.
[33]  Karekezi, S., & Kithyoma, W. (2002). Renewable energy strategies for rural Africa: is a PV-led renewable energy strategy the right approach for providing modern energy to the rural poor of sub-Saharan Africa?. Energy policy, 30(11-12), 1071-1086.
[34]  World Bank (2016). World Bank data base. Accessed on 02-04-2019, available at https://data.worldbank.org/indicator/SP.POP.GROW.
[35]  United Nations Economic Commission for Africa (UN ECA) (2017). Economic Report on Africa 2017: Urbanization and Industrialization for Africa’s Transformation. United Nations Addis Ababa, Ethiopia. https://0x9.me/hn9gB.
[36]  DESA, U. (2014). World urbanization prospects: The 2014 revision, highlights. United Nations, Department of Economic and Social Affairs (UN/DESA), Population Division. United Nations publication. Online available at https://esa.un.org/unpd/wup/Publications/Files/WUP2014-Highlights. pdf. Accessd on, 23, 2017.
[37]  Pundo, M. O., & Fraser, G. C. (2006). Multinomial logit analysis of household cooking fuel choice in rural Kenya: The case of Kisumu district. Agrekon, 45(1), 24-37.
[38]  Yonemitsu, A., Njenga, M., Iiyama, M., Matsushita, S., & and, A. (2015). A choice experiment study on fuel preference of Kibera slum households in Kenya. Int J Environ Sci Dev, 6(3), 196-200.
[39]  Danlami, A. H., Applanaidu, S. D., & Islam, R. (2018). An analysis of household cooking fuel choice: A case of Bauchi State, Nigeria. International Journal of Energy Sector Management, 12(2), 265-283.
[40]  Mutua, J., Ngui, D., Osiolo, H., Aligula, E., & Gachanja, J. (2012). Consumers satisfaction in the energy sector in Kenya. Energy policy, 48, 702-710.
[41]  Danlami, A. H., Applanaidu, S. D., & Islam, R. (2018). An analysis of household cooking fuel choice: A case of Bauchi State, Nigeria. International Journal of Energy Sector Management, 12(2), 265-283.
[42]  Armel, T. K. F., Vidal, A. K. C., & René, T. (2015). Energy analysis and exergy utilization in the residential sector of Cameroon. Energy and Power Engineering, 7(03), 93.
[43]  Chen, Q., Yang, H., Liu, T., & Zhang, L. (2016). Household biomass energy choice and its policy implications on improving rural livelihoods in Sichuan, China. Energy Policy, 93, 291-302.
[44]  Pachauri, S., & Jiang, L. (2008). The household energy transition in India and China. Energy policy, 36(11), 4022-4035.
[45]  Masera, O. R., Saatkamp, B. D., & Kammen, D. M. (2000). From linear fuel switching to multiple cooking strategies: a critique and alternative to the energy ladder model. World development, 28(12), 2083-2103.
[46]  Kayode, R., Akhavan Farshchi, M., & Ford, A. (2015). Analysis of household energy consumption in Nigeria. Assessed on Sept, 24, 2016.
[47]  Mbaka, C. K., Gikonyo, J., & Kisaka, O. M. (2019). Households’ energy preference and consumption intensity in Kenya. Energy, Sustainability and Society, 9(1), 20.
[48]  Mutua, J., & Kimuyu, P. (2015). Household energy conservation in Kenya: estimating the drivers and possible savings. Environment for Development Discussion Paper-Resources for the Future (RFF), (15-04).
[49]  Tso, G. K., & Guan, J. (2014). A multilevel regression approach to understand effects of environment indicators and household features on residential energy consumption. Energy, 66, 722-731.
[50]  McCullagh, P., & Nelder, J. (1989). Generalized Linear Models Second edition Chapman & Hall.
[51]  Hogg, R. V., McKean, J. W., & Craig, A. T. (2013). Introduction to mathematical statistics. chapter 3.
[52]  Zhou, K., & Yang, S. (2016). Understanding household energy consumption behavior: The contribution of energy big data analytics. Renewable and Sustainable Energy Reviews, 56, 810-819.
[53]  Chuang, M. C., & Ma, H. W. (2013). An assessment of Taiwan’s energy policy using multi-dimensional energy security indicators. Renewable and Sustainable Energy Reviews, 17, 301-311.
[54]  Joshi, J., & Bohara, A. K. (2017). Household preferences for cooking fuels and inter-fuel substitutions: Unlocking the modern fuels in the Nepalese household. Energy Policy, 107, 507-523.
[55]  Brouwer, I. D., Hoorweg, J. C., & Van Liere, M. J. (1997). When households run out of fuel: responses of rural households to decreasing fuelwood availability, Ntcheu District, Malawi. World development, 25(2), 255-266.