-
Paper Information
- Previous Paper
- Paper Submission
-
Journal Information
- About This Journal
- Editorial Board
- Current Issue
- Archive
- Author Guidelines
- Contact Us
International Journal of Energy Engineering
p-ISSN: 2163-1891 e-ISSN: 2163-1905
2017; 7(3): 79-89
doi:10.5923/j.ijee.20170703.03

Modern Techniques for Power Quality Analysis Using LabVIEW Environment
 Abstract
 Reference
 Full-Text PDF
 Full-text HTML
Claudiu-Ionel Nicola, Marcel Nicola, Viorica Voicu, Maria Cristina Niţu, Sebastian Popescu
Research, Development Division for Electric Equipment and Energy Efficiency, ICMET Craiova, Romania
Correspondence to: Claudiu-Ionel Nicola, Research, Development Division for Electric Equipment and Energy Efficiency, ICMET Craiova, Romania.
| Email: |  |
Copyright © 2017 Scientific & Academic Publishing. All Rights Reserved.
This work is licensed under the Creative Commons Attribution International License (CC BY).
http://creativecommons.org/licenses/by/4.0/

This paper presents a case study for monitoring the quality of electric energy in an industrial manufacturer of technical rubber and reclaimed rubber products. The measurements were carried in the power supply point where the quality of the electric energy is influenced by the activity of the manufacturer, the transmission and distribution provider, the supplier as well as the electric power consumer activity. Transients occur at this limiting point, with negative effects on the consumer, as well as on the electric power supply network. Quality indicators of electric energy, depending on the place of occurrence of disturbances are indicators of primary and secondary quality indicators. The data processing was achieved using LabVIEW software in terms of the two types of quality indicators. A software application was made to allow reading of files and processing them (creation of data tables and charts). Based on the data obtained from the measurements and using the interface created in LabVIEW, it was possible to carry out the analysis of the average hourly consumption, the power factor, the wave forms of the current and voltage, the analysis of the current and voltage harmonics. The software application enables creation of customized reports with varying ease of use and flexibility. Using the software application developed in LabVIEW, full quality analysis of electric energy can be done at the user's premises.
Keywords: Quality analysis, Electric energy, LaVIEW environment
Cite this paper: Claudiu-Ionel Nicola, Marcel Nicola, Viorica Voicu, Maria Cristina Niţu, Sebastian Popescu, Modern Techniques for Power Quality Analysis Using LabVIEW Environment, International Journal of Energy Engineering, Vol. 7 No. 3, 2017, pp. 79-89. doi: 10.5923/j.ijee.20170703.03.
Article Outline
1. Introduction
- The quality of the electric energy is influenced by the activity of the manufacturer, the transmission and distribution provider, the supplier as well as the electric power consumer activity. The operation of industrial users can be accompanied by the input of significant disturbances in the electric power supply network in the form of voltage fluctuations, voltage dips and swells, unbalance which can translate into a reduction in the quality of electricity supplied to the consumers connected in the network [1].An incident in any of these grids can lead to an interruption in the supply and/or dips that - depending on the structure of the grid - can produce effects on consumers and producers connected in a same power supply points and even further. An incident in the facilities of a manufacturer or a consumer may lead to a transient that would affect all consumers connected at the same power supply points [2, 3].Quality indicators of electric energy, depending on the place of occurrence of disturbances are indicators of primary and secondary quality indicators [1]. The quality of electric energy – is assessed using quality indicators for specific electrical quantities, voltage, frequency and respectively for the electricity supply utility in terms of the duration of power failure. The quality indicators are determined at the limiting points between the electric wiring of the supplier and of the consumer which constitute the load:- primary quality indicators (power supply frequency variations, voltage variations, dips, power failure, temporary surges, transients) are given by the production, transport and distribution of electric energy;- secondary indicators (harmonics, interharmonics, voltage fluctuations, unbalances) are given by the disruptive operation of industrial consumers [1, 4-9].The values accepted for most quality indicators are standardized by energy standards and prescriptions. According to the standard of performance for the electricity supply utility with regulated tariffs the supplier has the obligation to meet the parameters of electric energy quality [10, 11].Based on these considerations and according to present laws of energy efficiency the industrial consumers are obliged to carry out an energy balance once every four years [12]. In order to improve quality evaluation of energy to industrial consumers, we proposed a specialized software developed in LabVIEW that allows reading of measured data obtained from a network analyzer (in this case CHAUVIN ARNOUX - CA 8352), processing data to create a clear picture about the quality of electric energy in an industrial consumer. The LabVIEW is a programming environment based on G language (graphic language) core intended mainly to develop applications for data control and acquisition, their analysis and results presentation [13-16]. LabVIEW contains a comprehensive set of tools for acquiring, analysing, displaying, and storing data, as well as tools to help you troubleshoot the code you write [17].This paper presents a case study for monitoring the quality of electric energy in an industrial consumer using a software application developed in LabVIEW.
2. Measurement Method
- The energy measurements carried out on the audited outline (fig. 1) were based on the use of the following three phase power analyser - CA 8352 power analyser [18].The audited outline is presented in Figure 1.
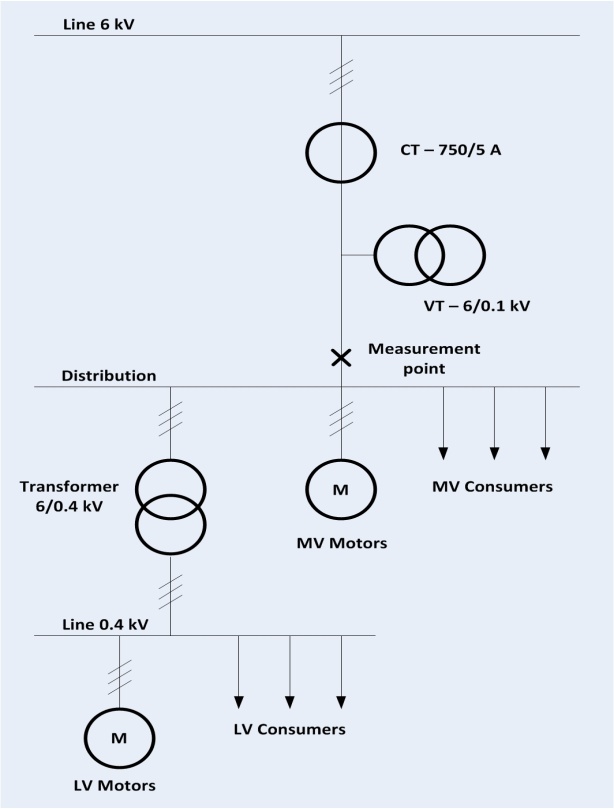 | Figure 1. Single-wire electrical circuit diagram |
3. Description of the Software
- The ability to analyse, interpret and manipulate data is a fundamental need in many scientific and engineering applications. LabVIEW provides built-in analysis capabilities in an integrated environment, enabling to obtain results faster. LabVIEW is the tool of choice due to its unparalleled connectivity to instruments, powerful data acquisition capabilities, natural dataflow-based graphical programming interface, scalability, and overall functional completeness. One need that persists regardless of the area of expertise is the fact that users must manipulate data and measurements, and make decisions based on it. The CA 8352 has a software package allowing the user to download the data stored in the internal storage to a PC and using an interface developed LaVIEW, full quality analysis of electric energy can be done at the user's premises. The LabVIEW is often viewed primarily as a measurement tool, but it also provides powerful analysis libraries, routines, and algorithms that range from basic math to advanced signal processing which can be easily integrated into any LabVIEW program. The stages of the analysis achieved using the software application for the measured data of quality indicators consist of loading text files, processing, achieving graphs with their evolution in time and generating excel type reports.According to the analysis stages the main structure used to develop the software application is flat sequence structure. Data flow for the flat sequence structure differs from data flow for other structures. Frames in a flat sequence structure execute from left to right and when all data values wired to a frame are available. The data leaves each frame as the frame finishes executing. This means the input of one frame can depend on the output of another frame.
3.1. Description of the Software for Primary Quality Indicators
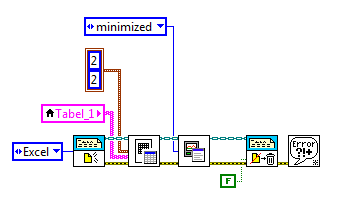
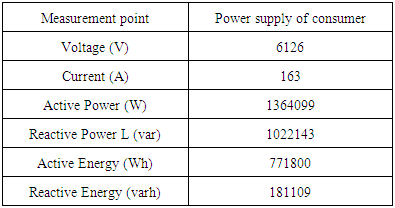
- The software application presented in Figure 2 is used to perform reading of text files from the results of measurements carried out using the network analyser for primary quality indicators. The primary quality indicators that we process are voltage, current, active power, reactive power, apparent power, power factor, active energy and reactive energy.
 | Figure 2. The software interface for power quality |
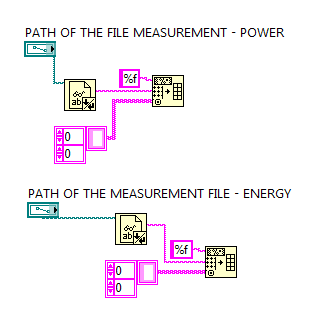 | Figure 3. Read from text file function |
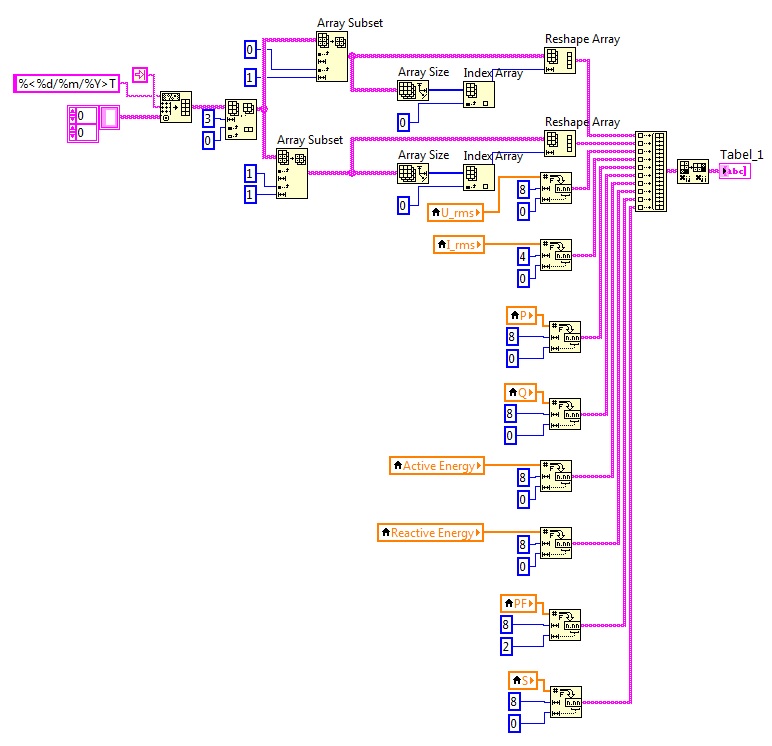 | Figure 4. Build table with measurement data |
 | Figure 5. Generate excel report for measured data with date and time properly |
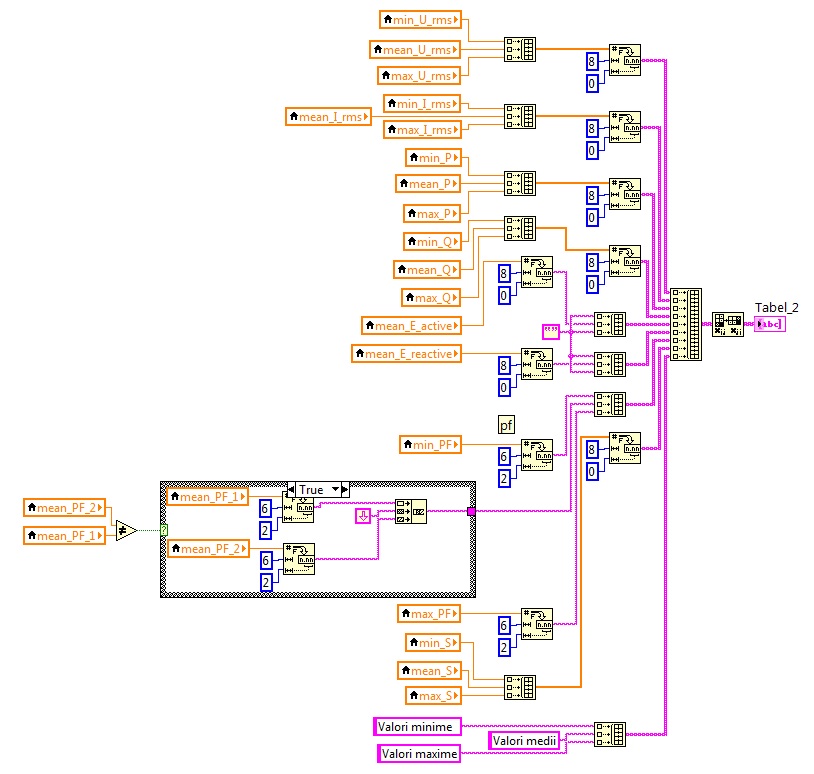 | Figure 6. Build table with processed data |
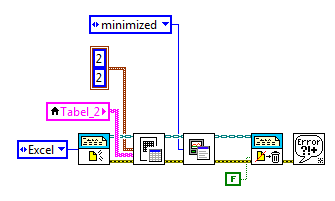 | Figure 7. Generate excel report with the processed data |
3.2. Description of the Software for Secondary Quality Indicators
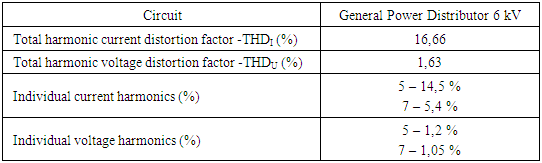
- The software application presented in Figure 8 is used also to perform reading of text files from the results of measurements carried out using the network analyser for secondary quality indicators. The secondary quality indicators that we process are individual current harmonics, individual voltage harmonics, the total harmonic distortion for current and the total harmonic distortion for voltage.
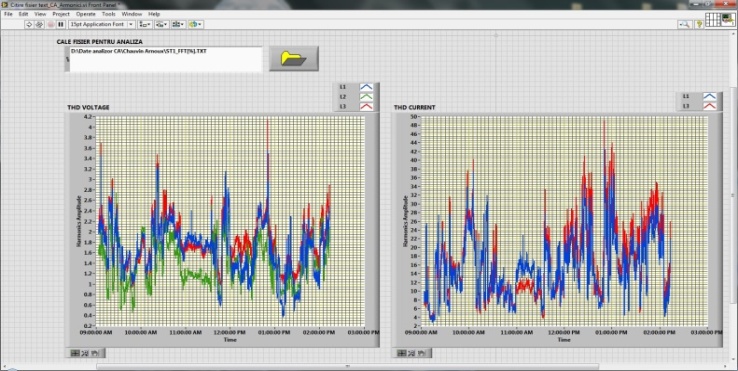 | Figure 8. The software interface for harmonic analysis |
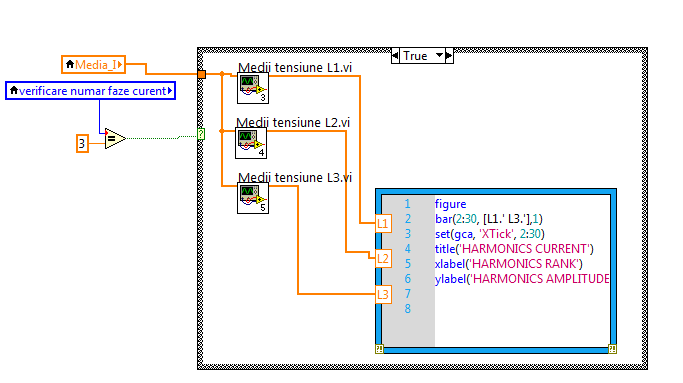 | Figure 9. Plot of the bar graph with harmonics |
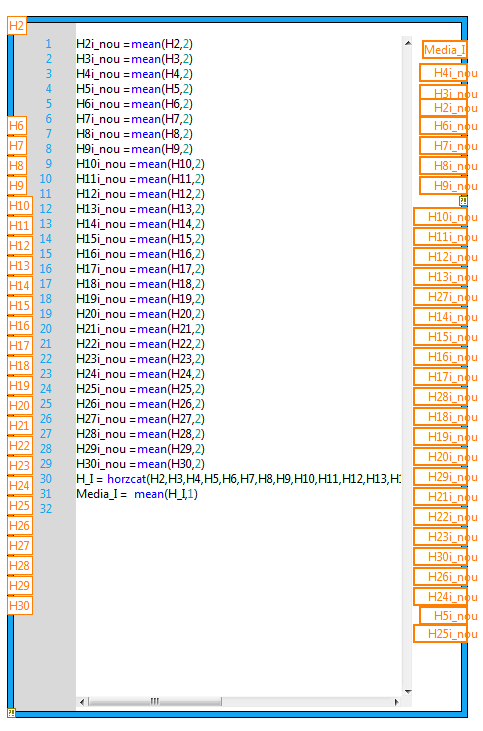 | Figure 10. MathScript Node for calculating means of columns and rows |
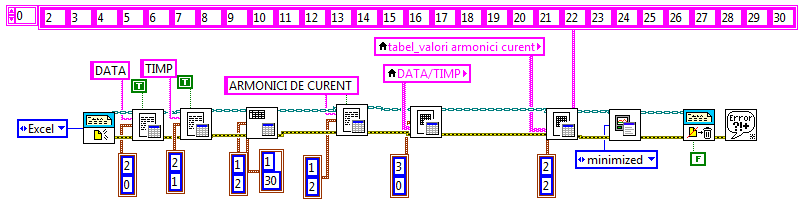 | Figure 11. Generate excel report with individual current harmonics |
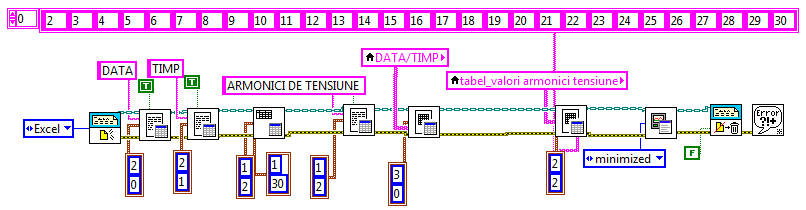 | Figure 12. Generate excel report with individual voltage harmonics |
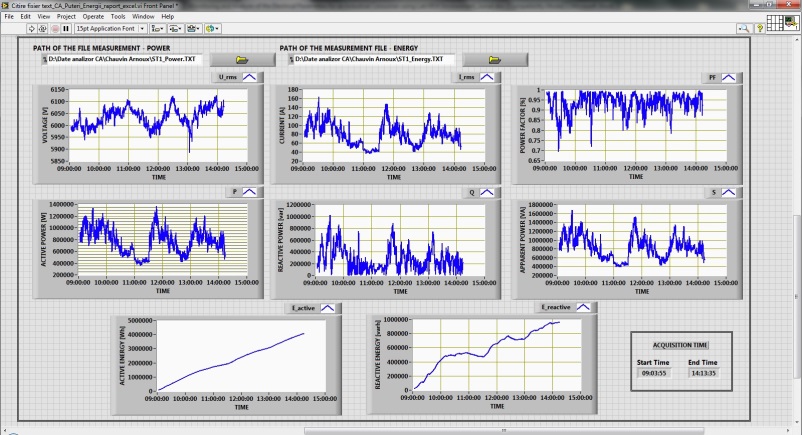
4. Results Obtained with LabVIEW Software Application
- The measurements were carried out at the level of 6 kV on the outgoing circuit on the consumer switchboard, with a 5 seconds sampling rate of measurements.Processing the measured data in LabVIEW revealed the following charts for the evolution in time of the data resulting from measurements:
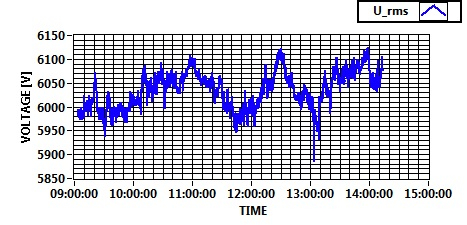 | Figure 13. Time evolution of voltage |
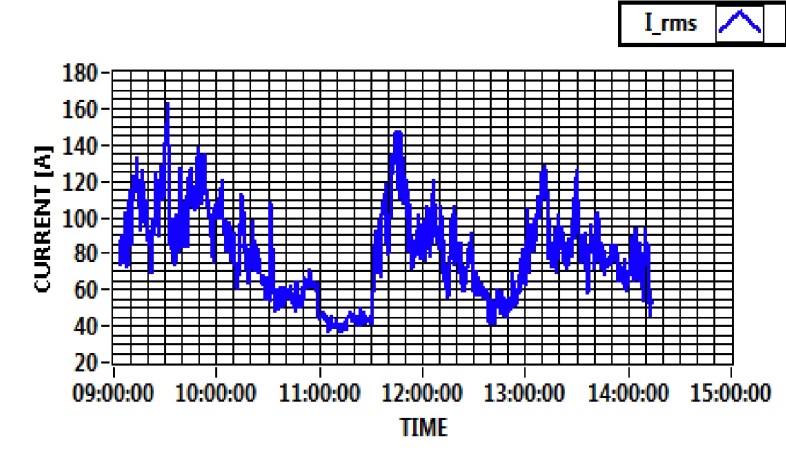 | Figure 14. Time evolution of current |
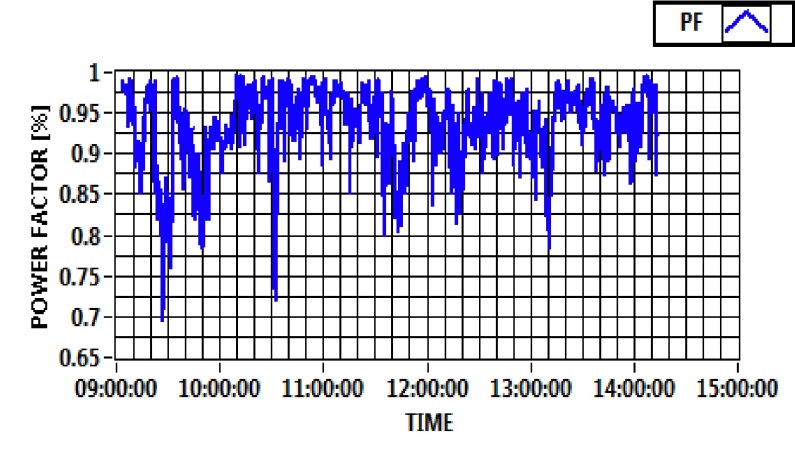 | Figure 15. Time evolution of power factor |
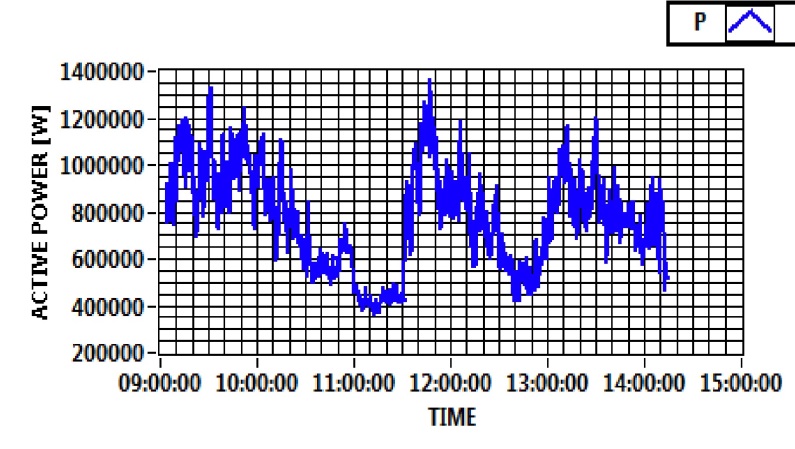 | Figure 16. Time evolution of active power |
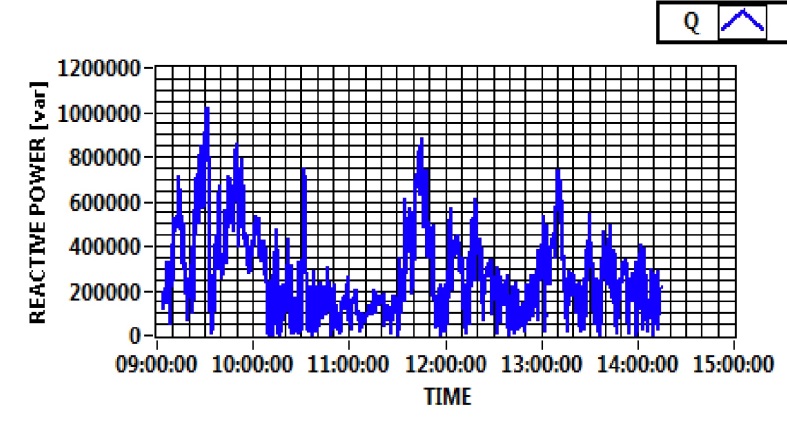 | Figure 17. Time evolution of reactive power |
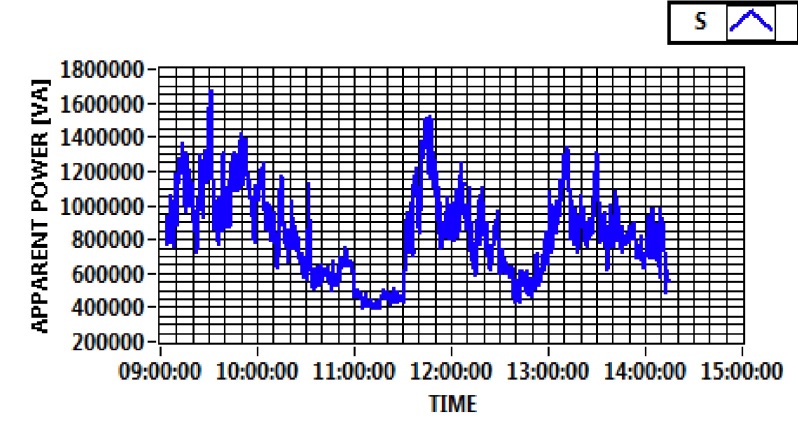 | Figure 18. Time evolution of apparent power |
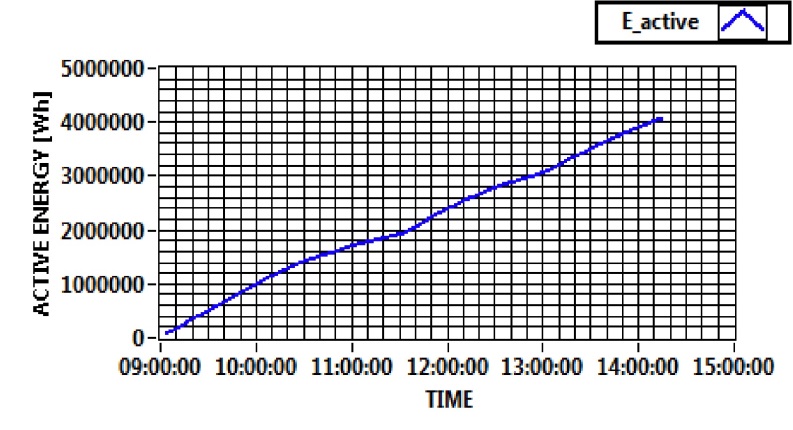 | Figure 19. Time evolution of active energy |
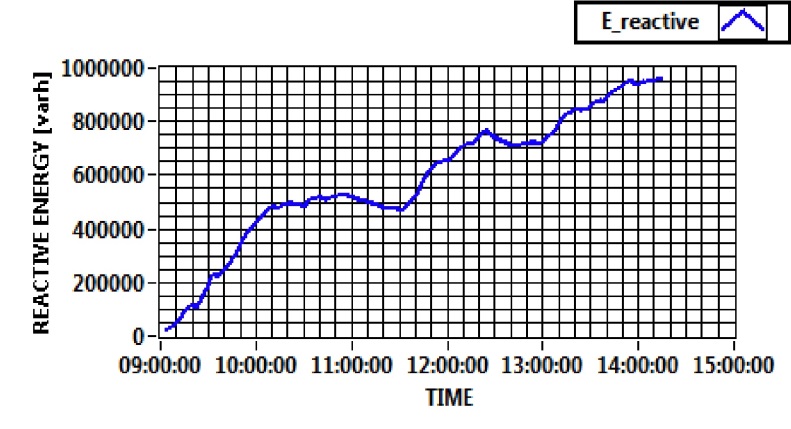 | Figure 20. Time evolution of reactive energy |
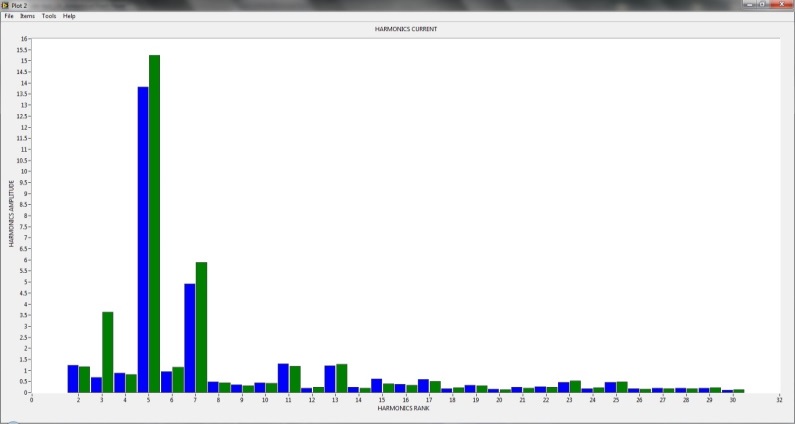 | Figure 21. Individual current harmonics |
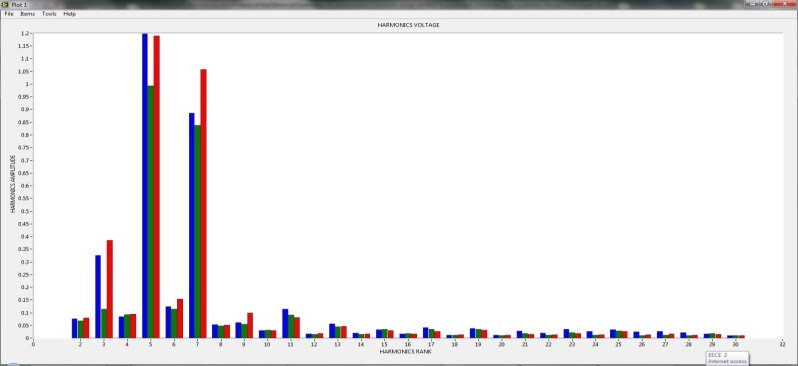 | Figure 22. Individual voltage harmonics |
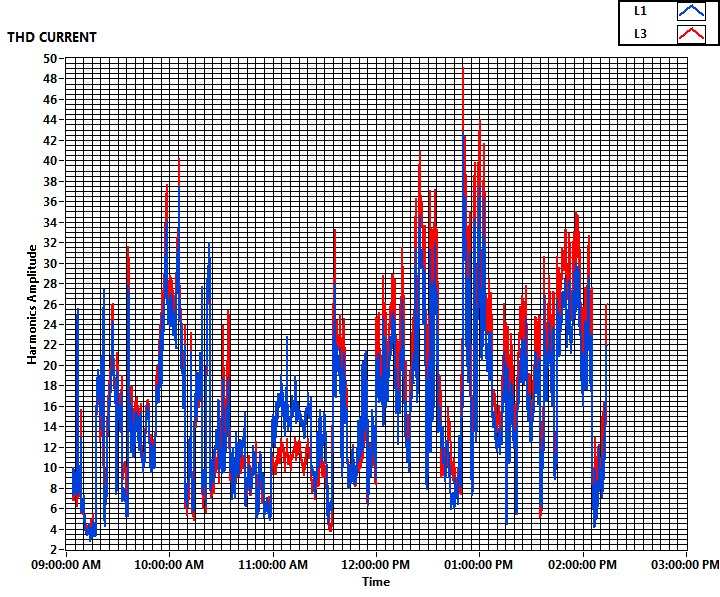 | Figure 23. Total harmonic current distorsion factor -THDI |
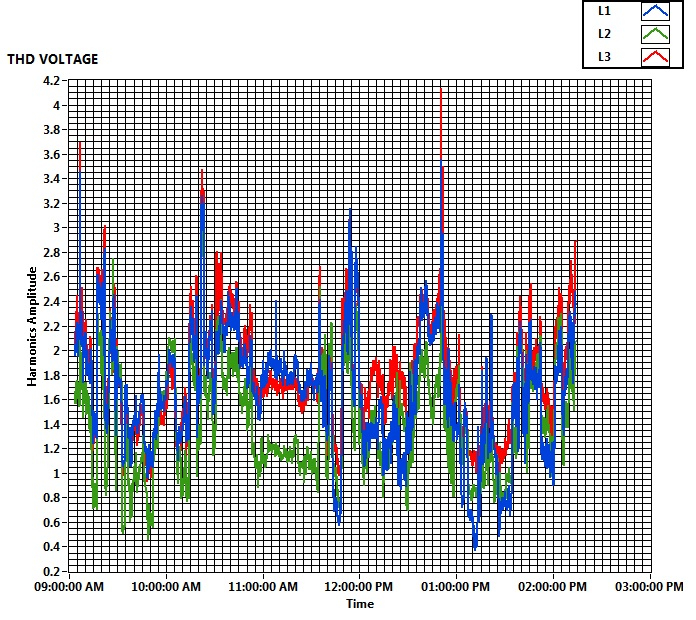 | Figure 24. Total harmonic voltage distorsion factor -THDU |
|
|
5. Conclusions
- The software application realised and presented in this paper starts from the problems caused by harmonic currents overloading of the working neutral, overheating of the transformers, unexpected operation of the circuit breakers, overload of capacitors for power factor correction, Kelvin effect in conductors. The software application developed in LabVIEW allows reading of measured data carried out using the network analyser, processing data to create a clear picture about the quality of electric energy in an industrial consumer, achieving charts and their evolution in time, as well as generating word-based files containing the processed data. It was possible to carry out the analysis of the average hourly consumption, the power factor, the wave forms of the current and voltage, the analysis of the current and voltage harmonics.Data obtained from the processing program developed in LabVIEW allows a detailed analysis of the status of the measured system. The software application follows the user’s requirements and facilitates the analysis of power quality at industrial consumer.Future works will analyse the possibility of installing power-line active filters to reduce 5th and 7th harmonics and to meet the standards on negative non-symmetrical and distorting condition in electrical networks.
ACKNOWLEDGEMENTS
- The paper was developed with funds from the Romanian Ministry of Education and Scientific Research as part of the NUCLEU Program: PN 09 01 01 27.