-
Paper Information
- Paper Submission
-
Journal Information
- About This Journal
- Editorial Board
- Current Issue
- Archive
- Author Guidelines
- Contact Us
International Journal of Energy Engineering
p-ISSN: 2163-1891 e-ISSN: 2163-1905
2017; 7(2): 55-63
doi:10.5923/j.ijee.20170702.03

A Case Study on Off-grid Microgrid for Universal Electricity Access in the Eastern Cape of South Africa
 Abstract
 Reference
 Full-Text PDF
 Full-text HTML
O. M. Longe1, N. D. Rao2, F. Omowole3, A. S. Oluwalami3, O. T. Oni3
1Electrical and Electronics Engineering Science, University of Johannesburg, Johannesburg, South Africa
2Energy Program, International Institute for Applied Systems Analysis (IIASA), Laxenburg, Austria
3Electrical and Electronics Engineering Technology, Rufus Giwa Polytechnic, Owo, Nigeria
Correspondence to: O. M. Longe, Electrical and Electronics Engineering Science, University of Johannesburg, Johannesburg, South Africa.
| Email: |  |
Copyright © 2017 Scientific & Academic Publishing. All Rights Reserved.
This work is licensed under the Creative Commons Attribution International License (CC BY).
http://creativecommons.org/licenses/by/4.0/

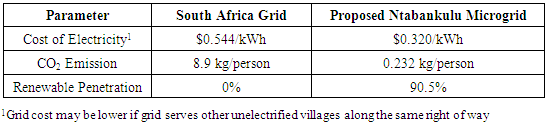
Microgrid is progressively an option for electricity access in unelectrified areas in developing nations. This study investigates the costs of microgrid solutions in comparison to grid extension to provide universal electricity access in Ntabankulu Local Municipality, Eastern Cape, South Africa. The Hybrid Optimization Model for Electric Renewable (HOMER) software was used to carry out simulation, optimization and sensitivity analyses. The results showed that a Wind/Diesel Generator/Battery-powered microgrid has the lowest cost with a breakeven grid extension distance of -45.38 km. The proposed microgrid could supply electricity at $0.320/kWh, with 0.0057 kg/kWh CO2 emissions and 90.5% renewable fraction, which are lower than grid extension. Therefore, a Renewable Energy Source (RES) hybrid microgrid solution can be a viable option for electrifying far-from-the-grid unelectrified areas of the Eastern Cape.
Keywords: Microgrid, Universal electricity access, Grid extension, HOMER, Renewable Energy Sources
Cite this paper: O. M. Longe, N. D. Rao, F. Omowole, A. S. Oluwalami, O. T. Oni, A Case Study on Off-grid Microgrid for Universal Electricity Access in the Eastern Cape of South Africa, International Journal of Energy Engineering, Vol. 7 No. 2, 2017, pp. 55-63. doi: 10.5923/j.ijee.20170702.03.
Article Outline
1. Introduction
- The importance of electricity access to the socio-economic development of man cannot be over-emphasized. There are about 1.2 billion people around the world that lack access to electricity, of which 80% live in rural areas, and 634 million of whom are in Sub-Saharan Africa according to [1]. Most rural areas in Sub-Saharan Africa are in off the grid locations. Grid extension in rural South Africa has faced numerous challenges, which has led to low electrification rates in most rural areas. Some of the challenges facing grid extension to rural areas include low population density (spatial heterogeneity), remoteness of small villages, high costs of electricity production, transmission, and distribution, including losses, low energy demand, low level of industrialization, limited funding support and low return-on-investment.In this study, the merits of a standalone microgrid in comparison to grid extension for Ntabankulu local municipality in the Eastern Cape province of South Africa were investigated. The following questions were addressed:Which microgrid design will meet the energy demand of the Ntabankulu satisfactorily at the lowest Net Present Cost (NPC)?Is it cheaper to supply electricity to Ntabankulu from a microgrid or from the grid?How robust is the optimal choice with respect to uncertainties in average load, wind speed and cost of wind turbine, solar radiation and cost of photovoltaic array, fuel prices, cost of batteries, converter and diesel generator?Primarily, system cost was examined, but also the CO2 emissions and renewable share of each option were found in this work also.A microgrid can be defined as a regional or communal energy system comprising distributed energy sources (renewable and/or non-renewable) often in order to optimize power quality, reliability, efficiency and sustainability with accompanying economic benefits (cheaper cost of energy, local employment generation and economic development) and environmental benefits (if renewable energy sources are used). Microgrid can be operated in off-grid, on-grid or dual-mode depending on factors such as capacity, availability of energy sources and the required load patterns. In [2, 3], microgrids were implemented for premises such as campus, military base, rural areas, commercial and industrial parks. Renewable Energy Sources (RES) that could be implemented on a microgrid include solar, wind, water and biomass while battery, diesel, oil and gas could be implemented as backup options. Microgrids for rural electrification have also been discussed in some previous studies like [4, 5]. Universal electricity access for rural area through RES has also become popular since it is a green form of energy and can contribute towards energy reliability and environmental preservation, especially in Sub-Saharan Africa as presented by [6].The International Energy Agency (IEA) in [7] proposed that by 2030, more rural areas will gain access to electricity through off-grid microgrids with about $320 billion investment than grid-connected with $170 billion investment due to the easier deployment of the former. Rural energy development in South Africa has also been recommended as sustainable by [6, 8-10].Although there are literature on microgrid design like [2-6], [8-10], but this work offers techno-economic analysis on how implementation of off-grid microgrid can offer electricity access to rural unelectrified areas in South Africa. The rest of the paper contains state of electricity access in South Africa and Ntabankulu local municipality, followed by the research methodology. The data acquisition method used in the simulations was also presented. Thereafter, the results, discussions and future work were also presented and followed by the research conclusions.
2. South Africa and Electricity Access
- South Africa has a population of 51.77 million people according to 2011 census by Statistics South Africa in [11] with 85.4% of households having access to electricity [12]. Furthermore, 80% of urban dwellers and 45% of rural dwellers in South Africa have access to electricity, reflecting the typical urban/rural disparity. South Africa is divided into nine provinces on a total land area of 1,219,912 km2. Figure 1 with data from [13] shows the percentage of households in each province of South Africa using electricity for lighting.
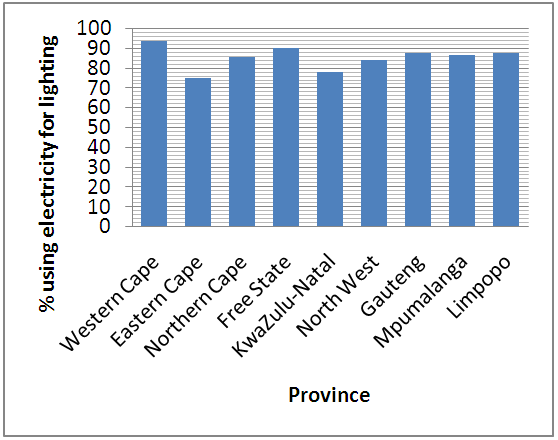 | Figure 1. Percentage of households that use electricity in South Africa for lighting |
2.1. Ntabankulu Local Municipality Electricity Access
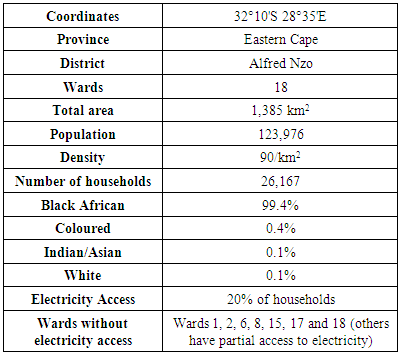
- Ntabankulu local Municipality (NLM) was a former administrative area in the OR Tambo District of Eastern Cape in South Africa, but after 2011 municipal election it was transferred to the Alfred Nzo District Municipality. The name is coined from the Xhosa language meaning “great or big mountain” and in fact one reason which could have made grid extension expensive to implement in the area. Its’ location on the map of Eastern Cape is shown in Figure 2, while some general information on the municipality is provided in Table 1 from [12, 14]. Presently, households that stand to benefit the most from electricity in Ntabankulu are those along the T125 main road. The current source of electricity is from Mount Ayliff and the existing substation is already overloaded. Engagement sessions between the Municipality, Department of Minerals and Energy (DME) and Eskom are critical as a way forward in achieving universal electricity access in the area.
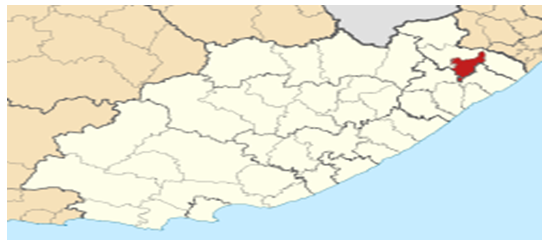 | Figure 2. Location of Ntabankulu Local Municipality on Eastern Cape map |
|
|
3. Research Methodology
- This research involves microgrid simulation and analyses. Hybrid Optimization Model for Electric Renewable (HOMER) software is used for the simulation, optimization and sensitivity analyses. In comparison to other time-series simulation models such as Hybrid2 [17], PV-DesignPro [18] and PV*SOL [19] and even non-time series simulators like RETScreen, HOMER limits the input complexity, and performs fast enough computation using a simpler logic [20]. Also, HOMER calculates a ranked optimization in increasing order of total Net Present Cost (NPC) of feasible design configurations. HOMER was developed by the National Renewable Energy Laboratory (NREL), U.S.A to assist in the design of micropower systems and to enhance the comparison of power generation technologies across a wide range of applications. HOMER software has been used to analyze microgrids in different nations of the world as shown by [20-22].
3.1. Description of Microgrid Design Setup
- The use of Renewable Energy Sources (RES) for microgrid design contributes to reduction in emission of greenhouse gases such as carbon dioxide (CO2), carbon monoxide (CO), sulphur dioxide (SO2), nitrogen oxides (NOx) and unburned hydrocarbon (UHC) emissions. Wind and solar energy are the RES components used in this microgrid design. Due to intermittency in wind and solar resources availability and the mismatch with energy demand, a battery is included in the design. Lastly, a diesel generating plant is also included in the microgrid design as a back-up in case there is energy shortage from the above energy sources, especially in the cold months where load is expected to rise. A power converter is also included in the design. The proposed Ntabankulu microgrid comprises Fuhrlander 100 wind turbine, Photovoltaic (PV) array, 6V Surrette 6CS25P battery, Diesel generator, and AC/DC converter as shown in Figure 3.
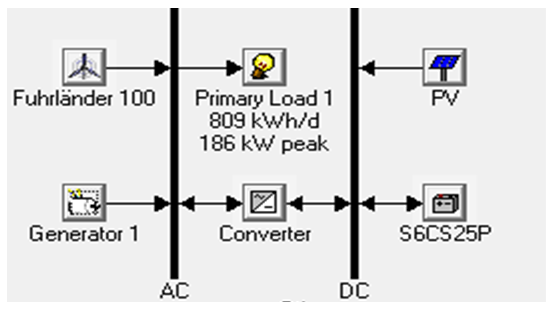 | Figure 3. Schematic representation of proposed Ntabankulu microgrid design |
3.2. Grid Extension Estimates
- The average cost of grid extension in Sub-Saharan Africa has been estimated by [22] as $20,000/km for 11 kV line cost only, but putting other electrification components and inflation rate into consideration a total estimate of $25,000/km was used in this analysis. Cost of extending grid to mountainous areas is generally higher than places of good terrains and Ntabankulu being a mountainous area may cost more.
3.3. Load Simulation
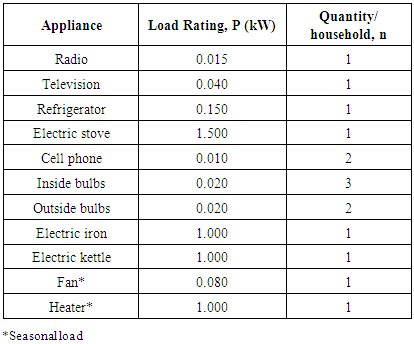
- Daily, seasonal and annual electrical load profiles were generated and simulated in HOMER. Also the appliances that constitute the load are shown in Table 3.
|
 by a household is given as:
 | (3.1) |
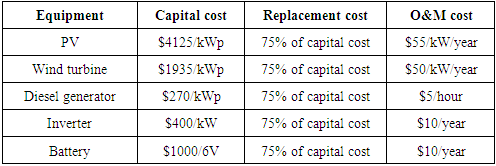
 is the quantity of the appliance i in use, Pi is the power rating of the appliance i and Ti is the duration of appliance i usage. The cost of equipment used in the simulations are presented in Table 4 for PV from [23, 24], wind turbine from [23], diesel generator [25], inverter [25] and battery [24].
|
4. Simulation Data
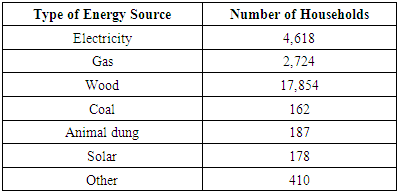
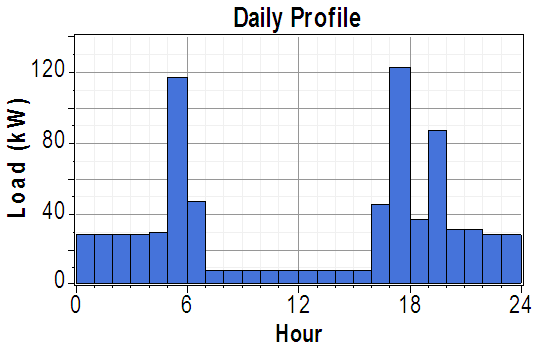
- The analysis requires data on wind resource, solar resource, technology costs, household’s income level, household appliances owned and load profiles. The most recently available unit records data were obtained from Statistics South Africa (STATSSA) on income and expenditure of households in [26], which provided information on access to electricity for lighting, number of households in the area, number of rooms per household and access to basic household electrical appliances, among others. This data was compared with income groups’ data [9] for Ntabankulu and used to impute the type of appliances owned by households in the area. Initially, it was assumed that same appliances were owned by all households since they are mostly within the same income class. Also, appliance usage was assumed similar for the households under consideration. The hourly energy consumption data for rural areas was obtained from [27] and similar load pattern was observed with the computed load data. The average daily load profile as simulated by HOMER is shown in Figure 4 while the average monthly simulated monthly load profile is shown in Figure 5. The average annual load generated was 809 kWh/day 186 kW peak for the fifty households under consideration.
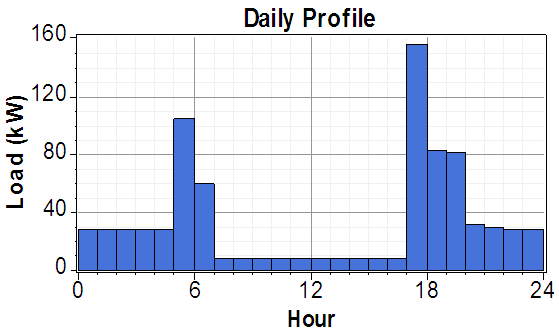 | Figure 4. Average daily load profile for proposed Ntabankulu microgrid |
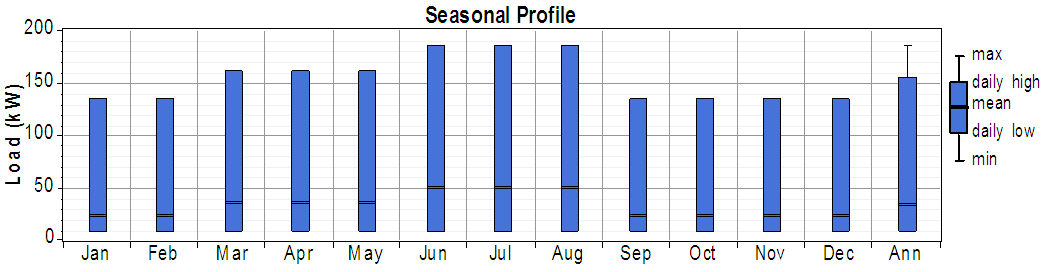 | Figure 5. Average monthly load profile for proposed Ntabankulu microgrid |
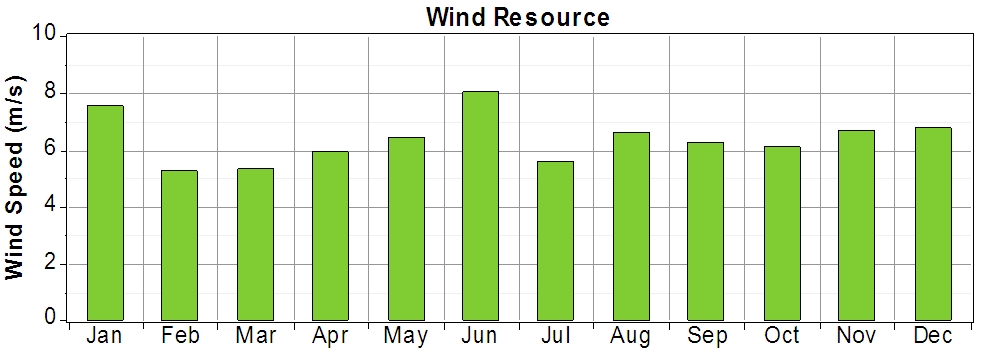 | Figure 6. Average monthly time series wind resource used for Ntabankulu |
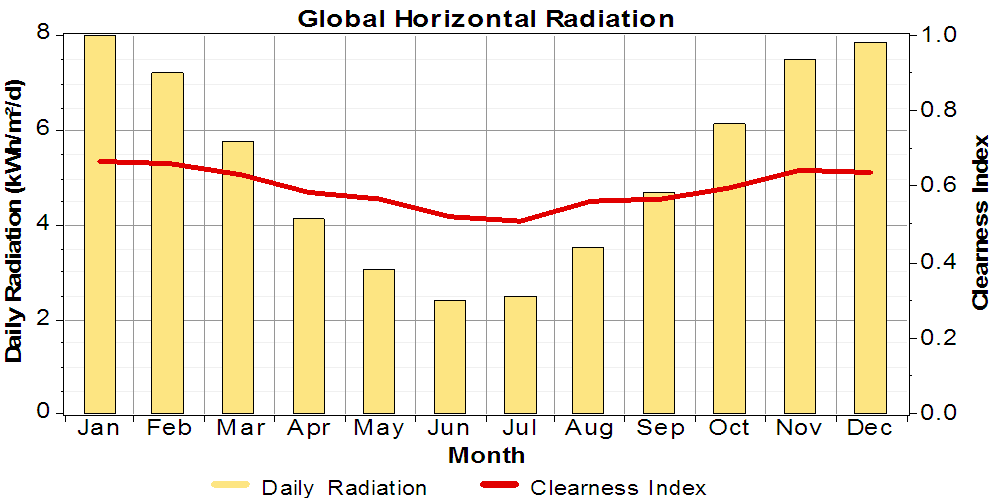 | Figure 7. Average monthly time series solar resource used for Ntabankulu |
5. Results and Discussion
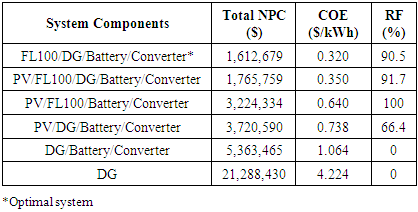
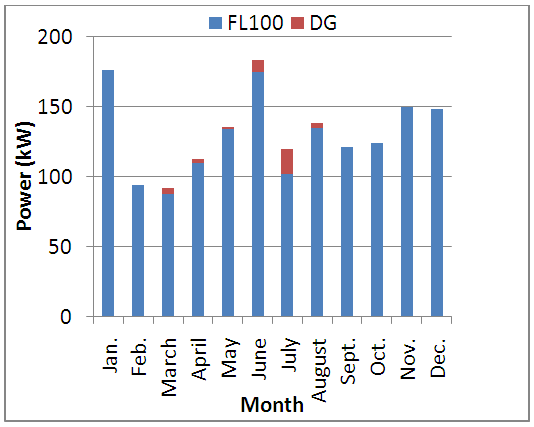
- The results of the analyses are presented in this section. Table 5 shows the results for the various optimal categorized microgrid system configurations reported by HOMER after the optimization simulation. The most cost-effective configuration for the proposed microgrid is the FL100/ DieselGenerator/Battery/Converter combination having the least total NPC of $1,612,679 with $0.320/kWh cost of electricity (COE) and Renewable Fraction (RF) or renewable penetration of 90.5%. This optimal system is composed of 3 Fuhrlander 100 kW wind turbines, a 100 kW diesel generator (DG), 250 V battery bank and a 200 kW converter. The monthly average electricity production from the proposed microgrid is shown in Figure 8 with the highest electrical energy production from the FL100 wind turbine.
|
 | Figure 8. Monthly average electric production for proposed Ntabankulu microgrid |
|
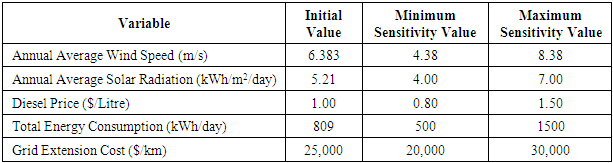
5.1. System Sensitivity Analyses
- The effect of uncertainties in wind speed, solar radiation, electric load, fuel price and grid extension cost by varying the minimum and maximum values for these variables was examined as presented in Table 7. For most cases in the design, the optimal system type remained the FL100/DieselGenerator/Battery/Converter hybrid microgrid. However, if wind speed falls below 4.43 m/s and the solar radiation rises beyond 5.19 kWh/m2/day, the optimal system becomes FL100/PV/DieselGenerator/Battery/Converter microgrid with a COE of $0.346/kWh. While at higher wind speed a COE of $0.301/kWh was obtained with a FL100/DieselGenerator/Battery/Converter hybrid microgrid. This implies that higher wind speed offers better economic advantage than higher solar irradiation due to the comparative advantage of large scale wind turbine over solar panels at such geographical location.
|
 | Figure 9. Average daily load profile of shifted load |
5.2. Breakeven Distance for Grid Extension
- The breakeven distance or Electric Distance Limit (EDL) between the NLM standalone microgrid and grid extension in this analysis was found to be -45.38 km. This implies that the NLM RES microgrid would be more economical and optimal for the unelectrified areas of Ntabankulu, but also up to 45.38 km in areas away from Ntabankulu. However, most unelectrified areas in Ntabankulu are 103–494 km from grid. At such distances, the cost of grid extension would likely far exceed the cost of proposed standalone RES microgrid. The distance from Ntabankulu to Mount Ayliff where a substation is being constructed is 494 km. There is also a proposed sub-station at Macwhereni, but the minimum distance between Macwhereni and most of the other unelectrified villages in Ntabankulu is above 150km.Due to heavy backlog of households without access to electricity in NLM and the challenges facing grid extension to NLM, the Department of Minerals and Energy (DME), South Africa supplied some households in NLM with roof-top solar panels as stated in [9].In 2006, [35] reported that the capital cost for grid electrification per household in South Africa was R6,000 ($518.58) to R7,000 ($605.01), compared with R4,000 ($345.72) cost of PV installations per household. By 2011, average grid connection cost per household had risen to around R12,000 ($1,037.17) according to [8]. The extremely high grid connection cost for rural areas due to absence of transmission lines and its spatial heterogeneity further makes grid extension highly uneconomical. The increasing cost of grid connection compared to decreasing cost of renewable DERs in the market further makes a better case for rural electrification through RES off-grid microgrid.
5.3. Microgrid Design Cost Summary
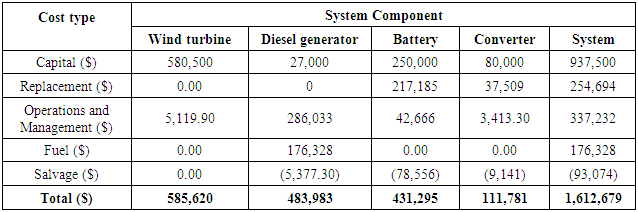
- The total NPC of each component in the optimal system design is shown in Figure 10. The costs considered include capital costs, installation cost, equipment cost, financing costs, and management cost [23, 24, 36]. The chart in Figure 10 shows that purchase of wind turbine for the system has the highest NPC of about $585,620, while the component with least NPC is the converter with a total amount of $111,781.
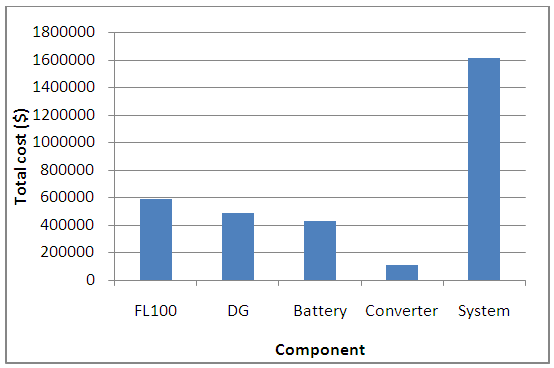 | Figure 10. NLM microgrid system Net Present Cost |
|
5.4. CO2 Emissions and Renewables Share
- The microgrid for Ntabankulu is supplied primarily by wind renewable energy source with about 90.5% and supplemented by the diesel generator to take care of the additional heating load in the cold months (March – August) as shown in Figure 8. The CO2 emission per person in Ntabankulu by this Microgrid design would be 0.219 kg/person compared to the general average of 8.9 kg/person in South Africa from grid emission as presented by [37]. Also, this microgrid yields 0.0057 kg/kWh CO2 emission compared to 0.99 kg/kWh, on average from grid emission even as available in [33, 38].
5.5. Caveats and Future Work
- Although the results are robust to a doubling of load, the economics of grid versus microgrid may change with a longer term view of load growth. Grid power, in principle, would be better able to handle very large load increases. The long-term feasibility of off-grid depends on other factors such as availability of repair facilities, availability of maintenance personnel, communal influences, insurance, security, land cost etc., which were not considered in this study. This could be further studied. Other issues not considered in this paper may also influence the choice of utility grid extension or microgrid, some related to cost and system operation, and other institutional issues that affect policy choices. The high cost of the battery could be reduced if generation and demand can be matched in real or near real time. Smart grid technologies that can accomplish this will lead to lower cost of electricity in microgrids. Local production of renewable energy technology equipment and accessories, for example, solar panels, wind turbines and batteries, could result in lower capital costs. Future simulation work can include other renewable energy sources such as biomass and micro-hydropower to enable a wider choice of microgrid configurations, conditional on resource availability. Energy plan for rural areas can be implemented faster through microgrid than grid extension. If local communities are involved in the microgrid development, it could also offer local commerce. Also, this microgrid will lead to more increased commercial activities as small businesses will spring up and consequentially lead to a better socio-economic life for the Ntabankulu residents.Finally, this study focuses on the supply side, and does not consider subsidies and other policies that affect consumers and whose feasibility may differ under the choice of grid versus microgrid. The provider of this microgrid could be the DME, local authority or an Independent Power Producer (IPP). The provider gets the profit, and takes responsibility for technical and non-technical losses of the microgrid and may contract the payments control and management to metering companies. The authors in (White and Koopman, 2011) also reported that such provider would also benefit in reduced tax and subsidy from the government.
6. Conclusions
- This study has shown that for an unelectrified locality like Ntabankulu on the Eastern Cape of South Africa, a stand-alone microgrid seems cost effective than grid extension. The optimal system configuration includes a hybrid of wind turbine, diesel generator and batteries. The levelized cost of energy for such a system would be $0.320/kWh compared to $0.544/kWh if the area is to be connected to the grid. Due to the use of renewables, the system would result in a safer environment with CO2 emission of 0.219 kg/person compared to the general average of 8.9 kg/person CO2 emissions from grid electricity in South Africa. The results are robust to uncertainties in resource availability, component cost and some load growth. The study suggests that microgrids merit serious consideration, at least on techno-economic grounds, as an electrification option for off-the-grid unelectrified villages in South Africa and other developing countries of the world. RES microgrid also has certain environmental benefits as it will contribute to reduction in pollution from wood burning and preservation of the forests. Also, the RES microgrid would reduce some health and safety risks associated with the use of wood, paraffin and candles for lighting, heating and cooking.