-
Paper Information
- Paper Submission
-
Journal Information
- About This Journal
- Editorial Board
- Current Issue
- Archive
- Author Guidelines
- Contact Us
International Journal of Energy Engineering
p-ISSN: 2163-1891 e-ISSN: 2163-1905
2017; 7(2): 51-54
doi:10.5923/j.ijee.20170702.02

A New Land Modeling and Application that can be Used in Wind Energy Potential Determination
 Abstract
 Reference
 Full-Text PDF
 Full-text HTML
Telat Turkyilmaz1, Mehmet Kurban2
1Department of Machine, Bilecik Seyh Edebali University, Bilecik, Turkey
2Department of Electric Electronics Engineering, Bilecik Seyh Edebali University, Bilecik, Turkey
Correspondence to: Telat Turkyilmaz, Department of Machine, Bilecik Seyh Edebali University, Bilecik, Turkey.
| Email: |  |
Copyright © 2017 Scientific & Academic Publishing. All Rights Reserved.
This work is licensed under the Creative Commons Attribution International License (CC BY).
http://creativecommons.org/licenses/by/4.0/

The determination of the wind energy potential for a selected region is crucial in the decision to establish eficient wind systems. The surface roughness of the land, the obstacles in the active wind direction and the surface structure of the land are of great importance in determining the potential of wind energy. Wind speed measurements are made from one or more locations. A contour line map of the land is prepared to find the position where the wind energy is most efficient. The WASP software is used to determine for the most wind energy efficient locations investment, using the terrain model and the wind speeds measured from a specific location. In this study, land modelling will be done for a selected region with a software assisted approach. It is aimed that the obtained land model can be used in wind energy evaluation software.
Keywords: Land modelling, Wind energy, Wind energy assessment, Wasp
Cite this paper: Telat Turkyilmaz, Mehmet Kurban, A New Land Modeling and Application that can be Used in Wind Energy Potential Determination, International Journal of Energy Engineering, Vol. 7 No. 2, 2017, pp. 51-54. doi: 10.5923/j.ijee.20170702.02.
Article Outline
1. Introduction
- The world's energy needs are increasing day by day while limited fossil energy sources are declining. For this reason, the search for new sources of energy has emerged in the world. Demand for wind energy, which is one of the renewable and sustainable energy sources, is increasing day by day because non-economical energy investments cause limited investment resources to be wasted. If wind energy investments are made, sustainable energy can be produced for many years. Assessment of the wind energy potential of the region is crucial so that an efficient energy system can be established from the wind, which is a clean energy source that does not pollute the environment. From the point of view of regional analysis, firstly, the potential of wind energy should be determined. At least 12 month wind speeds are recorded for this. If it is possible, wind velocities are tried to be taken at the hub height of the wind turbine to be installed. When more than one wind turbine is desired to be installed, active wind direction and land structure are of great importance.
2. Wind Power
- The amount of heat that increases the temperature of a material by 1°C is called specific heat. Because of the different specific heat of the materials, the energy taken from the sun is emerging as different temperatures in the land, sea or atmosphere. Different temperatures cause pressure differences and pressure differences cause winds. In this way, air flows from the high-pressure regions toward the low-pressure regions, that is, the wind [7]. Wind power; is calculated by the Formula. Wind power potential is proportional to the cube of the wind speed and the density of the air [6].
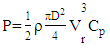 | (1) |
3. Determination of Wind Energy Potential
- The potential of wind energy and time-dependent change should be examined in order to make efficient energy potential of wind energy investments. For this purpose, the Weibull distribution, which is considered to be suitable for wind characteristics, is used [2].
3.1. Land Modeling
- Wind velocities from one or more positions of the selected region, need to be calculated at different points and at different heights. For this purpose, the contour modeling is required to evaluate the land.
3.2. Region Selection and Land Modeling Application
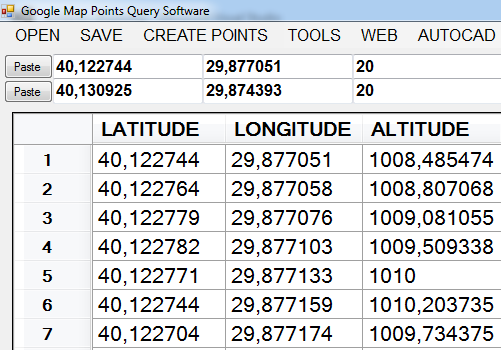
- A region was selected in the village of Ulupinar, Bilecik province. The network has a close and open area, which has played an important role in the selection of the region. Latitude 40.122744, Longitude 29.877051 a peak at an altitude of 1008 meters was selected as the starting point. The point was chosen as the lower border zone with a latitude of 40.130925, a longitude of 29.874393 and an altitude of 977 meters. It is tried to calculate the wind speeds in different locations in the area by taking the wind data from high and low altitude points.
3.3. Creation of Land Model
- The starting point with the highest altitude and the lowest point with the lowest altitude were selected in the village of Ulupinar, Bilecik. This area was selected in order to make terrain modeling and examine the potential of wind energy since this area exposed to the wind and the altitude is high.With the software developed in Microsoft Visual Studio-Visual Basic environment, the angular points in the spiral form are produced as Figure 1. The latitudes and longitudes of the points are created by equalizing the arc tongues. The operating principle of the software is based on a spiral model principle which is formed by gradual increase of Radius and Angle values.
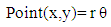 | (2) |
 | Figure 1. Spiral Point Dotting Software 1 |
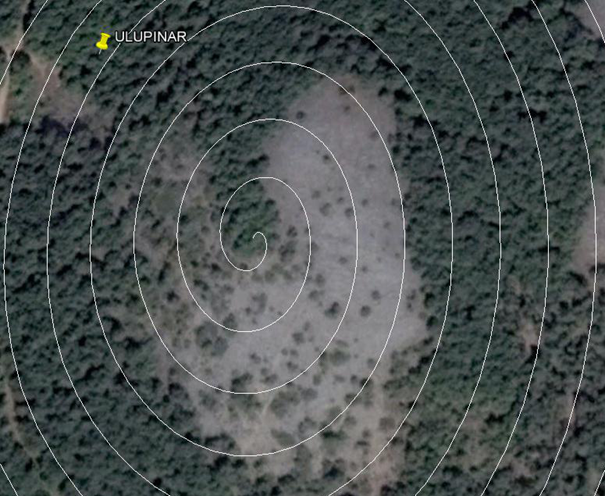 | Figure 2. Ulupınar (appearance of points) |
3.4. Conversion of Angular Landmarks to Linear Coordinate System
- UTM (Universal Transverse Mercator) based on the cylindrical Transverse Mercator projection. Thus, the latitude and longitude information in the angular form is transformed into a three-dimensional linear form. The coordinates obtained are saved in XYZ format. A software has been developed to convert angular points into UTM format. The conversion of hundreds of angular points to the new form is done automatically by the developed software [4].
3.5. Finding Contour Line by Using Landmarks
- In order to be able to use the wind information created in the spiral view in wind software such as Wasp, it is necessary to convert the contour lines to point groups firstly. Autocad Civil 3d software is used for this purpose. The order of operation is given for the creation of contour lines using x, y and z point information in spiral form.•Switch to Autocad Civil 3d view,•HOME-SURFACE-CREATE SURFACE,•STYLE MATERIAL=COUNTER 2m AND 10m,•RENDER MATERIAL=COUNTER 2m AND 10m,•MODIFY-SURFACE-ADD DATA-POINT FILES,•Select the file in XYZ format and press the OK button,•COUNTERS appear on the screen,•Obtain blocks by exploding with EXPLODE,•Obtain LWPOLYLINE by exploding with EXPLODE •Save in DXF format or use Autolisp program developed for creating counter file,•Open Dxf file by using the MAP11 editor,•Save in MAP format,•MAP file opens with developed software,•Saved in KML format,•The Google Earth program opens the KML file and displays counter lines.After the operations are completed, the contour lines are created in the environment of Autocad Civil 3d software as Figure 3.
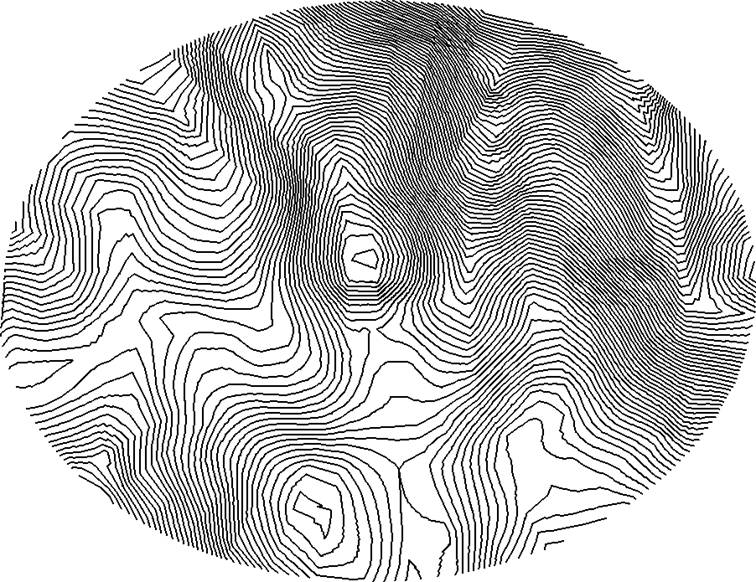 | Figure 3. Contour Lines in the Autocad Civil 3d |
3.6. Autolisp
- The Autolisp programming language has been developed by Autodesk to enable graphical layouts and drawings to be used in AutoCAD environment [1]. Using all Autocad commands in all versions of Autocad, Autolisp programming language can be used in text format or in encrypted format.The program, which can interfere with the colors of contour line drawings in Autocad environment and rewrite the Autolisp software on optional conditions, has been developed. In order to make the contour lines understandable with this language, height-based coloring software has been developed in AutoCAD environment. Thus, the coloring of the contour clines of different regions can be performed automatically. Different areas of different heights can be colored optional.Many lines are easily colored depending on their altitude using Autolisp software prepared in this study as seen in Figure 4.
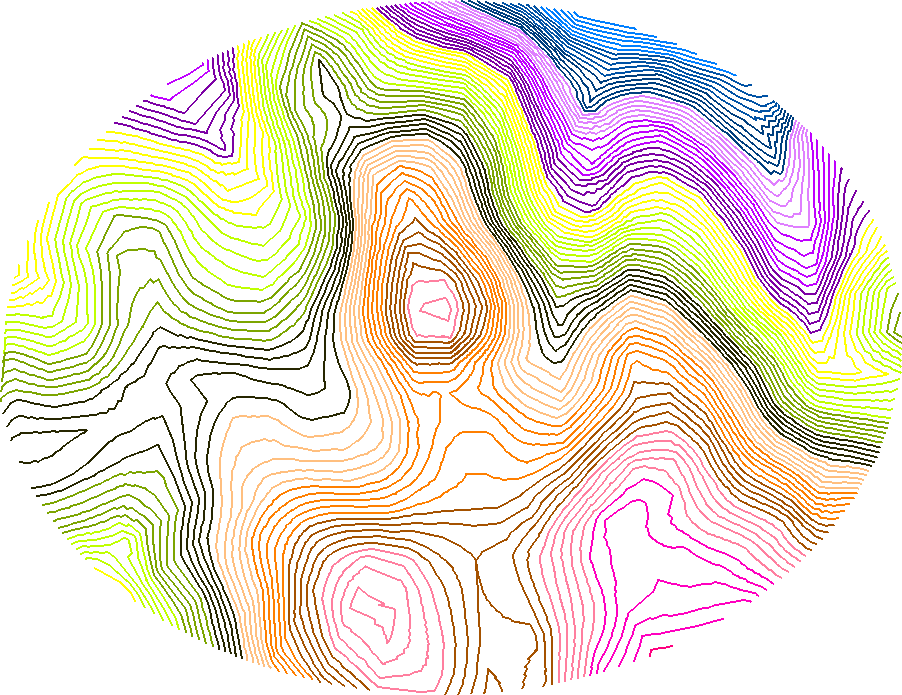 | Figure 4. Coloring with Autolisp Software in the Autocad Civil 3d |
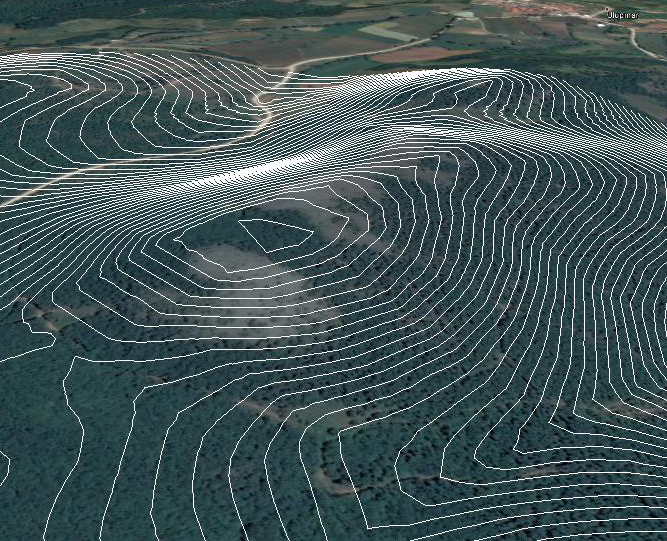 | Figure 5. Contour Lines in the Google Earth |
4. Conclusions
- It is very important that wind energy investments are economical and efficient. Expenditures should be recoverable within a period of 5-8 years. For this purpose, wind energy potential determination studies are carried out for a selected region. For the wind energy investment cost calculation, the distance of the working land to the grid lines, the physical structure, and the appropriateness of the energy investment are examined.When the wind energy potential is determined, it is of great importance to measure the position and core height of the wind turbine, which is planned to install. The turbine or turbines to be selected depending on the energy required and the wind energy potential of the zone are not known in advance. So wind speeds are measured from one or more points. By using measurements made at limited locations and heights, and using wind energy performance calculation programs such as Wasp, the most productive locations and heights are found. Wind turbines are chosen according to this data.Wind energy software uses contour line model of a selected region. In this study; Latitude and longitude were created for spiral-looking angular points starting from the peak via the prepared software. Altitude values of these points are taken from google's internet database.In the method used in this work; Spiral-shaped terrain points created in XYZ format have been converted into UTM system via the prepared software. The points converted to UTM system are used in Autocad Civil 3D program to create contour curves. Data related to the contour lines generated in the Autocad environment were saved to the file with the Autolisp software prepared in the scope of the study.Another important part of the work is that the map information in this file can be saved in MAP format so that it can be used in the Wasp program. Wasp software can calculate the most suitable positions and heights of Wind Energy by using MAP-formatted terrain information and measured wind speeds.In summary, a software has been developed for the preparation of the contour line model of land that is used to determine the potential of wind energy. This software demonstrates how to create a terrain modelling by using Google Earth and Autocad Civil 3d programs. It can also query points needed for the region selected from internet. It is expected that this study will contribute to the creation of land models used in wind energy performance analyzes.