E. C. Merem1, Y. Twumasi1, J. Wesley1, P. Isokpehi1, M. Shenge1, S. Fageir1, M. Crisler1, C. Romorno1, A. Hines2, G. Hirse2, S. Ochai3, S. Leggett3, E. Nwagboso4
1Department of Urban and Regional Planning, Jackson State University, USA
2Department of Public Policy and administration, Jackson State University, USA
3Department of Health Policy and Management, Jackson State University, USA
4Department of Political Science, Jackson State University, USA
Correspondence to: E. C. Merem, Department of Urban and Regional Planning, Jackson State University, USA.
| Email: |  |
Copyright © 2017 Scientific & Academic Publishing. All Rights Reserved.
This work is licensed under the Creative Commons Attribution International License (CC BY).
http://creativecommons.org/licenses/by/4.0/

Abstract
In a globalizing world where development hinges on access to modern energy services, many regard renewables as catalysts for regional economic advancement. Yet, various parts of Africa lack access to modern energy services along with relevant spatial information tools to support decision making. It is also the only place in the globe where a major portion of the inhabitants stay without adequate electricity. Tracking renewable trends spatially remains the ideal way to improve access to energy services sustainably and efficiently as opposed to the other options. The matter is compounded by many limiting factors to energy security in West Africa such as poor system reliability, inadequate infrastructure and fuel import dependence. Seeing the positive linkage between energy access and growth, increasing access to renewable services through electricity and other services serves a vital purpose for the West African region. While identifying current developments in West Africa’s renewable energy sector remains essential in understanding its potential, attaining it requires improvements to current approaches to energy management through new knowledge and spatial analysis of energy undertakings using GIS. In that light, the projected development of renewable energy in the region cannot be attained without complete and reliable information calibrated in a GIS environment. Accordingly, this paper focuses on regional assessment of energy in West Africa with emphasis on the issues, trends, factors, impacts and efforts. Using a mix scale method of descriptive statistics and GIS, the results show that the region has untapped renewable energy potentials spread across many nations. This is followed by changes in a set of renewable energy categories that are germane to regional development due to socio-economic factors. GIS mapping of the trends also reveals gradual dispersal of energy security predictors clustered around many localities. For future lines of action, the paper suggests the need for effective policy, continual use of GIS and the design of a regional energy information system for West Africa.
Keywords:
West African region, Renewable energy, Energy security, GIS mapping, Assessment, Access
Cite this paper: E. C. Merem, Y. Twumasi, J. Wesley, P. Isokpehi, M. Shenge, S. Fageir, M. Crisler, C. Romorno, A. Hines, G. Hirse, S. Ochai, S. Leggett, E. Nwagboso, Regional Assessment of Energy Trends in West Africa Using GIS, International Journal of Energy Engineering, Vol. 7 No. 1, 2017, pp. 1-27. doi: 10.5923/j.ijee.20170701.01.
1. Introduction
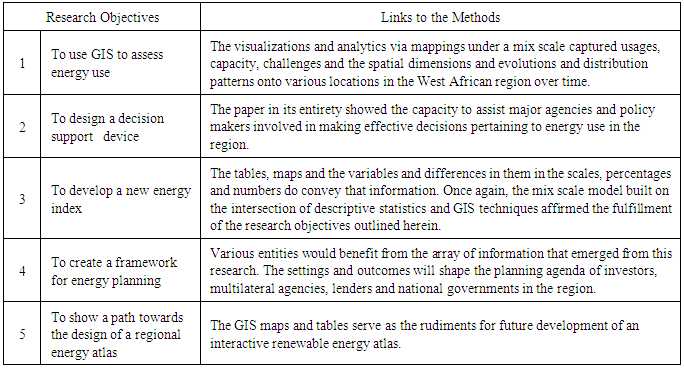
In the last several years, renewable energy potential saw substantial uptick amidst rising global energy use [1]. Considering the ample potentials across the region [2], projected electricity demand continues to rise in Nigeria and the rest of West Africa at an average yearly growth rate of 6% to 7%. With Nigeria vigorously developing its infrastructure in energy generation, power transmission, distribution and renewables, businesses and households and others in the country spend $21.9 billion annually to generate their own electricity. Accordingly, renewable energy development in West Africa is attracting increased consideration as financiers and decision makers seek a clean energy frontier. In the process, Africa may well emerge as a gold mine for renewable energy due to its abundant solar and wind resources [3-6]. As further evidence of the continent’s potential, it has been shown that Sub Saharan Africa could provide more than 170 Giga watts of additional power generation capacity. This would more than double the region’s current installations–through 3,200 low carbon energy projects, such as combined heat and power, biofuels production, mass transportation and energy efficiency. Together these projects could eliminate the emission of 740 million tons of carbon dioxide equivalents each year [3]. Additionally, the West African sub region has abundant renewable energy resources that could be harnessed to provide sustainable and industrial energy while at the same time helping mitigate climate change externalities [5, 7, 8]. As of early 2014, installed capacity of grid-connected non-hydro renewable energy provided 39 MW in grid-connected electricity in the region. While access to modern renewable energy in that way enables countries in the region to create better lives for the people through the lighting of streets to reduce crime and the provision of electricity to manufacture local goods, as well as cleaning and pumping of water throughout the countries [8, 9]. In a globalizing world where development hinges on access to modern energy services, many regard renewables as catalyst for the advancement of regional economies such as the ECOWAS which has emerged as a leading region in Africa for renewable energy and energy efficiency [10, 6]. Even with its potentials, the energy system of West Africa is facing serious interrelated challenges of energy access, energy security and climate change adaptation and mitigation [6, 11]. Just as the segment of people deprived of access to energy amenities has shown some declines in the face of rising population globally. Renewable sources of energy have been instrumental in that turnaround. These improvements do not seem uniformly distributed spatially. With many parts of Africa lacking access to modern energy services along with relevant spatial information tools to support decision making in the sector. It is the only place in the globe where significant percentage of the inhabitants still stay without adequate electricity. Also, the ECOWAS region ranks among the lowest in electricity access rates in the world with only about 4.2 percent of the population, and 8 percent of the rural residents having access to it. The result is that, the West African region faces challenges in energy delivery with more than half of its 359.3 million citizens living in rural areas where access to electricity ranges from 6-8%. This means more than 179.6 million people in the region stay with no access to reliable and affordable electricity [12]. During recent years, the ECOWAS region has been experiencing an energy crisis that is hampering social and economic development, and is affecting low-income population groups in particular [6]. In Ghana and Nigeria, manufacturing outlets struggle repeatedly with electricity outages and rising costs. While spatial tracking of renewable trends remains essential in the management of energy services under current constraints. The matter appears compounded by the fact that energy security in the ECOWAS region is endangered by many factors like inadequate tariffs, limited investment, poor system reliability, inadequate infrastructure and over dependence on fuel import [13]. Part of the problems stems from the little priority for energy efficiency in the face of huge untapped renewable energy potential coupled with ineffective policy and weak institutions and limited capacity linkages [14]. With these different barriers, the countries are unable to take advantage of their vast renewable energy and efficiency potentials. Such deficiency in energy services has effectively stunted development in the region where energy access is an important issue directly related to income and poverty. For that, improving electricity access, supply and reliability has become an indispensable prerequisite for enhancing economic activity and improving human quality of life. Nevertheless, the ECOWAS region has abundant potential for renewable energy which if harnessed can address the energy shortage and provide sustainable and industrial energy. Seeing the positive linkage between energy access and development, increasing access to modern energy services made up of electricity and others, serves a vital purpose for the West African region. In response, the ECOWAS has taken actions to adopt and implement a regional energy efficiency policy [15]. With exception of a few studies and an exploratory outline of the hydro power potentials by the ECOWAS energy unit and the collection of a large amount of geospatial data by the ECREEE [16, 17], very little has been done in the literature using GIS to analyze the energy profile of the West African region. All in all, GIS as an analytical and methodological tool has found valuable use in the assessment of natural resource use and research design [18-24]. See Appendix 1 for more on GIS. This paper will fill that void by focusing on a regional assessment of energy trends in West Africa with emphasis on the issues, trends, factors, impacts and efforts. Accordingly, the study has five objectives. The first aim focuses on the use of GIS (geospatial technology) to assess energy use, while the second objective is to design a decision support device. The third aim emphasizes the development of novel energy index. The fourth objective is to create a framework for energy planning. The fifth objective is to show a path towards the design of regional energy atlas. The paper is divided into five parts. The first part presents the introduction, while part two describes methods and materials. Part three highlights the results, and the fourth portion covers the discussion with GIS mappings, the factors and efforts put in place. Part five provides the conclusion and the research findings. For more on the links between the study objectives and the methods, see Appendix 2 for a brief summary.
2. Methods and Materials
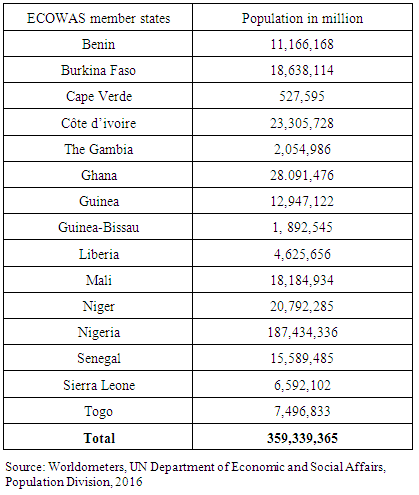
The study area West Africa (Figure 1) situated in the Sub Saharan African region consists of 15 member nations of the Economic Community of West Africa States (ECOWAS). The countries range from Cape Verde, Gambia, Ghana, Liberia, and Mali to Nigeria. With a population of more than 359 million as shown in Table 1, the region accounts for just about one-third of sub-Saharan Africa’s entire population on a land area measuring 5,112,903 km2 under a diverse ecosystem where dominant conditions vary from desert to tropical rainforests [25]. The West African region hydrology is dominated by the river Niger which drains the vast majority of the area. Several of the region’s river paths contain catchments and dams to form reservoirs, such as the Senegal basin, the Niger basin, the Volta basin, and the Chad basin that are essential sources of renewable energy supply [25, 26]. Given such potential for renewable energy, an estimated 23,000 MW of hydroelectric potential is concentrated in 5 of 15 member states of which only about 16 percent has been exploited [12]. The West African region not only boosts of small hydro power potential which amounts to around 6,000MW. There are huge wind, tidal ocean, thermal and wave energy resources available in some of the countries along with vast solar energy potential powered by very high radiation averages of 5 to 6 kwh/m2 throughout the year [12].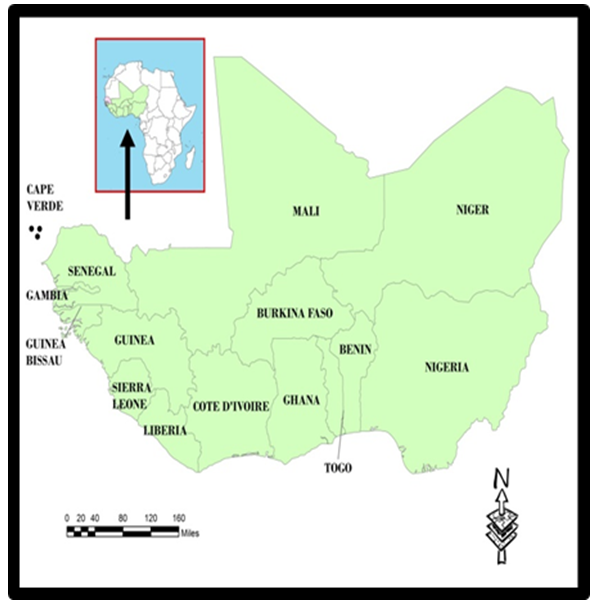 | Figure 1. The Study Area of West Africa |
Table 1. Population of the Study Area in 2016
 |
| |
|
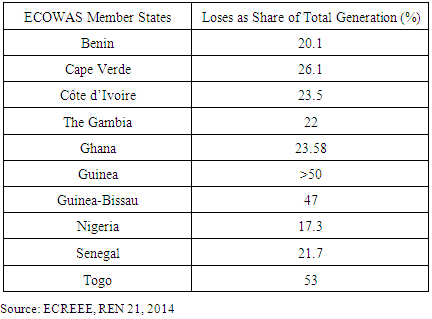
Just as the landscapes and climate are varied, so are the challenges to overcome the population lack of access to sustainable energy. Most ECOWAS nations have some of the lowest levels of per capita energy consumption in the world. On average, the ECOWAS countries consume 88 kWh of electricity yearly compared to a world average per person of 2,400 kWh [13]. For that, the region is not only confronted with the realities of energy vulnerability, fuel price volatility and system unreliability. Energy poverty and its consequences for local economies and social development are projected to remain the predominant challenges for West Africa through 2030. Accordingly, the West Africa region has one of the lowest energy consumption rates in the world where the poor spend most of their income on low quality energy services and the rural areas rely mainly on biomass to meet their energy needs. In the coming years, the rising energy demand partly driven by population growth of 2.5% per year, rapid urbanization, and economic development will call for urgent action to exploit the region’s vast energy resources. Comparing the energy intensity average of 14.5 MJ per US $ in the region to the continental average of 11 MJ per US$. There is considerable potential for improving energy efficiency in buildings, industries, appliances, power generation and transmission. Added to that, the rate of electricity network losses as share of power generated and a major problem reached over the 50 parentage mark in two of the countries (Togo and Guinea). Aside from the 47 percentage level of losses for Guinea-Bissau, Ghana, Côte d’Ivoire and Cape Verde experienced recurrent losses of over 23 percent (26.1- 23.8%) while Benin, the Gambia and Senegal averaged over 20% in losses compared to the 17.3% for Nigeria (Table 2). In the face of all the challenges, the ECOWAS region member states have initiated numerous projects and adopted renewable energy support policies with the implementation of at least one policy at the national level. For the good of effective decision making and better understanding of the trends, this must be analyzed to gauge the state of energy use regionally. With the void in prior research on the assessment of the state energy services in West Africa and the potentials of the region, the current study provides ample chance to analyze the trends from a temporal spatial perspective using GIS.Table 2. Electricity Network Losses in Selected ECOWAS Nations
 |
| |
|
2.1. Method Used
The paper uses a mix scale approach involving descriptive statistics and primary data connected to GIS to analyze energy trends in the West African region. The spatial information for the research was obtained from the International Energy Agency(IEA), the Economic Community of West African States (ECOWAS), ECOWAS Centre for Renewable Energy and Energy Efficiency (ECREEE) and the United Nations Industrial Development Organization (UNIDO). While the other sources consists of the US Department of Energy (DOE), the Energy Information Administration (EIA) and The United States Agency for International Development (USAID). The International Renewable Energy Agency (IRENA), the African Development Bank (ADB) and the United Nations Economic Commission for Africa (UNECA) and Renewable Energy Network (REN) 21 also provided some of the data. Overall, the bulk of the energy metrics on renewables and solar for the fifteen ECOWAS member nations came from ECREE and REN 21. The total energy including consumption, export, and electricity overview was obtained from the Energy Information Administration (EIA) for the period of 2013, while existing hydro and identified hydro projects, and estimates of other renewable energy potential for 2013 were from the International Renewable Energy Agency (IRENA). From there, the regional and federal geographic identifier codes of the nations were used to geo-code the information contained in the data sets. This information was processed and later analyzed with basic descriptive statistics and GIS with particular attention to the temporal-spatial trends at the national and regional level. The relevant procedures consist of two stages below.
2.2. Stage 1: Identification of Variables, Data Gathering and Study Design
The first step involves the identification of variables needed to assess energy trends and use in the fifteen nation states of the ECOWAS region. The variables consist of population, electricity access rates, population without access to electricity, electricity network losses, oil reserves and refinery output. The others include small-scale hydropower potential, installed hydropower electricity; total hydropower capacity, share of mw greater and less than, installed grid-connected solar PV capacity, sustainable energy access targets, number of energy projects, energy intensity, hydro capacity, and generation, estimates of other renewable energy potential, total energy and, electricity overview (consumption, generation, installed capacity). Additionally, access to databases that are available within the federal and state archives in the ECOWAS and other international agencies quickened the search process. The process continued with the design of data matrices for socio-economic, energy and environmental variables covering the periods from 2003, 2010, 2011, 2012, 2013 and 2014. The design of spatial data for the GIS analysis required the delineation of national boundary lines. With boundary lines unchanged, a common geographic identifier code was assigned to each of the units to ensure analytical coherency.
2.3. Stage 2: Step 2: Data Analysis and GIS Mapping
In the second stage, descriptive statistics and spatial analysis were employed to transform the original socio-economic and energy data into relative measures (percentages/ratios). This process generated the parameters for measuring the potentials, power generation, consumption patterns, energy production, installed capacity, usage levels and the trends associated with energy distribution. This was facilitated by measurements and comparisons of the trends over time. While this approach helps track the levels of use, the tables highlight potentials, number of installations, the rates and percentages. The remaining steps cover spatial analysis and output (maps-tables-text) covering the study periods, using Arc GIS 10.4 and SPSS 20.0 The spatial units of analysis consist of nation states, region and the boundary and locations where energy including renewable types and components such as electricity power and others are active. The geographic data for West Africa which covered its boundaries, also includes ecological data of land cover files, and paper and digital maps from 2003-2014. The outputs of the spatial data were mapped and compared to see the dispersion of the trends, usage, production, and the socio-economic factors shaping the pace of energy delivery in the study area. With energy info and census data becoming available in electronic format and with GIS software now being easily accessible, the ability to conduct advanced spatial analysis on energy trends is now enhanced for decision-making. See Appendix 3-4 for the steps involved in the data analysis under a mix-scale and the benefits of GIS tool.
3. Results
This portion presents the results of the descriptive statistics on temporal trends and spatial analysis of energy use with GIS. There is an opening focus on the analysis of energy production, electricity synopsis with access rates, and network losses, distribution of hydro, potentials and installed capacity, other renewable energy potentials and solar. This is followed by GIS mapping and spatial analysis and the socio-economic factors influencing energy insecurity. The current effort of agencies towards access in various countries of the study area sums up the analysis.
3.1. Total Energy Production Including Fossil Fuel 2003 and 2014
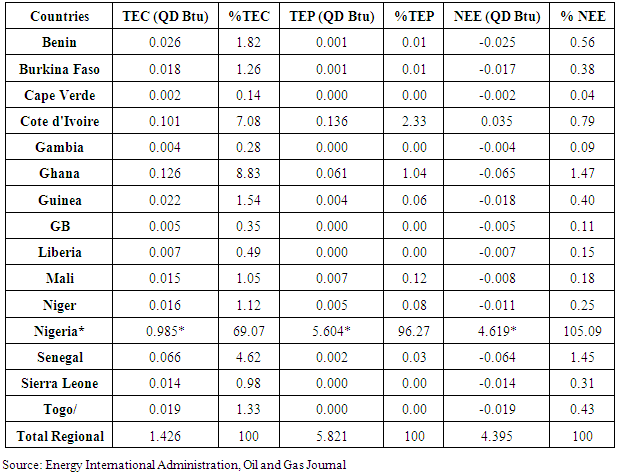
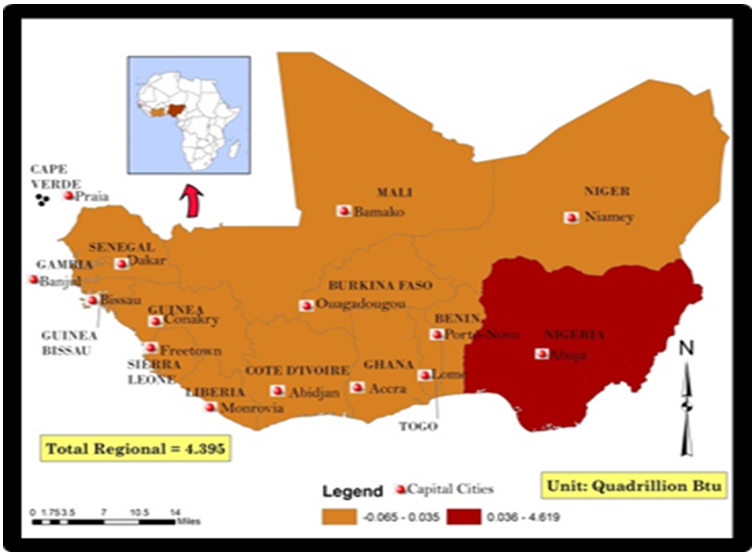
In the 2003 fiscal year, the ECOWAS region posted quite a substantial volume in total energy consumption and production as well as net export. The tallies covered about 1.426- 5.821 and 4.395 quadrillion BTU in net export. The volumes in total energy trends shows Nigeria over took the rest of the region in every category with 0.985-5.604 and 4.619 quadrillion BTU in energy consumption, production and export. Further along these lines in 2003, energy trends involving use, production and export reached lower levels in the other nations when compared to Nigeria. This is further buttressed by the percentage equivalence indicating Nigeria accounted for 69.7-96.27 and 105.09% in every category. This also implies Nigeria holds more than 100% of energy exports in the ECOWAS region (Table 3). Table 3. Total Energy Use, Output, and Export, 2003
 |
| |
|
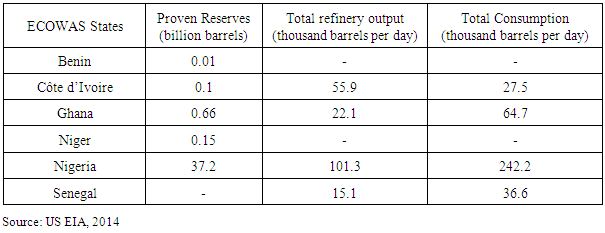
Considering that power stations in the region, depend on fossil fuel it came as no surprise that in 2014, Nigeria again as a leading producer and the largest country of the union, outpaced others in every statistical category from proven reserves, total output to consumption. Nigeria not only had more proven reserves of 37.2 billion barrels than the others combined, the proven reserves level (0.66, 0.01, 0.1, and 0.15) in Ghana, Niger and Côte d’Ivoire pales substantially in comparison to Nigeria. The same holds for output and consumption volumes of 101.3- 242.2 thousand barrels per day for Nigeria versus the ECOWAS countries listed on Table 4. Of great importance in the region are the trends in Côte d’Ivoire, Ghana and Senegal where refinery output and consumption stood at 55.9-27.5, 22.1-64.7 and 15.1-36.6 barrels daily (Table 4).Table 4. Oil Reserves, Refinery Output, and Consumption, 2014
 |
| |
|
3.2. Electricity Synopsis, Access Rates and Network Losses
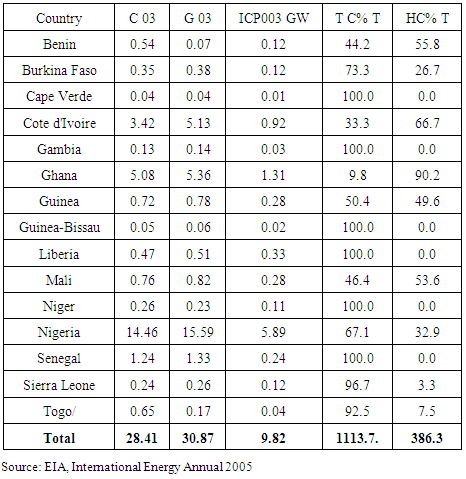
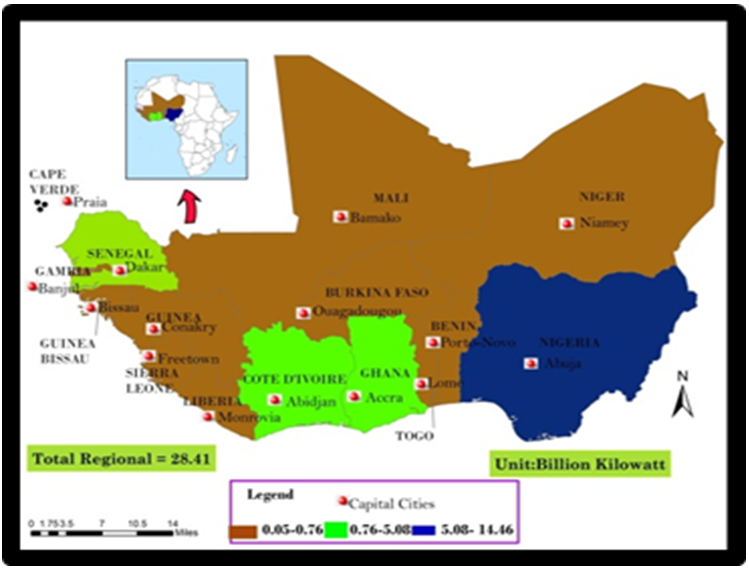
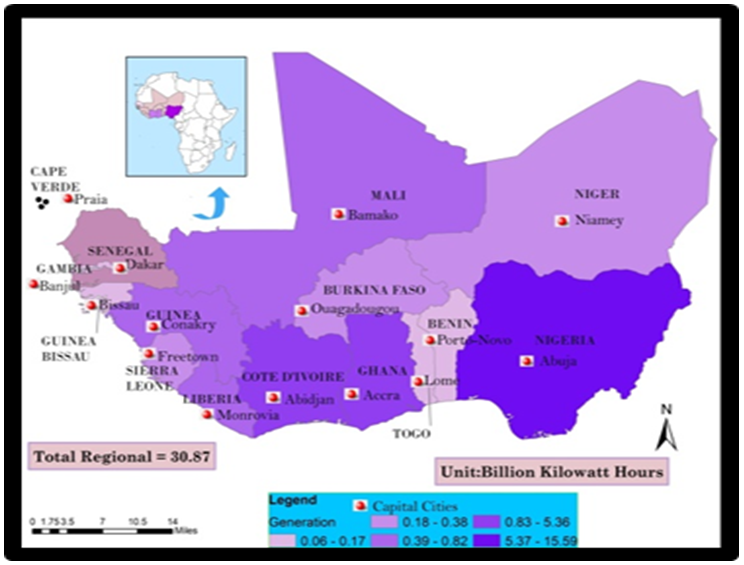
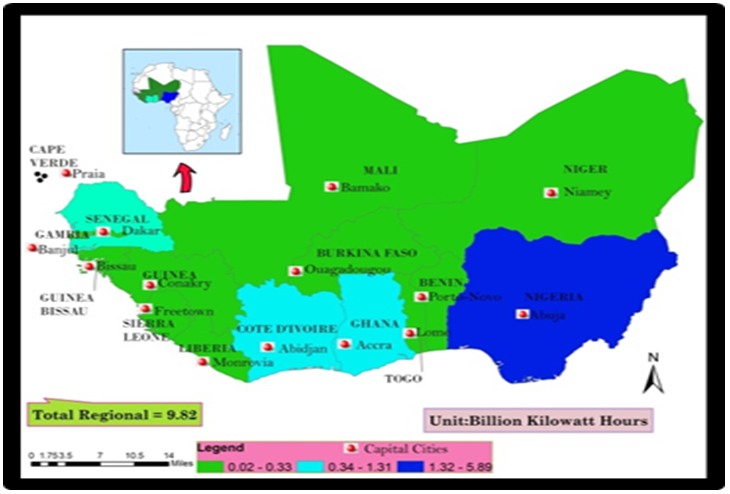
The electricity overview in the region in 2003 covers such indicators as consumption, generation installed, thermal and hydroelectric capacity. Judging from the use patterns among the countries, Nigeria appears to have a much bigger share of the volume in electricity power generated and installed volumes. However, the remaining columns highlighting both thermal and hydroelectric capacity percent of the totals point to several variations. During that year, when the ECOWAS had combined totals of 28.41-30.87 and 9.82 Billion KWh in consumption, generation and installed capacity in electricity, Nigeria accounted for 14.46-15.59 and 5.89 Billion KWh of that. The volumes for Nigeria under the three indicators exceeded those for Ghana and Cote d'Ivoire at 5.08 -3.42 and 0.92-1.31KWh. With regional averages of 74.2-25.75 percent in thermal and hydroelectricity capacity totals, five smaller countries (Cape Verde, Gambia, Guinea-Bissau, Liberia and Senegal, Sierra Leone and Togo) maintained thermal capacity of 100-90+%, a level higher than the 73.3-67.1% for Burkina Faso and Nigeria. From the table, the hydroelectricity percent of the total for Ghana stood at 90.2 % more than the others. Cote d'Ivoire, Benin and Mali followed up with 66.7-50+ while Guinea and Nigeria finished at 49.6-32.9% respectively (Table 5).Table 5. Electricity Overview, Billion Kilowatt hours, 2003
 |
| |
|
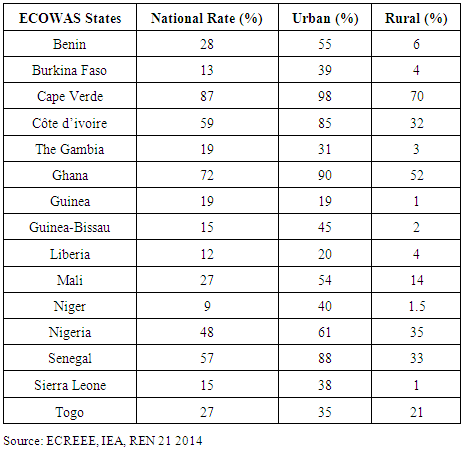
The electricity access rates among ECOWAS nations highlights three essential categories at the national, urban and rural level. Between 2010 through 2011, two countries (Cape Verde and Ghana), did stand out in every classification of electricity access rates among the 15 ECOWAS nations at levels in excess of the 50 percent mark. From the data breakdown, amongst the various states, electricity access in Cape Verde and Ghana at 87 to 72% exceeded those of the many nations in the region. This was followed by a trio of others (Côte d’Ivoire, Senegal and Nigeria) where the national access rates were at mid-levels (of 59-57 and 48) percentage points. Aside from the group of other states (Benin, Mali, Togo, the Gambia, and Guinea) that saw access rates in the low double digits of 28, 27, 19 percent, Burkina Faso, Guinea-Bissau, Liberia and Sierra Leone had electricity access levels of 13, 12, 15, percent at the national level. Compared to the others, Niger posted the lowest access rates of 9 percent during the period (Table 6). Table 6. Electricity Access Rates in ECOWAS states, 2010-2011
 |
| |
|
With the penetration rates of electricity into urban areas overwhelmingly at high levels of 98 – 90 and 85 -88 percent for four nations (Cape Verde, Ghana, Senegal, and Côte d’Ivoire), the cross border nations of Nigeria, Benin, Mali and Niger as well as Guinea-Bissau posted a fairly moderate to medium percentage levels (61, 55 to 54 and 40). The other group of countries where urban electricity access stood firm at under forty percentage points (38 to 19) consists of Burkina Faso, the Gambia, Guinea, Liberia, Sierra Leone and Togo. The level of rural access once again reaffirms the dominance of two countries Cape Verde and Ghana at 70 to 52 while the trio of other nations Nigeria, Senegal and Côte d’Ivoire maintained rural access levels estimated at over the thirty percent range (35, 33 and 32). In the remaining areas across the region, the rates of urban access were insignificant. From the analysis, it is clear that urban electricity access in the region exceeds both the national and rural rates (Table 6).
3.3. The Distribution of Small Hydro Potential, Hydropower Installed Capacity and Hydro Generation
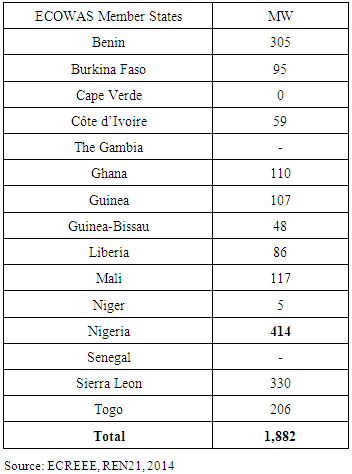
The distribution of small scale hydro potential among the member nations (estimated at 1,882 MW total) shows Nigeria accounts for the highest level of hydro power with a load of 414 MW. Three other coastal nations of Benin Sierra Leone and Togo followed up with moderate power loads valued at 330 MW, 305 MW and 206 MW. Among the next tier of countries, Ghana, Guinea, and Mali showed significant hydro capability in the order of 110 to 107 MW and 117 MW. Notwithstanding the zero potentials for three other nations (Cape Verde, the Gambia and Senegal), the next four (Burkina Faso, Liberia, Guinea-Bissau and Côte d’Ivoire) had a much smaller capability worth 95- 59 MW to 48 -86 MW (Table 7).Table 7. Estimate of Small-Scale Hydropower Potential
 |
| |
|
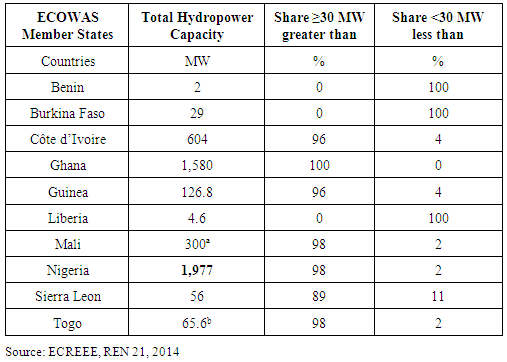
In the region, the hydro power installed capacity classifications in 2014 reflects an even spilt (of 5) between those with installed capacity numbering in the thousands and hundreds and the others below. As a result, the installed capacity figures points to five countries (Nigeria, Ghana, Côte d’Ivoire, Mali and Guinea) with capacities in the thousands and hundreds of high to medium levels coupled with those below (such as Benin, Liberia, Sierra lone, Togo and Burkina Faso). Within the same period, the individual allocation in total installed hydro power electricity capacity shows Nigeria with the highest power load of 1,977 MW and closely followed by Ghana at 1,580 MW. The other three nations (Côte d’Ivoire, Mali, and Guinea) also had significant to moderate levels of installed electric power capacity. These include the 604 MW for Côte d’Ivoire, 300 MW in Mali and 126.8 for Guinea. The lowest levels in five other countries are the 65.6-56 MW loads in Togo and Sierra Leone along with 29-4.6 and 2 MW mostly available in Burkina Faso, Liberia, and Benin republic. Additional attributes of installed hydro power capacity center around the percentage distribution of the respective shares of greater and lower than 30 MW among the 10 countries listed in table 8. Of the total installed hydro power capacity in 2014, about 100 percent of that in the greater than 30 MW categories was mostly in Ghana. Closer to that are the 98-96 percent share of hydro power classified as greater than 30 MW in Togo, Nigeria, Mali and the 98 percent for Sierra Leone while the percentage share for Benin, Burkina Faso, and Liberia stood at zero. In as much three (Benin, Burkina Faso and Liberia) out of nine countries operated installed capacity of less than 30 MW at 100%, the percentage level faded significantly from 0-11among the other nations in the region. That is different when compared to the distribution patterns under the ≥30 MW category as shown previously in the middle column of the table (Table 8).Table 8. Installed Hydropower Electricity in ECOWAS Member states, 2014
 |
| |
|
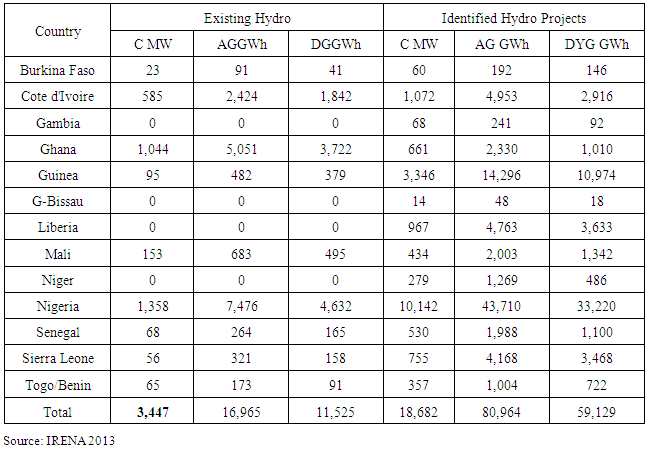
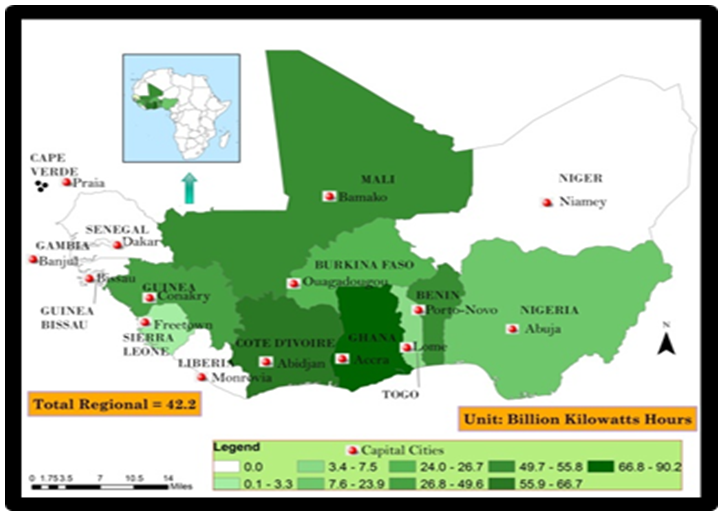
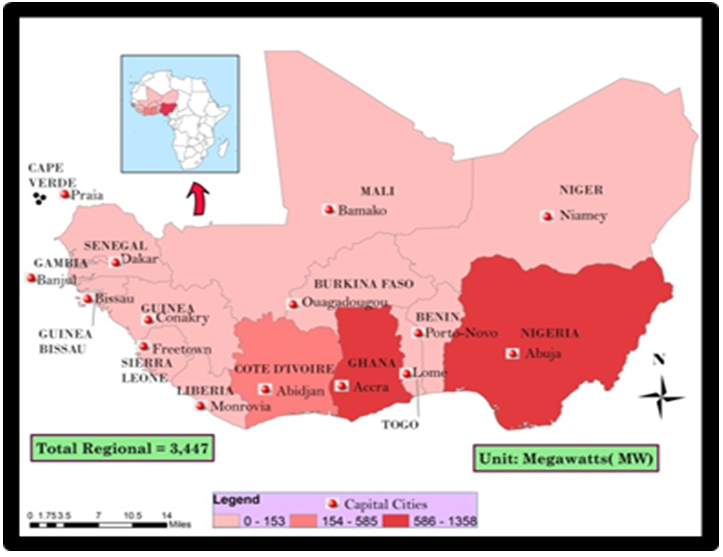
The hydro capacity among the countries of the ECOWAS region as a measure of energy use can be distinguished by existing hydro capacity, and average generation in the provision of power and dry year generation and identified projects under the three different categories. From the information on the table, the countries of Nigeria and Ghana and Guinea have more in terms of existing hydro capacity and identified projects when it comes to capacity and power generation volumes and average generation. The West African region as a whole has a total hydro capacity of 3,447 MW out of which 2,402 MW (70%) of that are heavily concentrated in two major countries (Nigeria and Ghana). The capacity distribution among the countries puts Nigeria ahead with 1,358 MW (39.3%) of the total and an additional 1,044 MW (30.28%) operating in Ghana while Cote d'Ivoire and Mali maintain a capacity of 585 MW to 153 MW. Among the others, the capacity for existing hydro for the neighboring countries from Burkina Faso to Togo and Benin faded significantly. The same pattern holds firm for existing hydro and identified projects, particularly power generation (average and dry generation). Under the regional totals in that category (of 16,965-11,525 GWh) for current programs, Ghana and Nigeria emerged with the highest volumes of generated power. Of these, Nigeria generated the equivalent of 7,476-4,632, Ghana accounted for 5,051-3,722GWh and Cote d'Ivoire, 2,424-1,842 GWh. This represents the percentage equivalence of 44.06-40.19 for Nigeria, 29.77%-32.29 in Ghana and 14.2-15.92 for Cote d'Ivoire. Turning to identified hydro projects made of total volumes of 18,682MW and 80,964- 59,129 for the ECOWAS region, once again, the capacity and load generated are overwhelmingly skewed towards Nigeria at 10,142 MW and 43,710-33,220 GWh at levels more than half the regional total. Elsewhere the growing power demands in Guinea resulted in notable surge of 3,346 MW in capacity and 14,296- 10,974 GWh in average and dry year generation. These strong demands surpassed the loads for other countries like Cote d'Ivoire and Liberia where the hydro capacity stood at 1,072 -967 MW of hydro along with 4,953-2,916 to 4,763 3,633. Ghana on the other hand, had about 661MW in capacity, generated power and dry year averages of 2,330-1,010 GWh (Table 9).Table 9. Existing Hydro, and Identified Projects in West Africa
 |
| |
|
3.4. Other Renewable Energy Potential and Solar Energy
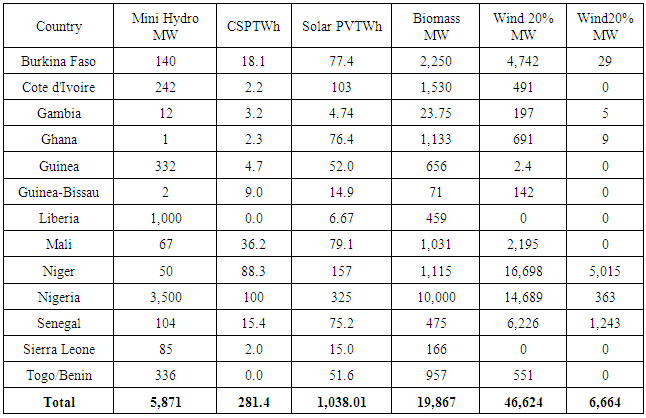
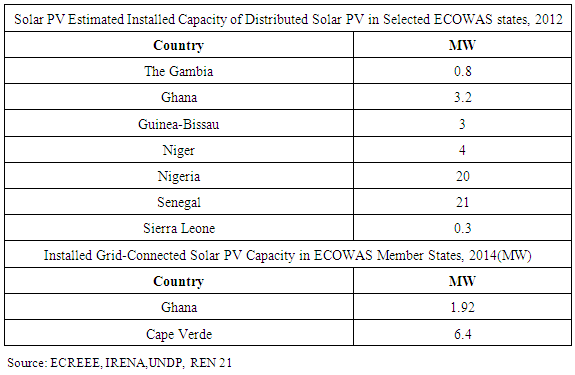
The estimates of other renewable energy potentials show a major dominance by Nigeria in the areas of mini hydro, CSP, solar power and biomass. Niger republic followed up with more abundance in wind energy in the 20% MW category. Overall, the region’s other renewable energy potentials consist of 5,871 MW in mini hydro, 281.4 CSP TWh coupled with 1,038.01 in solar PV TWh. The others include the 19,867 MW in biomass and wind capacity of 46,624 MW. Once more, Nigeria outpaces its neighbors in mini hydro capacity load of 3,500 MW alongside Liberia with 1000 MW. While the distribution of CSP and Solar PV reaffirms their increasing presence in Nigeria and Niger (with100-88.3 TWh and 325-157 MW, Nigeria’s biomass capacity of 10,000 MW is second to none in the region. Similarly, the wind energy generation potentials of 16,698 -14,689 MW among Niger and Nigeria also point to levels much higher than the other nations. The study area also saw some activities involving solar energy based on the PVs. From the table on installed capacity of distributed solar PV in 2012, Nigeria and Senegal outpaced every other country with 20-21 MW in installed volume of power. With the available installed capacity equivalence solidly firm at 3-4 MW for Ghana, Guinea-Bissau and Niger, the capacity of distributed solar PV for the Gambia and Sierra Leone remained at 0.3- 0.8 MW. The little presence of solar energy also involves installed grid connected solar PV capacity in Ghana and Cape Verde with power volumes of 1.92 to 6.4 MW (Table 10-11).Table 10. Estimates of other Renewable Energy Potential
 |
| |
|
Table 11. Other Renewables in the West African Region, 2012-2014
 |
| |
|
3.5. GIS Mapping and Spatial Analysis
With countries in the map differentiated in various shades, the emerging spatial patterns in total energy consumption and production during the 2003 period reflects common characteristics in the West African region among the countries. From the maps, the southern tip of the region off the Atlantic is characterized by a light presence and robust concentration of energy indicators spread across three countries. Nigeria on the southern flank of the region distinguished (in blood color or dark red, blue) in the lower right side in the Southeast, shows the highest concentration of all energy indicators alongside its two other neighbors (Ghana and Ivory coast) further on the Southwest, while the rest of the countries paled in comparison (Figures 2-3). Just as in the others, net energy export on the map seemed much more pronounced in Nigeria in dark red compared to insignificant spread all through the rest of the ECOWAS nations classified in dark orange (Figure 4). Even though electricity overview in 2003 highlighted heavy consumption, generation, installed and hydro capacity in Nigeria (in blue and light blue or purple) both Ghana and Ivory Coast and Senegal in light green emerged as sites of growing activities (Figure 5-7). In other words, a further look on the map in 2003 shows how the electricity consumption which began at high scale along the lower south of the region in Nigeria saw further spread onto Ghana and Ivory coast.The pattern continued towards Senegal in the South west area until it slowed in the upper north and pockets of other countries in the South west depicted in brown (Figure 5). Further along the lines, the same spatial distribution configuration emerges again with Nigeria ahead in the generation of electricity and installed capacity than the others (Figure 6-7). Of the mixed patterns in dark green to light spread across the region, note a visible concentration of more classes for percent of hydroelectricity capacity along the Atlantic areas in the lower south nations of Ghana, Ivory Coast and Benin. Taken together, came a slow spread towards inland into Mali along the upper northern portion and Burkina Faso in the North central. With time, the percentage distribution waned for Nigeria and Sierra Leone in the southern areas of the region identified in light green colors (Figure 8). While under existing hydro and identified projects, most of the indicators (capacity and average generation and dry year generation) in 2011 showed highest capacities in MW, MGW, GWh for Nigeria and Ghana in dark red to dark gray for current initiatives (Figures 9-11). The identified hydro projects components side of it under the same energy indicators reveal a robust geographic spread in Nigeria and a sudden diffusion towards Guinea in the South west (Figure 12).In the context of other renewables, while Nigeria maintained the highest presence of more mini hydro, solar capacity saw a large concentration mainly in Nigeria followed by Niger and a gradual spread clustered into a dozen other countries in medium and lower levels in both the northern and southern portions of the ECOWAS region. Aside from the gradual spread of biomass into the different portions of the region, Nigeria held the largest volumes. The classification of wind capacity under 20% MW shows some visible prominence in space for Niger and Nigeria, while Senegal and Mali and Burka Faso emerged ahead of the others in the lower south [Figure13-17]. Though the spatial analysis via mapping echoed the geographic spread of renewable energy indicators from electricity to solar energy and biomass over the years in the ECOWAS region. The procedures resulted in the visualization of energy trends depicting the distribution of usage, installed capacity, production, the actual power loads and hydro potentials in a GIS. With the desire for trans-boundary energy networks and the intercontinental dimensions now rife, the visualizations of the trends serve as the foundations for the proposed ECOWAS energy atlas and regional energy information system to boost energy security.In the context of other renewables, while Nigeria maintained the highest presence of more mini hydro, solar capacity saw a large concentration mainly in Nigeria followed by Niger and a gradual spread clustered into a dozen other countries in medium and lower levels in both the northern and southern portions of the ECOWAS region. Aside from the gradual spread of biomass into the different portions of the region, Nigeria held the largest volumes. The classification of wind capacity under 20% MW shows some visible prominence in space for Niger and Nigeria, while Senegal and Mali and Burka Faso emerged ahead of the others in the lower south [Figures 13-17]. Though the spatial analysis via mapping echoed the geographic spread of renewable energy indicators from electricity to solar energy and biomass over the years in the ECOWAS region. The procedures resulted in the visualization of energy trends depicting the distribution of usage, installed capacity, production, the actual power loads and hydro potentials in a GIS. With the desire for trans-boundary energy networks and the intercontinental dimensions now rife, the visualizations of the trends serve as the foundations for the proposed ECOWAS energy atlas and regional energy information system to boost energy security.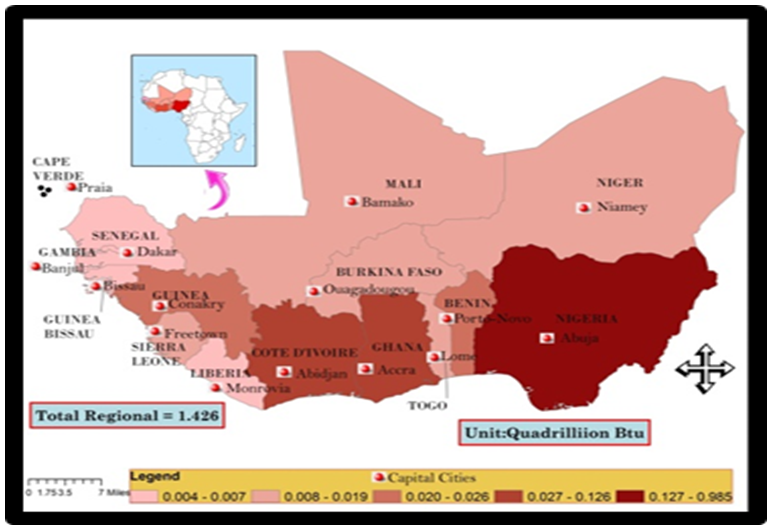 | Figure 2. Total Energy Consumption 2003. Source: EIA, IEA |
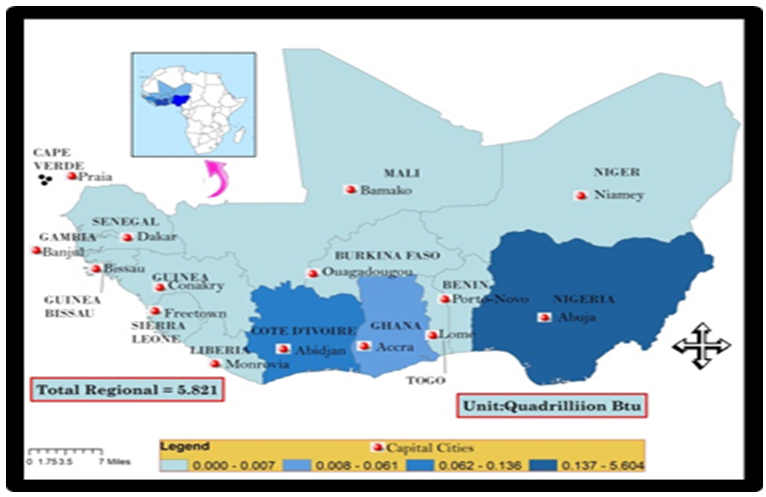 | Figure 3. Total Energy Production, 2003 EIA, IEA |
 | Figure 4. Net Energy Export, 2003 EIA, IEA |
 | Figure 5. Electricity Consumption, 2003 EIA, IEA |
 | Figure 6. Energy Generation 2003. Source EIA, IEA |
 | Figure 7. Installed Capacity 2003 EIA, IEA |
 | Figure 8. Hydroelectric Capacity % of total, 2003 EIA, IEA |
 | Figure 9. Existing Hydro –Capacity (MW) 2013, Source: IRENA |
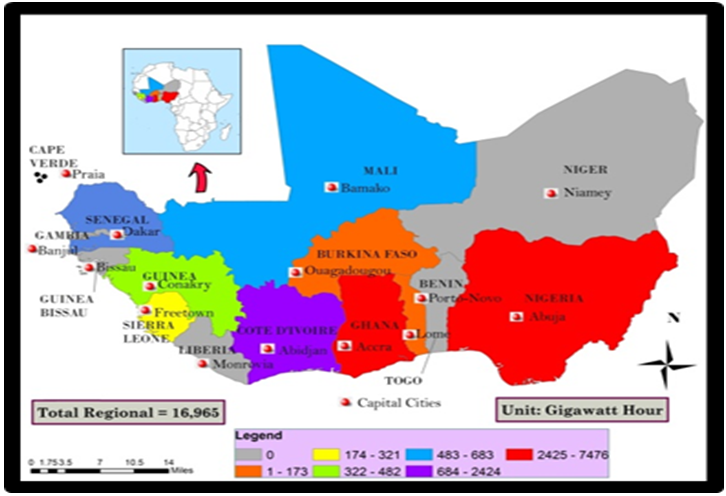 | Figure 10. Average Generation, 2013 Source: IRENA |
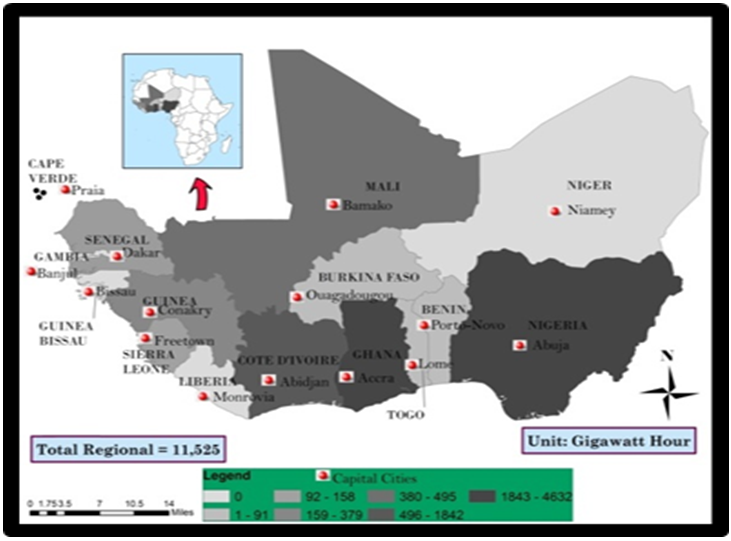 | Figure 11. Dry Year Generation 2013. Source: IRENA |
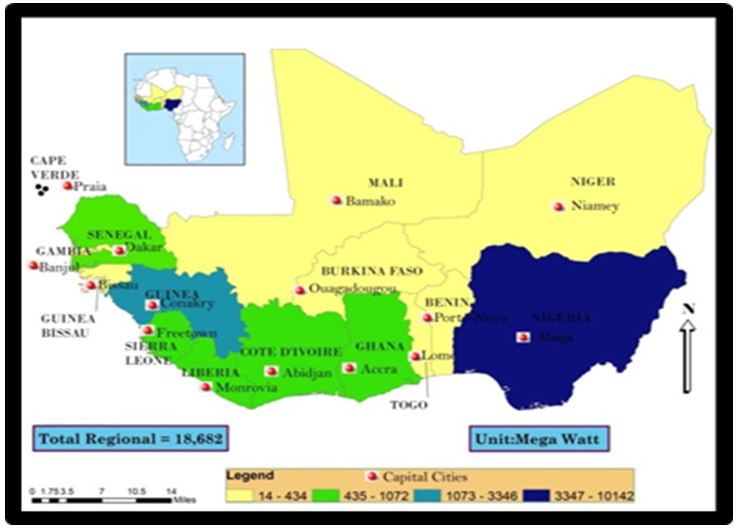 | Figure 12. Identified Hydro Projects: Capacity (MW) 2013. Source: IRENA |
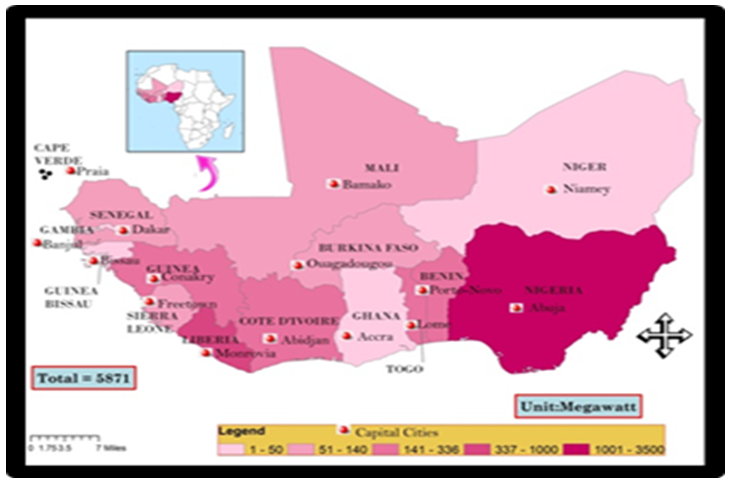 | Figure 13. Other Renewable Energy potential: Mini Hydro (MW), Source: ECREEE |
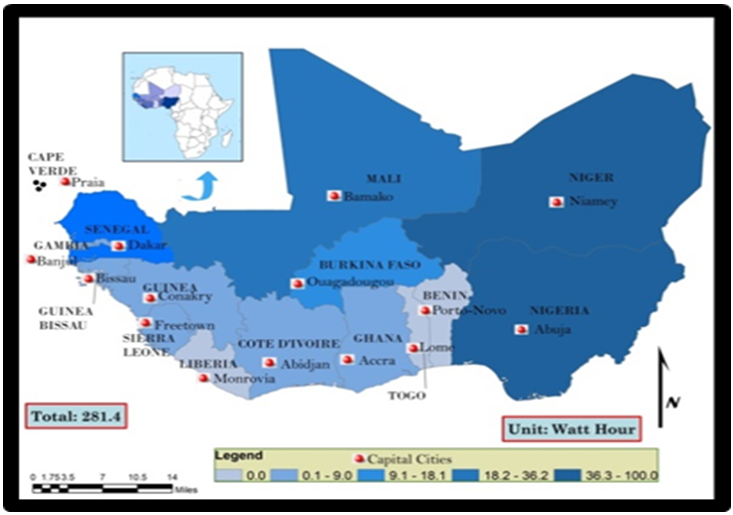 | Figure 14. The Distribution of CSP (TWh) In West Africa |
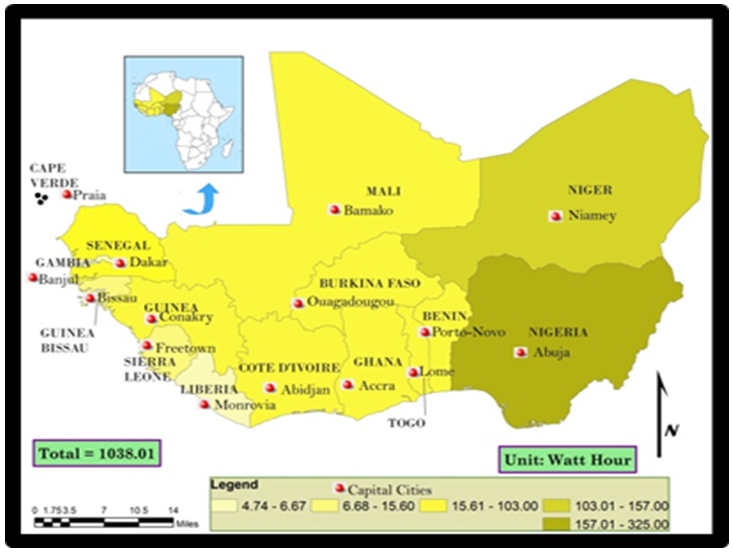 | Figure 15. The Distribution of Solar PV (TWh). Source: IRENA, UNDP, ECREE, REN 21 |
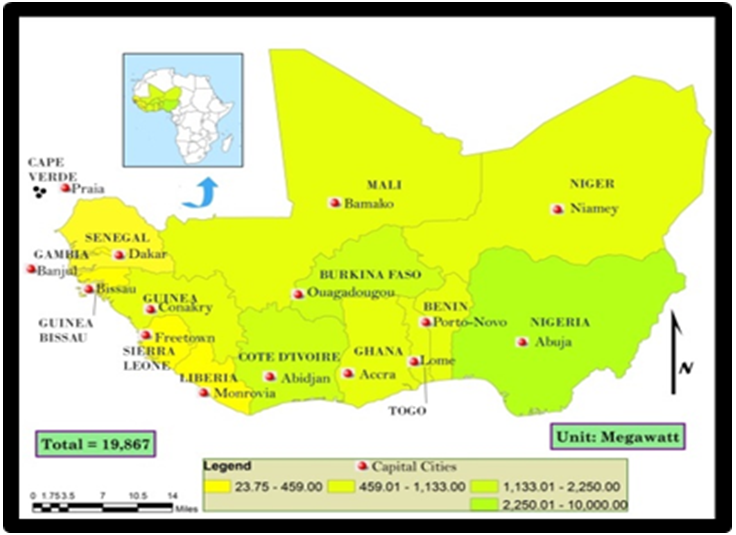 | Figure 16. Biomass (MW) Production Trends among the Nations Source: ECREEE |
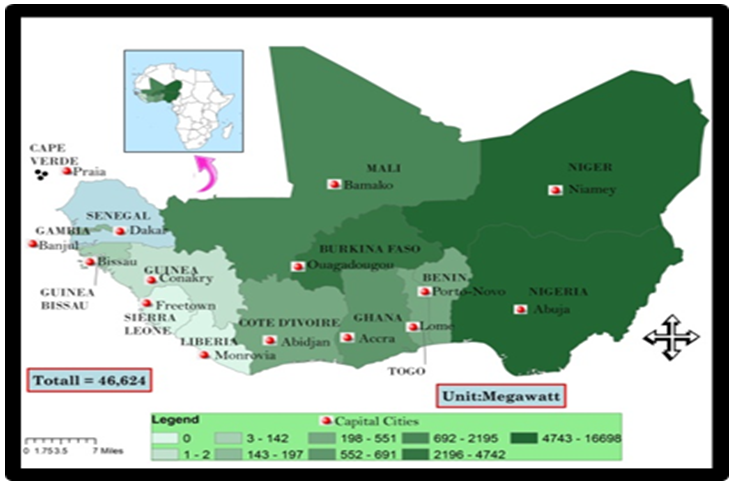 | Figure 17. The Potentials of Wind Energy 20% (MW) Source: ECREEE |
3.6. Factors Associated with Energy Insecurity and Efforts in West Africa
The current spate of energy insecurity in West Africa does not operate in a vacuum. It is attributed to a set of socio-economic factors made up of economy, demography, business environment, and governance. These elements are described briefly in this section of the paper one after the other.
3.6.1. Regional Economic Uncertainty
The economy of the ECOWAS region has grown over years with a GDP of US$ 1,322 billion of which Nigeria accounts for nearly 78 percent of the combined total. With the economy heavily concentrated in industry, transport, telecommunications, energy, agriculture, natural resources and commerce. The expectations of economic amalgamation remain always high among the regional block. Although recent valuations point to a regional economic block that has surpassed anticipations. That has not trickled down evenly in a region where several nations toil in fiscal uncertainty with difficulties to balance their annual budgets coupled with dependence on foreign donors and partners to finance energy projects. While the economies of these nations are still not fully robust to solely confront the critical energy challenges of the region, the dreams of accelerating the growth of energy infrastructure in the 21st century becomes a daunting task. Considering a general poverty rate of 44% in the ECOWAS, the per capita income levels among the nations, minus Cape Verde, reflects the threshold of less developed and low income nations where many languish in absolute poverty compared to other areas of the world. Among the countries in the region where energy export proceeds are an essential source of government revenues, the sector lags heavily behind in job creation and contributions to the overall economy. Unlike the petroleum industry where oil companies unilaterally initiate the design of refineries on their own, it is very exorbitant to do so in the renewable energy sector when it comes to power and utility infrastructure. Many of the West Africa’s economies are also countries fraught by weak policies and structures and too much red tape that impede the development of the energy sector. Under those circumstances, it comes as no surprise as to why the region ranks among the lowest in terms of access rates in which many stay without electricity. These constraints do shape access and renewable energy issues in the region [27].
3.6.2. Changing Demography
Over the past 45 years, the number of inhabitants in West Africa increased from 262 million in 2005 to a total of 374 million in 2016 representing 40% of the total population of Sub-Saharan Africa. While three of the member nations, Nigeria, Ghana and Côte d’Ivoire account for two-thirds of the population of the sub-region. The population growth rate of the sub-region, appraised at 2.65% per annum stands as the highest in the world. With this growth rate, the population of ECOWAS at almost 400 million has resulted in a situation whereby the urban population tally of 43% in 2005 reached 50% in 2016. The temporal spatial assessment of the situation over a lengthy time indicates that, till now, much of the movement mostly occur along coastal zones, due to the planting of cash crops, and port suburbanization and growing ecological stress in the arid environments of the region. Such patterns of migration puts enormous strain on resources, and capacity of cities already pushed beyond their limits, and struggling to meet the demands of rapidly growing population in need of basic necessities, and life support infrastructure, that are limited by inadequate energy supply. Given experts’ projection that electricity usage in the region among member states will surge by 5% yearly through the next two decades. In the face of growing population, the demographic changes happening in West Africa impacts the energy sector where only one in three citizens presently has access to electricity. The growing pace of population and the projected rates for the coming years in a region known for deplorable conditions in energy infrastructure complicates the mission to realize contemporary energy access. Overlooking these impediments does mask the severity of the challenges of energy security in West Africa where demography remains part of the issue.
3.6.3. Unreliable Energy Infrastructure
The deplorable state of energy infrastructure constitutes major challenge for energy access in West Africa. Since the middle of 2006 when high demands from emerging markets in the region drove up the need for power surge, the West African region has been encountering severe scarcity of electricity. The non-materialization of funding for new generation capacity along with transmission and supply systems was compounded further when plans to expand the power generation fuel range and grid dependability met obstacles. Once regional initiatives like the West African Gas Pipeline (WAGP) and West African Power Pool (WAPP) floundered, the proposed building of pipelines and gas delivery routes were then deferred. Additionally, low points of water in dams like Akosombo in Ghana and glitches in gas delivery to power plants in Nigeria further shortened power generation volume in the region. This in turn led to recurrent impediments in supply. On that experience, companies in the region repeatedly mention insufficient electricity distribution as a limitation hindering their operational efficiency. Being a common issue that is encountered among the nations, inadequate and substandard power delivery not only impedes the output of West African economies, but it does constitute energy poverty. In fact, yearly average rate of 4.9% of sales declines are attributed to power interruption in the region, with very high level of losses reported in Nigeria. Even using back-up generator in those circumstances to alleviate inadequate power delivery drives up expenses among companies. In the fiscal year 2012, the price of gas for back-up power supply (for industry and domestic uses) reached about $5 billion [27]. In such an environment devoid of functioning infrastructure, energy security becomes elusive for the private sector and domestic household consumers denied of steady services. The same experience goes for small businesses that are often exposed to endless losses and unable to thrive in those circumstances. This does turn off any potential investors willing to commit to the sector.
3.6.4. Poor Structures of Governance
In the new energy frontier in which the region is becoming a player, the essential elements crucial for West African nations to attain security and fulfill their development aspirations centers around the formation of efficient modes of governance. However, the many known failings in governance in the region and the recurrent nature over the years do not help matters. They consist of unethical tendencies, poor regulatory structures, weak institutions and lack of transparency. While these assumptions do not hold in all nations, the regional index tracking practices and predictors of governance in West Africa tells of some progress and huge gaps within the region since 2000. Even though worries pertaining to bad governance are not confined to West Africa, such flaws are often cited by companies as a barrier for anyone willing to commit money to any initiative in the region. This remains a key problem within the energy sector since it must draw interests from a huge pool of ventures to oversee big monetary streams. For many natural resource investors, the inability to address these concerns does undermine existing resource-led development in the energy sector. Several nations in West Africa showed some headway in improving energy sector governance, but achievement in quite number of areas remains incomplete. Some growing numbers of West African nations are carrying out ongoing power sector restructurings, the ones in Nigeria serve as a noteworthy instance but outages persist. In the spirit of effective governance requiring compliance in various West African nations in accordance with stipulations laid out by the Extractive Industries Transparency Initiative (EITI). Many multinationals in recent years have been under huge scrutiny from their home countries to adhere to ethics rules so as to ensure that they are not working in collusion with perpetrators of unlawful corporate practices in West Africa. The absence of such ethical rules for investors and host nations hinders energy security for the citizens of West Africa [27].
3.7. Efforts through Different Projects among the Countries
Notwithstanding the factors impeding energy security in the region, several initiatives have been put into place among the countries with target deadlines and long range plans to meet the current energy needs of communities in West Africa and the near future. For more on the efforts of different agencies and actors to improve access based on the commission and implementation of ongoing energy projects see Appendix 5.
4. Discussion
Based on the foregoing analysis, the ECOWAS region as an emerging frontier of energy has abundant deposits of renewable potential spread across multiplicity of states. These potentials as a measure of consumption, generation installed, thermal and hydroelectric capacity and power generated are evident with mini hydro, solar power and biomass and electricity generation. If these services are efficiently harnessed, they can play an important role in addressing the challenges of renewable energy access and power shortage among the countries. With much of the energy deposits still underutilized, the Western African region has an estimated 23,000 MW of hydroelectric potential concentrated in some member states, coupled with additional small hydro power load estimated at around 6,000MW. There are also considerable wind, tidal ocean, thermal and wave energy resources available in some ECOWAS countries sustained by vast solar energy potential with very elevated radiation mean of 5 to 6 kwh/m2 year round. In all that, the ECOWAS region has one of the lowest energy consumption rates in the world where the poor spend most of their income on low quality energy services and the rural areas rely mainly on biomass to meet their energy needs. This makes energy infrastructure design, efficiency and distribution a priority. The mix scale approach (of descriptive statistics and GIS) highlighted linkages between various socio-economic and physical elements and the growing use of renewable energy in the fifteen member nations of the West African region. Added to that, the area saw the emergence of visible spatial patterns consistent with current use. Just as GIS mapping showed spatial concentration of energy use from installed capacity to solar and hydroelectric generation. The evolving spatial patterns which held steady in Nigeria, and some areas like Ghana and Ivory coast, and others followed by occasional variation, offered some clue on the state and future of the sector, as a new frontier in production, consumption, energy capacity and other alternatives including wind, solar, biomass and wind power in West Africa. With much of the percentage equivalence indicating Nigeria accounted for 69.7-96.27 in energy consumption and production, and more than 100% of net energy exports in 2003. There is considerable opportunity to redirect attention towards energy potentials in other nations where electricity access rates in Cape Verde and Ghana’s at 87 to 72 % in 2010 to 2011 exceeded everyone in the region. Even with the distribution of small scale hydro potential of which Nigeria led all with a sizable load of 414 MW. The trio of other coastal nations of Benin and Sierra Leone and Togo followed up with moderate power volumes while the next tier of countries, Ghana, Guinea, and Mali showed significant hydro capability estimated at hundreds of megawatts. This holds promise in the march towards improved infrastructure and security vital in the containment of energy poverty. While hydro power installed capacity in 2014 showed five countries (Nigeria, Ghana, Côte d’Ivoire, Mali and Guinea) in dominance with loads estimated in the thousands and hundreds at high to medium levels. The group of nations with power volumes under that threshold such as Benin, Liberia, Sierra lone, Togo and Burkina Faso also saw activities relative to their sizes. The individual allocation in 2014 of total installed hydro power shows Nigeria with the highest power load of 1,977 MW and closely followed by Ghana at 1,580 MW. The available estimate of other renewable energy potentials shows a major dominance by Nigeria in the areas of mini hydro, CSP, solar power and biomass. Niger held on to more abundance in wind energy of about 20% MW. The region’s other renewable energy potentials consist of 5,871 MW in Mini Hydro, 281.4 CSP TWh coupled with 1,038.01 in solar PV TWh along with 19,867 in Biomass MW and wind capacity of 20% MW of 46,624. Once again, Nigeria outpaced its neighbors in mini hydro capacity measured at 3,500 MW alongside Liberia with 1000 MW. While the distribution of CSP and Solar PV does reaffirm their increasing prevalence in Nigeria and Niger Republic (with100- 88.3 TWh and 325-157 MW), Nigeria’s heaps of biomass collection worth 10,000 MW of power stood out as second to none in the region. In an era in which many investors and governments are demanding clean energy frontiers in the face of climate change threats and its linkages to poverty and degradation, the recourse to alternative energy from solar to wind is quite significant in the region. Pertaining to the factors, the current level of energy insecurity and poverty in West Africa does not occur in isolation. It is liked to a host of socio-economic factors such as economy, demography, business environment, and governance. Being a region where majority of the nations are saddled by economic depression and weak institutions under ineffective policies and structures. The power sectors suffer from unreliable and dilapidated infrastructure; compounded by the demands of changing demographics in which high population growth rates impede development of the energy sector. Under those circumstances, it comes as no surprise that West Africa ranks very low in access rates where many stay without electricity. These constraints do shape the renewable energy issues in the region. With the inherent potentials and the constraints involving energy poverty and security, the paper offered suggestions ranging from the strengthening of current policies to the design of regional energy information system to sustain decision making and the continual use of GIS in the process. Others include the need for infrastructure design, efficient use, and the design of a regional energy atlas.
5. Conclusions
This research stressed the state of renewable energy use in the Sub Saharan region of West Africa with several revealing findings: a) abundance of renewable energy potentials evident in West Africa; b) limited access to energy still a major challenge; c) numerous energy projects currently underway to improve supply; d) mix-scale approach very effective in showing the spatial dimensions of renewable energy trends using GIS; d) the region has low and high energy producing states; e) the state of energy use and trends associated with several elements. Showing the abundance of vast energy potentials in the West African region in a way not seen before did set the research apart from others. Essentially, the huge pool of untapped energy resources in the region as shown in the study comes with vast benefits expected to uplift citizens and improve their wellbeing. Despite the challenges associated with access and the fact that the area uses less energy than others, there are opportunities to unlock the hidden potentials of various forms of energy in the region. As a result, the West African region seems to have emerged as leading area in renewable energy sources in Africa. From such potential, in 2014, installed capacity of grid-connected non-hydro renewable energy not only provided 39 MW grid-connected loads, but about 23,000 MW of hydroelectric energy potential were stretched across the area. Also, one need not look further again than the region’s total in hydro capacity of 3,447 MW out of which 2,402 MW (70%) are operational in Nigeria and Ghana followed by a capacity of 585 MW-153 MW for Cote d'Ivoire and Mali to grasp the energy abundance. Also, the current estimates of other renewable energy potentials points to increasing dominance by Nigeria in mini hydro, CSP, solar power and biomass coupled with significant loads of wind energy in Niger. The compilation of energy indices in this study is not only a critical assessment tool in policy that informs the ability of managers to gauge the state of renewable resource use and operations. It offers opportunities in the design of novel systems for crafting renewable energy index and atlas. This makes communities and the sector more cognizant of the trends and the need to embrace best practices for attaining energy access and security. Making the public aware of these profiles and potentials in this way creates a platform for showcasing current understanding of renewable energy potentials and the importance in public policy. Considering the robust profile and the fact that the region has gradually emerged as a new frontier in renewable energy, ample opportunity exists for investors to harness and optimize the region’s energy deposits through sustainable and efficient use necessary in the upliftment of communities across the West African region.For tracking the major challenges of limited energy access, the study left no one in doubt that energy security is critical and central in the lives of many citizens of West Africa. Identifying these issues herein stands as a major step forward in elevating it and providing a vital cause dear to many a framework in the arena of public policy. To understand that, one needs to note that despite the abundance in renewable energy, limited access remains a major challenge in West Africa. Considering how the energy systems of the region consistently encounter repeated outages, citizens face recurrent deprivations of access to modern energy services such as regular electricity. In a region where only 4.2-8.0 % of the population and those in rural areas have electric power supply, the study area ranks lower than other places in electricity access rates in the globe. Because of that, in recent years the region has experienced energy crunch which is hindering social and economic development and impacting communities at the margin. In that light, the situation is fraught with energy scarcity, system unreliability and fuel cost uncertainty in which citizens use the least amount of energy and electricity per person than other people in the globe. Stressing such challenges in this study provides the impetus for energy security for those citizens trapped in their daily misery through human suffering and deprivations synonymous with recurrent power outages in hospitals, in the West African region. Therefore, the analysis herein did insert the problems of energy security and limited access into the forefront of regional enquiry and policy. In the absence of such analysis, very little would have been known about acute energy poverty facing the region based on the extent of deprivations and the way they influence the quality of life of citizens. With the research emphasis on renewable energy trends, the result as presented herein will not only shape how policy makers in the ECOWAS region formulate strategies pertinent to energy security, but it would be of immense assistance as the countries grapple with the wellbeing of citizens in the 21st century.The study showed a vast array of synchronized energy projects as key to improved access in the coming years for the region. With the scale of energy challenges experienced among the countries and the importance of renewables as catalyst for energy access and security in development, the region has attracted numerous projects. These efforts came out of regional energy planning endeavours with set aside periods, aims and implementation steps for fulfilling them in the furtherance of electricity access, the use of modern fuels and clean cook stoves. As a result, close to eight nations did set aside the 2015 fiscal year as the projected period for electricity access. While the nations of Cape Verde and Ghana had set targets of 100 to 80% for 2015. Further along these lines, only Burkina Faso and Niger had a 60-66% target level followed by Mali, Benin and Côte d’Ivoire with 55 plus-50% electricity access targets for 2015. Aside from all these initiatives, several multilateral agencies including the USAID are partnering with countries in West Africa to increase the number of people with access to power. Considering the state of renewable energy sources in West Africa over the years, public knowledge of the commissioning and implementation of these projects and the involvement of multilateral donors as we have seen in the research reaffirms the significance of such ventures as a complement to existing energy inventory of the nations. Additionally, the proposed energy plans slated in the individual states remains a major boost to the region’s emergence as new frontier of energy. Outlining the future direction of energy programs necessary in the development of the communities holds promise towards improved access and security for underserved areas with no electricity and recurrent outages. Echoing these potentials in renewables to the benefit of communities epitomizes novel way of conveying emergent energy sources. This is essential in that it attracts investors with the promotion of West African localities as sites for future development efforts and improved access under a new framework. The applications of mix scale method as investigative device did stand out. Utilizing descriptive statistics and GIS as operational tools added more insight to the regional assessment of renewable energy trends. The model was quite effective in defining the study area and identifying the trends, coupled with the compilation of information on the factors and host of variables from hydroelectric generation to biomass. With the analysis pointing to visible concentration in areas with growing usage over the years, this method remains essential in serving the needs of scholars studying spatial dimensions of renewable energy trends in West Africa. As a result, GIS as a management tool remained quite valuable in pinpointing the dispersion of renewable energy variables and the pace and extent of their evolution across space. This benefit represents a significant stride towards effective planning and improvement in current policy which has not fully noticed these potentials. From the study, West Africa experienced visible patterns of changes in the use and spatial concentration of renewable energy trends from 2003 to 2014. While these patterns are indicative of the continual evolution of energy trends, their emergence could not have happened without the role of many factors. From the mappings, variables located within the larger renewable energy sector showed patterns consistent with recurrent usage over the years. The capability of GIS in pinpointing the patterns of usage and infrastructure presence and potentials over the years is quite essential given the role of West Africa as the new energy frontier in the continent and its significance in the growth of the region. Pinpointing these potentials enhances the capability of decision makers and agencies in prioritizing renewable energy as a vital component of policy. In that light, the model provides opportunity for showcasing the potentials of renewables often overlooked in the policy arena. Thus, the practical applications of a mix scale approach involving GIS mapping of energy use as a tool, improves our understanding of the state of the industry in the literature. It is also vital in the design of energy index and atlas. This sharpens decision making abilities and knowledge for managers involved in the framing of future debates and requirements of the energy sector in West Africa. The current renewable energy trends in the West African region as shown in this research does not operate in a vacuum, they are associated with several socio-economic, political and physical elements located within the larger energy structure. While this study echoed the significance of a host of socio-economic factors in the region’s renewable energy sources, it also shows the extent to which basic necessities from health, economy and infrastructure, and others are predicated on the renewable energy industry. In as much as functional political domain affords West African nations opportunities to meeting their development goals. The study revealed the importance of continual stability in the structures of governance where participatory democracy and equal opportunities for all reign supreme. In the absence of democratic governance as manifested in the past decades, uncertainty not only creeps in at the expense of energy infrastructure development, but its festers corrupt practices and weak state institutions unlikely to attract serious investors. With the nations lacking stable financial capital for addressing energy challenges of the region, the thoughts of access becomes a challenge. This is compounded by widespread poverty rate and growing population in places where demographic pressures impede the capacity of nations to provide basic life support in the face of scarce energy services. Highlighting these inter-linkages given their omission in the literature, did inject factors located within the larger renewable energy sector into the locus of debates on energy resources and security in West Africa. Without such analysis herein, grasping the influence of renewables and host of factors in the daily lives of citizens in the region would have been difficult. Having seen the socio-economic factors shaping renewable energy trends in the region, the research showed ways of identifying these components as conduits for improving our understanding of the potentials and challenges. Decision makers in that setting are afforded ample opportunity to evaluate these attributes across time by gauging their roles in energy security and access in the region. Taking into account the growing energy needs of the region, its rising potentials as the new frontier, and the challenges to energy security and what emerged from this study, policy makers and planners in the region would be tasked in the periods ahead to seek urgent responses to many pressing questions that are relevant to the future of renewable energy planning. The questions involve which challenges are to emerge from renewable supply? How would the effects of current efforts be measured? What scale will the geographic distribution of renewable power infrastructure assume in the area? What elements are likely to shape renewable energy use? Seeing the framing of these questions, there are ample probabilities from all of these for scholars and policy makers to redirect the strategy on regional trends. To that end, the paper offered suggestions ranging from the need for infrastructure design, efficient use to the design of a regional energy atlas.
Appendix 1
1. Introduction 1.1. Contd.With its capability to track the spatial dispersion of the production, use and impacts in energy resources from wind energy to oil and gas in other places [21, 22]. GIS systems can manipulate the relevant energy indicators such as wind and solar and others and provide estimates on the potentials for effective planning [23]. GIS as a valuable tool for understanding the region’s emergent renewable energy sector and development in such setting, remains essential for prospecting the resources and to grasping the potentials [24]. While such capability holds promise for the countries. Attaining it requires a better knowledge, spatial analysis of renewable energy undertakings and trends using GIS so as to improve current approaches to energy management. Considering the significance, expedited development of renewable energy services and efficient practices projected in the region cannot be attained without complete information calibrated in a GIS environment.
Appendix 2
1.2. Links between Objectives and Methods (Contd.)The paper has five objectives and efforts are made to herein to summarize the links between them and the methods of the research. There is no attempt to offer a full blown analysis because it is beyond the trajectory of the paper to do so. The linkages are provided on the table for clarity purposes.Appendix 2. The Links between Objectives of the Paper and the Methods
 |
| |
|
 | The Steps Involved in the Data Analysis under a Mix scale Approach |
Appendix 3
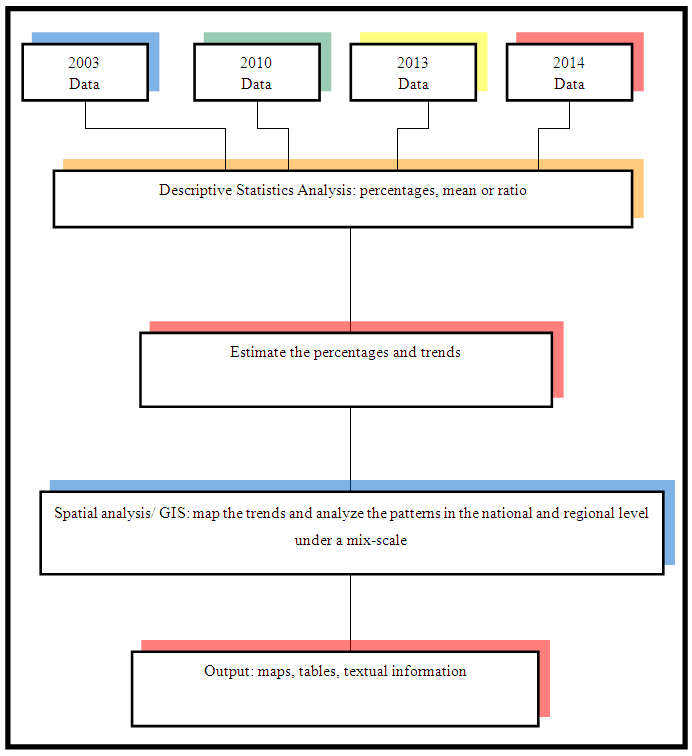
2.4. Mix Methods and Steps Involved in the Results 2.4.1. Mix scale Approach The mix scale approach as highlighted involves sequential coverage of region(s) on the one scale and nations on another using basic descriptive statistics and GIS. Because patterns of energy use in a single nation may not be a true reflection region wide. Collecting data on energy activities on multiple levels in the study area through various sources offers reliable path to gauge the prevailing trends. In the process, the analysis focused on a mix scale with highlights on energy activities in individual nations interchangeably and the region as a whole over time. With the various stages involving a collection phase under different periods, there is also the processing and the actual data analysis on two scales. See the flow chart for a summary of the process and the steps involved.Just as the information assembled as a result of the implementation of these tasks stands as the basis for the results and the discussions and the conclusions presented. The steps entailed the initial assemblage of data sets under different periods starting from 2003, 2010, 2013, and 2014 followed by the transformation of the information into relative forms of percentages through descriptive statistics at the national and regional scale. While this process helped show the tabular portrait of various forms of renewable energy use and the trends in the West African region. The GIS component illustrated the visual representation of energy indicators, the trends and the patterns. Additionally, the spatial patterns in the region were identified under different dimensions of green, red, orange and blue denoting various levels of usage and distribution. The remaining steps involved spatial analysis and output (maps-tables-text) covering the study period, using Arc GIS 10.4 and SPSS 20.0. Given that the spatial units of analysis covered 15 countries in the region. GIS as used here remained vital for mapping and analyzing the geographic data. They are versatile tools for studying many types of information and for managing several kinds of resources essential to the sustainability of energy resources in a region. Assessing the situation in West Africa using such tools is a vital contribution to energy security strategies [21].
Appendix 4
2.4.2. Benefits of GIS Methodology (Contd.)The GIS mapping highlighted the spatial distribution of renewable energy trends in West Africa and the proximity of nations under a common network. In the current study, the availability of temporal spatial data and analysis played a vital role in facilitating the assessment of energy use and the potentials in West Africa over time. The assemblage of the information and analysis using the mix scale methodology as an emerging approach devoted to the study area, not only quickened the data processing stage of the study, but it unveiled a view of the tapestry of energy flow and the challenges and differences in a way not seen before in West Africa. It is essential for effective management through timely access and energy security. In the study area, this involved the generation of maps that identified various indicators such as production, export, capacity, volumes generated, wind, and solar power. Visualizing the states in the region prone to energy poverty in these settings, not only helped focus the scope of GIS analytics and energy planning with records of common trends in affected areas, but it furnished information on the pace at which the potentials are evolving. For the purposes of planning, spatial analysis offered a visual documentation of the state of energy supply and demand at precise locations on different sets of renewables in the West Africa region. With the capability to generate temporal spatial information, this perspective serves the needs of decision makers in weighing the significance of emerging patterns and the impacts on the local economies. For that, GIS applications can serve a useful purpose in upcoming studies and will advance further through applications in a multiplicity of locales in the study area and elsewhere under conditions rooted in energy security. This then kindles the development of regional know-how and poise which in turn augments the capacity to offer guidelines in areas related to renewable energy use and access. Such role of GIS as decision support tool, can lead to actual consensus as more users, and managers in West Africa have faith in the approaches and make a workable decision to increase their applications in future. The uses of this technique in the research along with the findings from it therefore make a contribution to our understanding of GIS applications in the assessment of energy use and mitigation of energy poverty and the design of energy indices and a regional atlas. While these techniques play a fundamental role with steps upon which the analysis of renewable energy use is built. The paper revealed the utility of GIS applications under a mix scale in energy management and thus serves as conduit for future applications in communities impacted by energy poverty.
Appendix 5
3.7. Efforts and Initiatives (Contd.)3.7.1. Targeted Programs in the Region Considering the significance of energy access and security, many of the ECOWAS nations have set different target dates for realizing their project objectives regarding electricity access along with the use of modern fuels and clean cook stoves. Of the eight countries that picked 2015 as the target dates for electricity access, Cape Verde and Ghana have shown serious commitments in meeting their 2015 set goals by 100 to 80 percent for that. Further along these lines, only Burkina Faso and Niger maintained a 60-66% target level followed by, Mali, Benin republic and Côte d’Ivoire with 55 plus-50% electricity access target for 2015. While Sierra Leone settled for only 30% electricity access level by the same period, Senegal seemed focused on meeting 60% of its power needs by 2016. For the upcoming years in 2020, a pair of nations most notably Ghana and Nigeria are working towards a 100%-75% percent target rates coupled with Sierra Leone and Niger who are on course towards the fulfillment of 50-15% of their goals. The post 2020 access targets involves 35% for Liberia in 2030 and Sierra Leone’s 75% -100% levels by 2025 and 2030. The summary of the paths towards energy security in the region are firmly spelt out among the nations in terms of access to modern fuels and clean cook stoves. However, the most ambitious of all these are the 8,000 biogas digesters, and the 1 million improved cook stoves and 150,000 solar cookers to be installed by 2030 in Nigeria. The others include the 60%-40% clean cook stoves access for the populations in Benin and Liberia by 2015. 3.7.2. Miscellaneous Renewable Energy ProjectsThere are currently 2,201 renewable energy projects through reinvestments in energy access in various nations in the region. The proposed projects comprises of 15 under biofuel, 246 for biomass, PV 343, small hydro 978, waste to power 63 and wind energy 557. The number of biomass initiatives shows Sierra Leone ahead with about 100 of those and another 78-30 and 20-28 and 15 in Liberia and Mali, Cape Verde, Cote d'Ivoire and Senegal. Interestingly Mali led with 115 projects along with both Burkina Faso and Nigeria at 43-40. The countries of Senegal, Ghana and Togo also have PV solar projects numbering 25-30 respectively. Elsewhere, a group of countries Cape Verde and Ivory Coast, Guinea Bissau and Benin launched similar projects in the order of 19-15 and 5-6 in numbers as well. Nigeria tops all the nations in small hydro estimated at 591, Burkina Faso stood at a distant second with 171 followed by Benin. The waste to power projects in 4 nations involves 20 of such ventures a piece in Nigeria and Ghana and the remaining (8-15) in Cape Verde and Mali. For Wind energy projects, Senegal and Ghana emerged as the lead countries with 225-150 while Cape Verde invested in 68 programs, the neighboring nations of Niger and Nigeria both maintained 30 wind energy initiatives. Among the others, Benin, Togo and Gambia followed with projects in the under 21 mark. Overall, Nigeria leads in the number of projects among the individual countries with 671 compared to 270 for Senegal and Burkina Faso with 270-215 and 195-180 for Ghana and Niger. 3.7.3. Power Africa Initiatives through Multilateral Agencies With the energy challenges in the region, the USAID initiated a program dubbed Power Africa in partnership with some countries in West Africa to increase the number of people with access to power in the region [28-30]. Part of the objectives centers on exploring the large wind, solar, hydropower, natural gas, and geothermal resources to improve energy security, the lessening of poverty, and attainment of economic growth. Considering the needs, Power Africa covers ventures with African nations, the energy sector, and multilateral agencies like the World Bank and African Development Bank (ADB) in six nations including Ghana, Liberia and Nigeria to usher in over 10,000 MW of greener and efficient electricity production [31]. The countries are also benefiting from the International Renewable Energy agency (IRNEA) energy system planning as a prelude to moving to an efficient energy system laden with green renewable tools [9]. Through increments in mini-grid and off grid projects and infrastructure design for electricity generation, transmission, and supply configurations, Power Africa will ensure electricity access for 20 million citizens and business outlets. Under the terms of partnerships slated for the first 5 years in 2018, the US has earmarked over $7 billion in assistance with 12 US government agencies and more than $14 billion in venture funding furnished by direct credits lines and assets from partners [31]. Furthermore, the African Development Bank (ADB) has also been quite active in financing numerous energy projects in the region as a pathway to development [32-35].3.7.4. ECOWAS Renewable Energy PolicyIn the face of energy scarcity in the region, ECOWAS Regional Renewable Energy Policy (EREP) was enacted to ensure increased use of renewable energy sources like solar, wind, small-scale hydro and bioenergy for network power distribution and the facilitation of access to electricity in rural areas. The renewable energy infrastructure supported by EREP will supplement other existing sources for power generation like big hydro and natural gas. The policy targets the electricity industry with some focus on other concerns such as heat usage in the local energy sector and the possible generation of biofuels. The belief is that the policy will not only drive the region’s general development and energy sector objectives, especially energy security, but will institute the contours of a broad ECOWAS policy structure necessary for achieving sustainable energy for everyone awaiting total access in 2030. Under the policy, energy efficiency will help generate employment in energy related entities through energy efficiency distribution outlets. Being part of the center piece of innovation and the greening of West African markets, growing energy efficiency will sustain the dependability and security of distribution, by reducing shortfalls within different stages of energy output to input. This will result in improved quality of life for the general populace through education, healthiness and unpolluted water by lowering energy costs and reliance on fossil fuels in both cities and rural areas [15].
Acronyms
References
| [1] | Renewable Energy Network For The twenty First Century REN 21 Renewables. (2015). Global Status Report; Annual Reporting On Renewables Ten Years of Excellence. Paris, France: REN 21. |
| [2] | Vilar, D. (2012). Renewable Energy in West Africa. Canary Island, Casa Africa: Canary Island Institute of Technology 1. |
| [3] | Tier, J. (2016).African Renewable Energy Gains Attention. Washington, D.C: World Watch Institute. |
| [4] | Economic Community of West African States (ECOWAS), ECREEE. (2015 October). Nigeria: Market Report on Solar Thermal Water Heating and Drying of Agricultural Products. Nsukka, Enugu State: University of Nigeria National Center for Energy Research, p 1-35. |
| [5] | Renewable Energy Network For The twenty First Century REN 21 Renewables (2016). Global Status Report ; Annual Reporting On Renewables Ten Years of Excellence. Paris, France REN 21, p1-25. |
| [6] | Economic Community of West African States (ECOWAS) (2013). ECOWAS Energy Efficiency Policy (EEEP) Priai: Cape Verde, ECOWAS Renewable Energy and Efficiency, (ECREE). |
| [7] | Vilar, D. (2011 October). Case Study- Cape Verde Islands and ECREEE Regional Approach: Paper Presented At The IRENA Workshop. Sydney Australia, AU: October). |
| [8] | International Renewable Energy Agency IRENA.(2015). Remap 2030. A renewable Energy Roadmap Africa 2030: Roadmap For A Renewable Energy Future. Abu Dhabi, United Arab Emirates: IRENA, p1-69. |
| [9] | International Renewable Energy Agency IRENA. (2013). West African Power Pool: Planning and Prospects For Renewable Energy. Abu Dhabi, United Arab Emirates: IRENA, 1-91. |
| [10] | World Watch Institute. (2013). West Africa Emerges As Leading Region In the Continent For Renewable Energy and Energy Efficiency. Washington, D.C: World Watch Institute, 1-2. |
| [11] | The World Bank. (2015). Fact Sheet: The World Bank and Energy in Africa. Washington, D.C: World Bank, 1-2. |
| [12] | Yeboa, J. (2014). Critical Analysis and Action Strategies: Obstacles to the Use of Renewable Energy and Energy Efficiency in West Africa: Priai: Cape Verde, West African Institute. |
| [13] | Adenikinju, A (2008 Fall). West Africa Energy Security Report. Ibadan, Oyo State Nigeria: University of Ibadan, 1-24. |
| [14] | Monga, P. (2014). Renewable Energy In West Africa, Energy and Climate Change. Vienna, Austria: United Nations Industrial Development Organization (UNIDO). |
| [15] | Economic Community of West African States (ECOWAS). (2015 February).ECOWAS Renewable Energy Policy (EREP). Priai, Cape Verde: ECOWAS 1-80. |
| [16] | ECOWAS ECREEE (2016). GIS Mapping of Hydro Power Resources in West Africa. ECOWAS Observatory for Renewable Energy and Efficiency. Praia, Cape Verde. Retrieved On 5th February 2014 From http://www.ecowrex.org/news/gis-mapping-hydropower-resources-west-africa. |
| [17] | International Renewable Energy Agency (IRENA).(2013). Unleashing The Solar Potential In ECOWAS, Global Atlas For Renewable Energy. Abu Dhabi, United Arab Emirates: IRENA, 1-9. |
| [18] | Merem, E.C. and Y.A Twumasi. (2006).GIS and Remote Sensing Applications in the Assessment of Change Within a Coastal Environment In The Niger Delta Region of Nigeria. The International Journal of Environmental Health and Public Health. 3:1:98-106. |
| [19] | Merem, E.C. and Y.A Twumasi. (2010 May). Using GIS In Environmental Management: Green Assessment of The Impacts of Petroleum Activities In The State of Texas. The International Journal of Environmental Research and Public Health, 7:5: 2101-2130. |
| [20] | Merem, E.C. and Y.A Twumasi. (2007). GIS Applications In Global Environmental Protection: The Case of Environmental Monitoring of Fossil Fuel Emission From Oil and Gas Activities In Africa. World Resources Review 19:3: 657-680. |
| [21] | Merem, E.C. 2011. Environmental Accounting For oil and Natural Gas A North American Case Study. New York, NY: Edwin Mellen Press. |
| [22] | Merem, E.C. (2017). Assessing The Effects of Fuel Based lighting: The Case of Kerosene Disasters in Nigeria. Abstract Submitted For the 25th Annual AEHS Conference. Sandiego, CA: March 20-23, 2017. |
| [23] | Merem, E.C. (2015). Ecosystem Liabilities of Oil and Gas Activities in Southern Nigeria. Proceedings of the 12th International Symposium on the Recent Advances in Environmental Health. Jackson, MS: September 15th, 2015. |
| [24] | Merem, E.C. (2016). The Geography of Wind Energy Use in the Mid-West Region of the US. Journal of Energy and Power. 6:1:1-15. |
| [25] | Merem, E.C. (2016). Regional Assessment of Energy Trends In West Africa. Proceedings of The 13th International Symposium On the Recent Advances in Environmental Health. Jackson, MS: September 11-14th, 2016. |
| [26] | Merem, E.C. (2006). Hydro–Politics. A Case of the River Niger Basin. GIS Development: Africa. 24:28. |
| [27] | International Energy Agency (IEA). (2014). African Energy Outlook: A Focus on Energy Prospects in Sub-Saharan Africa, World Energy Outlook Special Report. Paris, France: OECD /IEA, 1-91. |
| [28] | United State Agency For International Development (USAID). (2014 July). Power Africa Annual Report. Washington, DC: USAID, 1-85. |
| [29] | United State Agency For International Development (USAID). (2015 July). Power Africa Annual Report. Washington, DC: USAID, 1-43. |
| [30] | United States Government. (2015 July 25). Factsheet: Power Africa. Washington, DC: The White House, Office of Press Secretary, 1-6. |
| [31] | United States Agency for International Development (USAID). (2015) Power Africa. Leveraging Partnerships to Increase Access to Power In Sub Sahara. Washington, DC: USAID, 1-2. |
| [32] | African Development Bank (ADB). (2016). Sustainable Energy Fund for Africa. Abidjan, Ivory Coast Cote d'Ivoire: ADB, 1-6. |
| [33] | African Development Bank Group (ADB). (May 2016). The New Deal On Energy For Africa: A transformative Partnership to Light Up and Power Africa by 2025. Abidjan, Ivory Coast Cote d'Ivoire: ADB, 1-8. |
| [34] | African Development Bank Group. (July 2016). Lighting Up and Powering Africa: AFDB Puts Energy on the Forefront Burner of Africa’s Development Agenda. Abidjan, Cote d'Ivoire: ADB, 1-5. |
| [35] | African Development Bank Group. (2016). Energy Environment Climate Change. Abidjan, Cote d'Ivoire: ADB, 1-5. |

 Abstract
 Reference
 Full-Text PDF
 Full-text HTML