-
Paper Information
- Paper Submission
-
Journal Information
- About This Journal
- Editorial Board
- Current Issue
- Archive
- Author Guidelines
- Contact Us
International Journal of Energy Engineering
p-ISSN: 2163-1891 e-ISSN: 2163-1905
2016; 6(2): 36-42
doi:10.5923/j.ijee.20160602.03

A Model for Estimation of De-rating in Diesel Engines used for Power Generation
 Abstract
 Reference
 Full-Text PDF
 Full-text HTML
U. G. Kithsiri1, 2, 3, N. S. Senanayake1, Ruchira Abeyweera1, 3, Jeevan Jayasuriya3
1The Open University of Sri Lanka, Nawala, Nugegoda, Sri Lanka
2University of Gävle, Gävle, Sweden
3KTH – Royal Institute of Technology, Stockholm, Sweden
Correspondence to: N. S. Senanayake, The Open University of Sri Lanka, Nawala, Nugegoda, Sri Lanka.
| Email: |  |
Copyright © 2016 Scientific & Academic Publishing. All Rights Reserved.
This work is licensed under the Creative Commons Attribution International License (CC BY).
http://creativecommons.org/licenses/by/4.0/

In tropical countries the charge air conditions of power generating Diesel engines deviate noticeably from the standard ISO conditions. This results in a significant drop in engine performance. One of the reasons for dropping the engine performance is the engine de-rating, which leads to an increase in the specific fuel consumption. This paper presents a study carried out to develop a model for predicting whether the prevailing site conditions cause de-rating. The model was developed with the use of recorded information in previous studies and was validated with site conditions relevant to a selected Diesel power plant in Sri Lanka. With the use of the model, it is possible to predict how close the operating temperature and relative humidity to the de-rating condition are. When applied to the selected power plant, the model predicted that the power loss due to de-rating of 8.924 MW Diesel power plant as 139kW under the operating condition of 27.8°C ambient temperature and 70.4 % relative humidity. Adjusting the temperature and humidity according to ISO conditions, it is possible to reduce the de-rating and generate the rated power and improve the specific fuel consumption as a result.
Keywords: Diesel engine, Engine de-rating, Diesel power plant
Cite this paper: U. G. Kithsiri, N. S. Senanayake, Ruchira Abeyweera, Jeevan Jayasuriya, A Model for Estimation of De-rating in Diesel Engines used for Power Generation, International Journal of Energy Engineering, Vol. 6 No. 2, 2016, pp. 36-42. doi: 10.5923/j.ijee.20160602.03.
Article Outline
1. Introduction
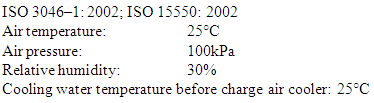
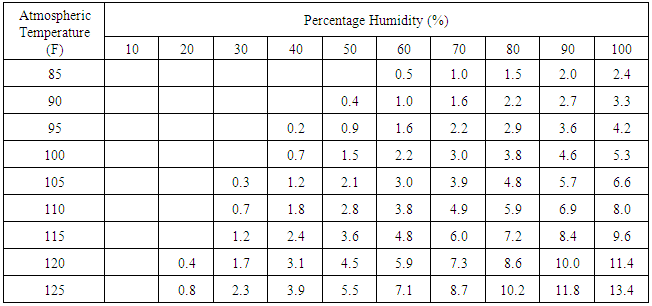
- Power generators are typically designed to run most efficiently at or near sea level under standard conditions of temperature and pressure. Any fluctuation from these conditions affects the performance of generators, hence causing a decrease in power output. The reduction of power output is called as de-rating of the engine to match the ambient air conditions [1]. Ambient conditions are extremely crucial for proper combustion and functioning of a generator. The altitude at which the generator is operated the relative humidity and the temperature of air affect the mass of oxygen that goes into the engine, hence affecting the combustion process, finally resulting in deviations in the power output. Therefore, de-rating has to be done to ensure optimum efficiency by restricting the power output hence saving in fuels [1, 2]. Otherwise specific fuel consumption increases because of low power output of the generator.This emphasises the importance that engine rating need to be checked for operation under standard conditions of ambient temperature and humidity. If conditions at site differ from the prescribed standard condition with respect to any of these factors the engine will not be able to carry its full load as previously determined. Then it is needed to calculate the de-rating allowance. De-rating owing to high ambient temperature is obvious as warm air has less density than the cold air. High ambient temperature therefore contains low weight of oxygen which is required for the combustion in the engine cylinder [1]. According to British practice the ambient temperatures below 85F (29.5°C) would not be considered as de-rating condition. But the corresponding figure for American standards is usually 90F (32°C) [2]. Usually for higher temperatures a de-rating percentage of between 2% and 3% must be allowed for every 10F increase from the datum. The humidity of atmosphere is a measure of the percentage of water vapour which is held in suspension in the air. Since water vapour occupies a certain space, an equal volume of air is displaced. Water vapour is of no use for combustion process as it lessens the amount of oxygen [2]. Hence a de-rating percentage must be allowed to compensate for the oxygen lost in the displaced air. The reason for de-rating being necessary for high altitude operation is similar to that for high ambient temperature. This means the air is less dense, and therefore less oxygen is available in the engine cylinder to support combustion. The British standard requires 500 feet above sea level to start de-rating while the American ratings are usually more generous in this respect. The Diesel Engine Manufactures Association (DEMA) standard recommends that de-rating needs to be started at 1500 feet above sea level. Above the datum line de-rating is then at the rate of approximately 3.5% per 1000 feet for normally aspirated engines and approximately 2.5% per 1000 feet for turbocharged engines [3]. Below Table 1 gives percentages of de-rating at different values of temperatures and relative humidity [4]. The ISO standard gives the Standard Reference conditions for Diesel engines as given below [5].
 The operating parameters of engine and its auxiliary system cannot be altered from its optimum ranges because it is of no value for the operation and maintenance of a Diesel power plant [6]. Also, the deviations of site conditions from the standard conditions of a Diesel power plant are unavoidable. Therefore, corrective measures need to be implemented to bring the temperature, the pressure and the relative humidity as much as closer to the standard conditions to ensure the avoidance of de-rating. For this purpose often absorption chillers operated by waste heat recovery from the plant are used [7-9]. In order to do this it is first necessary to determine whether the prevailing site conditions, specifically the combined effect from temperature, relative humidity and the altitude, are falling within the de-rating situation. Therefore, the objective of this study was to develop a model to determine whether the operating conditions of a diesel engine is in the de-rating region and to predict the amount of de-rating, which allows the operators to corrective measures.
2. Methodology
- The present study was carried out to develop a model for engine de-rating with reference to the standard ISO conditions. Recorded information in previous studies pertaining to the operating parameters of Diesel engine power plant was used to relate the de-rating conditions to temperature and relative humidity. The effect of altitude was not considered as variable as this varies rarely. Then the model was validated with site conditions relevant to a selected power plant in Sri Lanka.
3. Model for De-rating
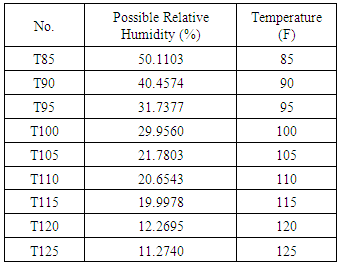
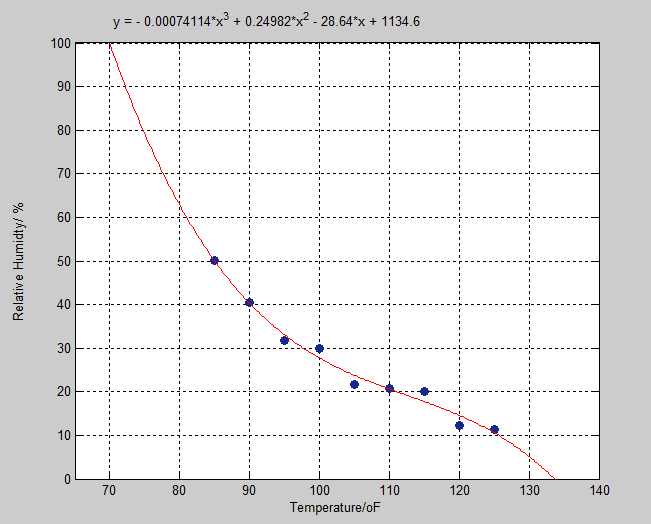
- The Diesel power s in Sri Lanka are well below the 500 feet sea level and so altitude de-rating allowance is not applicable. Table 1 gives the recommended percentages of de-rating depending upon the prevailing humidity and temperature. Figure.1 gives the graphical representation of de-rating with humidity and temperature values in Table 1.
|
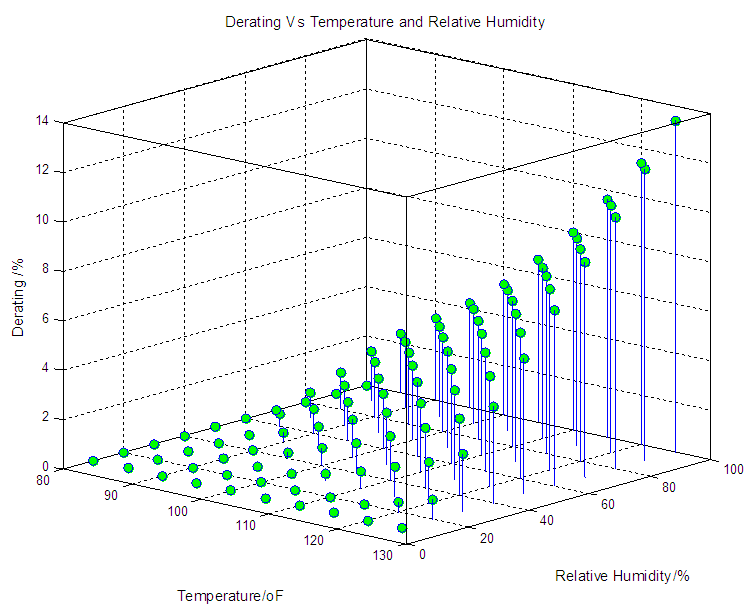 | Figure 1. De-rating Vs. Temperature & Relative Humidity |
 Regression analysis for this relation is:
 Generally coefficient of determination (R2) should be high (R2 ≥ 80%). As R2 for the above T85 equation is 100.0%, we can conclude that the fitted model explains 100% of the observed variability. The p value (significant) should be less than 0.05 for an acceptable relationship. Since the p value is 0.000, the fitted model (T85 equation) is proved to be acceptable for forecasting with 95% significant level as well. Similar expressions for percentage de-rating (Y) were obtained for other temperatures: 90F, 95F, 100F, 105F, 110F, 115F, 120F, and 125F. The critical value of the relative humidity (the relative humidity which gives zero percentage de-rating) at a particular ambient temperature is the point where the de-rating becomes zero. By equating the value of Y to zero, the values for X (% Relative humidity values) were then determined by solving 3rd order polynomials as below.For T = 85F;
 Possible solutions are: X1 = 178.9987, X2 = -26.3024, X3 = 50.1103
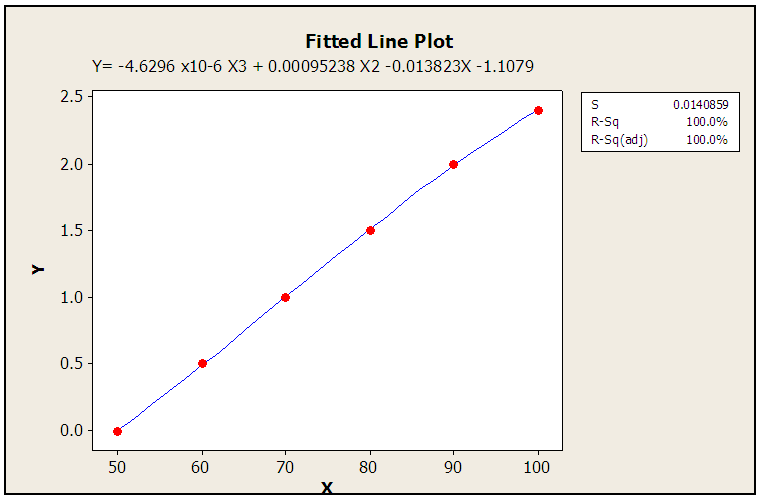 | Figure 2. Fitted line Plot for T85 |
 Solutions are: X1 = 190.1719, X2 = -9.9151, X3 = 40.4574
 Solutions are: X1 =176.2779, X2 = 6.3941, X3 = 31.7377
 Solutions are:X1 = 272.0964, X2 = -93.9563, X3 = 29.9560
 Solutions are:X1 = 201.1449, X2 = -17.2171,X3 = 21.7803
 Solutions are: X1 = 27.2639, X2 = -86.8467, X3 = 20.6543
 Solutions are: X1 = 48715809, X2 = -4871580693, X3 =19.9978
 Solutions are: X1 = 212.9173, X2 = -33.2159, X3 =12.2695
 Solutions are: X1 = 237.7024, X2 = -57.2161, X3 =11.2740The relative humidity values more than 100% and those with minus values were rejected since those are impossible. Zero de-rating relative humidity at different temperatures was summarized in Table 2.
|
 | Figure 3. Relative Humidity vs. Temperature |

4. De-rating Percentage Calculation
4.1. De-rating Due to Humidity
- By introducing a 3rd order polynomial as above it is possible to calculate the de-rating percentage for a given sites condition by the use other known relationships between relative humidity and temperatures as illustrated below for the temperatures selected.
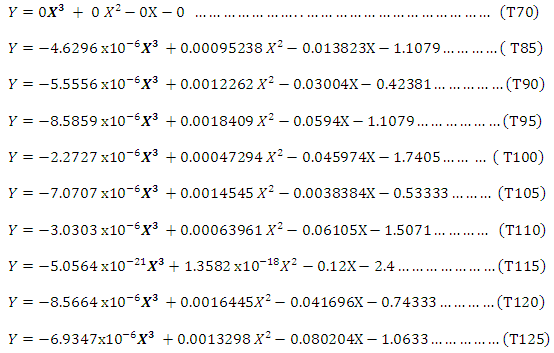 In To find out percentage de-rating at any other temperature, mathematical iteration method can be used and determine the corresponding constants of the 3rd order polynomial.
 4.2. De-rating Due to Ambient Temperature
- Below equation was used to calculate de-rating with temperature.Y = 0.2 T – 17 Where, Y – De-rating Percentage due to ambient temperature variationsT - Temperature in FTotal De-rating = De-rating due to relative humidity + De-rating due to ambient temperature.
4.3. Model Testing with Actual Data
- The developed model was applied to an operational data available in the Uthuru Janani Power Station (UJPS), Sri Lanka which was selected for the study. This heavy fuel operated power plant was installed in 2013, having three units of 8.924 MW each [10].
4.4. De-rating Due to Relative Humidity Effect
- Figure 4 shows plotted points of ambient temperature vs. relative humidity for the operational data available in the plant, on the graphical model of relative humidity vs temperature. The red color shows the actual operating points and from that it is obvious when temperature and relative humidity is closer to the ISO standard values it gets closer to the curve which separates de-rating and Non de-rating area (given function) due to the humidity effect. This means it moves towards the non-de-rating area from de-rating area.
4.5. Amount of De-rating
- The rated engine full load is 8.924MW [10] and according to the calculations it shows below mentioned amount of de-rating percentage. The calculation method is given below. Actual number of kWh de-rated can be calculated from the percentage of de-rating. Sample calculation for the de-rating was done from a selected set of data as given below.Temperature = 27.8°C = 82FRelative humidity = 70.4% It is needed to iterate and derive the equation of de-rating percentage vs. relative humidity at (27.8°C) 82F constant temperature. The equations, T85 and T70 were used for calculations as the value 82.0F lies in between these two temperatures for which the relationships have been established.
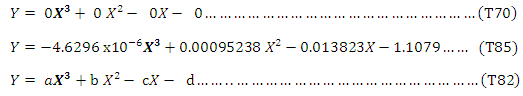 Where Y = de-rating percentage, X = Relative humidityThe factors, a, b, c, and d constants of above 3rd order polynomial that were calculated by interpolation and the values are shown below.a = - 3.7037 x10⁻⁶, b = 0.00076190, c = -0.011058By applying the above values the corresponding equation can be written as follows.
 By using the above T82 the de-rating percentage at 82F and 70.4% relative humidity was calculated as below.Y = -3.7037 x10⁻⁶ (70.43) + 0.00076190 (70.42) – 0.011058 (70.4) - 0.8863Y = -1.6877+ 3.7761- 0.7785 -0.8863Y = 0.8190%Accordingly a, b, c, d constants of the 3rd order polynomial for the selected data were calculated and average de-rating percentage was obtained as 1.0256% for the considered period. Average de-rating due to the ambient temperature effect was obtained as 0.5283%. The resultant de-rating was taken combining these two scenarios as mentioned below.
 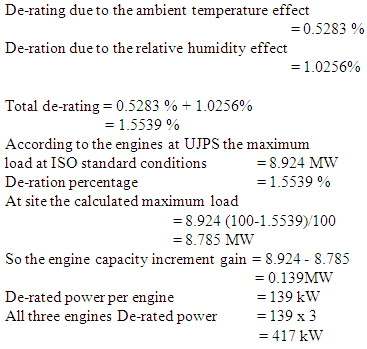 Engine de-rated power in the plant was found as 417 kW compared to ISO standard condition. This de-rated amount could be avoided by bringing operation environment into ISO conditions or changing relative humidity at a selected temperature.
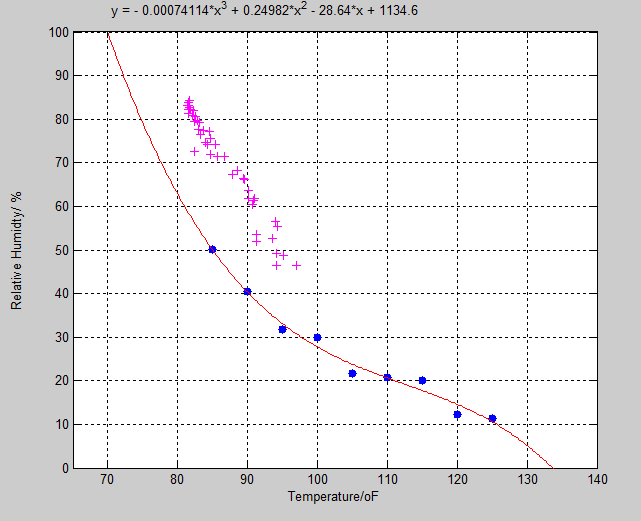 | Figure 4. Scatter plot of measured temperature and RH points |
5. Conclusions
- The overall objective of this study was to evaluate possible performance improvement by avoiding the engine de-rating in diesel power plant. In this study a model was developed using past data in order to predict on how close is the de-rating condition under the operating temperature and relative humidity. Also the model can be used to determine the amount of de-rated power as a result of deviating from the ISO standard conditions of operation. According to the prevailing scenario the engine de-rating was studied in Uthuru Janani Power Station (UJPS). In the study it was clearly shown that engine de-rating is an issue with significant loss of power. The power loss was estimated as 139kW from an engine unit of 8.924MW capacity. As power plant runs three units in the same power rating the total loss amounts to 417kW. Diesel engines in tropical countries like Sri Lanka always operate under the conditions much deviated from ISO defined conditions. This is because the average relative humidity of the Sri Lanka is around 80% and temperature at day time is always around 30°C which is above the ISO standard conditions, hence engines are always de-rated. The model developed in this study could be used to find out de-rated percentage under this scenario, and accordingly take appropriate measures to avoid such conditions. It is always possible to avoid de-rating by cooling the inlet air, modifying the relative humidity and improving charge air cooling to be close to the ISO conditions. For this purpose absorption chiller could be installed that is operated by the waste heat recovery from the plant. Potential of waste heat available at Uthuru Janani Power Station (UJPS) was identified as 4.2MW of thermal energy.