Lyes Bennamoun1, Angélique Léonard2
1Department of Mechanical Engineering, University of New Brunswick, Fredericton, E3B2L2, Canada
2Department of Applied Chemistry, University of Liege, Liege, 04000, Belgium
Correspondence to: Lyes Bennamoun, Department of Mechanical Engineering, University of New Brunswick, Fredericton, E3B2L2, Canada.
| Email: |  |
Copyright © 2014 Scientific & Academic Publishing. All Rights Reserved.
Abstract
In order to recover their dry matter, two different polysaccharide products obtained from fungal biomasses are dried in a vacuum agitated contact dryer. The first product has an initial moisture content of 10.72 kg/kg (dry basis) (Prod. 1) and the second, 21.27 kg/kg (dry basis) (Prod. 2). The vacuum drier allows control on the applied pressure and consequently the required vacuum rate, wall temperature and rotation impeller velocity. The experimental results show that when applying this drying process, the products undergo the following three phases: a short adaptation phase, a long constant drying rate phase then a falling drying rate phase. On the other hand, the determination of the torque data gives clear information about the transformation of the products from liquid to granular solid phase. Determination of the influent parameters shows that increasing temperature or impeller velocity allows increasing the evaporated water and consequently reducing drying time. However, increasing pressure level or the initial product mass plays a negative role since it increase as well drying time. The comparison between vacuum contact drying and vacuum agitated contact drying shows that using agitation reduces significantly drying time. The study is ended by performing a modelling work allowing the calculation of some transfer parameters such as heat transfer coefficient between the heated wall and the dried product.
Keywords:
Polysaccharide products, Drying phases, Agitation effect, Operating conditions, Influent parameters
Cite this paper: Lyes Bennamoun, Angélique Léonard, Physical Behavior of Fungal Biomasses during Vacuum Agitated Contact Drying, International Journal of Energy Engineering, Vol. 4 No. 2A, 2014, pp. 40-45. doi: 10.5923/j.ijee.201401.06.
1. Introduction
As reported by several authors [1-4], conductive drying presents some advantages making it a practical process that can be easily integrated at industrial scale. The following advantages can be cited:• No pollution of the heat carrying medium• Steam and odour confinement• Low VOC (volatile organic components) concentration • Reduction of fire and explosion risks due to the low oxygen level• Usually conductive drying is used with application of mechanical agitation by mean of impellers, which allows renewing the contact surface area between the walls and material leading to keep heat transfer exchanges high.Conductive drying process prove its efficiency at the application of pasty materials such as for wastewater sludge [4-6], pulp and paper sludge [7] and yeasts [2]. In order to make a good design of drying systems with optimum energy efficiency; knowing the behavior of the material during application of the process, mathematical modeling and simulation play a crucial role. Accordingly, Sahni et al. [8] studied using simulation and continuum mechanics, the behavior of an agitated contact dryer and the solvent dried inside. They simulated the profiles of the different temperatures, solvent concentrations and velocities with determination of heat transfer parameters. Tarhan et al. [9] presented the performances of an industrial contact dryer during drying of peppermint. In order to determine the optimum drying conditions, several scenarios of operating conditions with determination of the energy consumption as well the quality of the final product were then determined. Based on the behavior of sewage sludge during agitated contact drying; it was possible for Arlabosse et al. [10] to design an energetically efficient paddle dryer dotted with a vertical agitator. The study was essentially done by exploring the data coming from the agitator, the evaporation rate and the heat flux density.In this study, vacuum agitated contact drying for chemical products such as polysaccharides, and their behavior during the process with determination of some important operation parameters, are presented. Using vacuum has the advantage to allow drying at low temperatures, which can be particularity useful for thermo-sensitive products.
2. Materials and Method
2.1. Materials
Two products were obtained from an industrial company placed in the region of Liege (Belgium). The products were considered as wastes of the company obtained from fungal biomasses and the objective was to recover the dry mass of these products. After delivery, the products were kept in the refrigerator at 4 °C until further use. The measurement of the initial moisture content by letting a sample of the product in an oven at 105°C until equilibrium (24 hours were sufficient), gave two different initial moisture contents that differentiate these two products. Therefore, the first product has an initial moisture content of 10.72 kg/kg dry basis and was noted as 'Prod. 1'. The second product has an initial moisture content of 21.27 kg/kg dry basis and was noted as 'Prod. 2'.
2.2. Methods
A schema of the dryer is presented in Figure 1. It is mainly constituted of 3 parts: the drying chamber, the vacuum system and the water circuit (Lab-Vac, Agitated Vacuum Dryer, from ProCept, Belgium).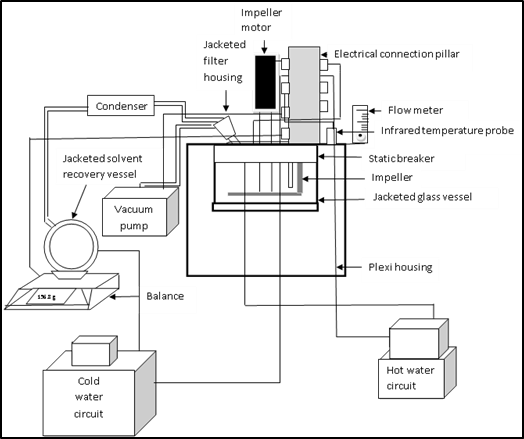 | Figure 1. Schema of the vacuum agitated contact dryer [2] |
The drying chamber is enclosed in a plexiglass housing in order to ensure a maximum of vacuum and to protect the glass vessel where the material is placed. The glass vessel is fixed into a static breaker. A motor-driven impeller is used to guarantee the mixture of the product. The drying chamber is equipped with a flow regulator for the air entering the glass vessel and an infrared temperature sensor to measure the surface temperature of the mixture. The vacuum system is constituted of a jacketed filter housing, where a filter can be placed to avoid the penetration of the matter inside the condenser, which represents another part of the vacuum group. As the condenser is at low temperature (Generally at 5°C), it permits a rapid condensation and recovery of the evaporated water in the jacketed solvent recovery vessel placed in a balance. Finally, the air is evacuated using a Teflon membrane vacuum pump capable of extracting 2 m3/h air at atmospheric pressure.The water circuit is also divided into cold circuit and hot circuit. The hot circuit is connected to the walls of the glass vessel to ensure the desired temperature. The cooling circulation bath gives low temperature to the condenser and the jacketed solvent recovery vessel.All these operations are controlled by a module system and all data are dispatched to a computer equipped with software, which permits entering the required operating conditions, such as pressure, temperature, velocity of the impeller. Temperature of the tested material, torque of the operation, velocity of the impeller are obtained in an Excel format file.
3. Determination of Heat Transfer Coefficient
Mathematical modelling plays an important role in developing an efficient process with optimum parameters. In the present case, heat and mass balances are applied to the main components of the dryer which are the product and the heated walls of the static breaker. Consequently, three descriptive equations are obtained.The drying rate (dX/dt) is expressed as a function of the evaporating flow rate per unit surface ( ) and the surface of the heated walls (A), by the mean of the following equation:
 | (1) |
As the breaker has a cylindrical shape and the heated parts are the walls and the bottom, the surface (A) is calculated as: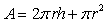 | (2) |
On the other hand, the flow rate per surface unit can be expressed as a function of the heat flux: | (3) |
where ΔH (J.kg-1) is the latent heat of vaporization generally presented as function of the temperature of the fluid used for drying process.During the constant drying rate phase, knowing the variations of the heat flux and the product temperature easily allows calculating the heat transfer coefficient by means of the following equation: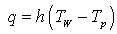 | (4) |
Tw and Tp are respectively the temperature of the walls and temperature of the product.As presented by Michaud et al. [6], during the falling drying rate phase, a drying front moved from the heating wall to the bulk of the bed. Generally, the heat flux is noted “qfront” and is equal: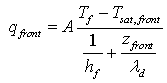 | (5) |
Where λd is the thermal conductivity of the dry matter of the tested materialZfront is the distance from the heating wall.During the falling drying rate period the drying rate is written under the following form: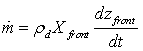 | (6) |
ρd is the density of the dry matter of the material and Xfront represents the moisture content in the wet zone near the vaporization front. The combination of the different obtained equations during the falling drying rate period allows calculating the vaporization front rate dzfront/dt.
4. Results and Discussion
It is common practice in industrial applications to use convective drying at high temperatures, around 150°C. Two objectives are then outlined from this work; in one hand, looking for more efficient drying methods that cost less than actual used processes, on the other hand, looking for the recovery of more useful chemical components that are not affected by the treatment. Just preliminary results of the first objective are presented in this study with determination of the general behavior of the product during vacuum agitated contact drying and determination of the impact of important parameters. Accordingly, temperatures ranging from 80°C to 95°C are applied with an initial mass varying between 450 g and 800 g. All the experiments were done with a constant impeller velocity of 50 rpm. Nevertheless, the effect of the impeller velocity and the pressure were tested previously with another pasty product which is baker’s yeast [2]. The drying tests were continued until attaining 10% of the moisture content or less. Figure 2 and 3 show the general behaviour of respectively (Prod. 1) and (Prod. 2) where mainly three drying phases can be observed.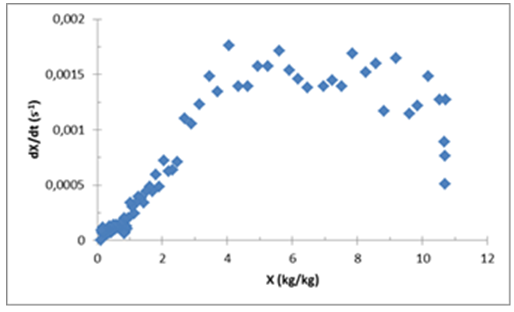 | Figure 2. Drying kinetic of (Prod. 1) during vacuum agitated contact drying at 80°C, 50 rpm, 100 mbars and an initial mass m0=462 g |
 | Figure 3. Drying kinetic of (Prod. 2) during vacuum agitated contact drying at 90°C, 50 rpm, 100 mbars and an initial mass m0=806 g |
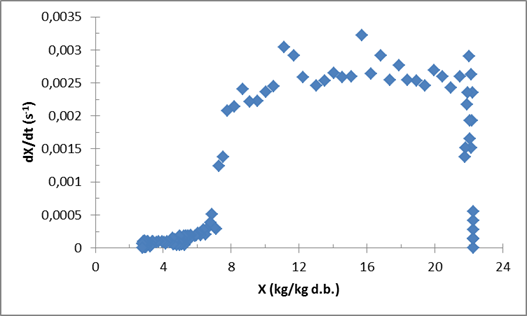
The first phase, called adaptation phase, is characterized by a swift increase in the drying rate until reaching its maximum value. During this short phase, the product is adapting itself to the applied drying conditions. Following this phase there is a long drying rate phase, where the drying rate is kept at its reached maximum value. The removed water in this phase is free water [11-13]. The mean value of the maximum drying rate of (Prod. 1) is around 0.0015 (s-1) and for (Prod. 2), around 0.0025 (s-1). The last phase is the falling rate phase which is characterized by the decrease of the drying rate. (Prod. 1) shows a linear decrease of the drying rate. This aspect is different for (Prod. 2) where we can distinguish two parts. Following the results presented by Deng et al. (2011), the water removed in the first part could be the surface water and the second part, which starts from around 7 kg/kg d.b., is the bound water. The needed time for (Prod.1) to reach the moisture content of 10% around 21000 seconds or 5 h and 50 min, and 9h 42 min for (Prod. 2) this difference can be related to the specificities of each product but also the difference of the initial mass. Figure 4 gives information about the structural changes happening in the product during the vacuum agitated contact drying. At the beginning of the process, the product has a liquid form which gives sense to the low constant value of the torque around 0.2 mN.m (for Prod. 1). After that, the product starts changing its form to a viscous sticky product, presenting a part that can stick to the walls of the vessel (heated walls) and the impeller. During this phase, the torque also starts increasing from precedent values, with high values that can reach around 2 mN.m (for Prod. 1) at the transition phase between liquid and solid phase. Finally, when the product is almost dried, two aspects of the product can be observed: a granular form and a semi-sticky form. The impeller was able to unstick and to reassemble, the part of the product that was sticking in the walls and the agitator, into one solid dried product turning with the impeller. | Figure 4. Variation of the torque during vacuum agitated contact drying of (Prod.1) |
The importance of the agitation during vacuum contact drying is also investigated as shown in Figure 5, for prod 2. The tests were done at 90°C, 50 rpm and 100 mbars. This experience is done in order to study the possibility of avoiding stickiness of the product into the impeller. The figure shows that at the beginning with the liquid form, agitation has not effect on drying process. The effect is then clear and a huge difference in drying time is then registered. With agitation, 9h 42 min are necessary to reach final moisture of 7%. However, 23 hours are needed to have around 5% of final moisture without using agitation.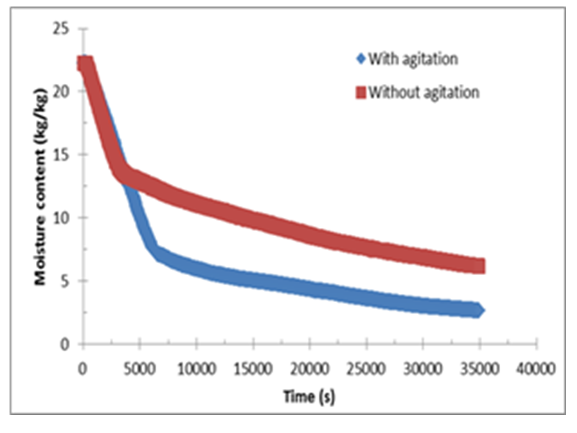 | Figure 5. Vacuum contact drying with and without agitation |
In a precedent work that investigates determination of the influent parameters during vacuum agitated contact drying, using the same dryer and different product (baker’s yeast [2]), it was found that increasing impeller velocity or wall temperature has a positive effect as a decrease of the drying time is registered. Nonetheless, increasing the vacuum pressure or the initial mass causes an increase of the drying time.Figure 6 shows some modelling results represented by the determination of the heat transfer coefficient during just the constant drying rate phase. The general behavior is similar for both products (Prod. 1 and Prod. 2). At the beginning of the process, the figure shows an important increase in the heat transfer coefficient and reaches rapidly its maximum value. This important increase is certainly due to the important quantities evaporated from the product. As the total mass of Prod. 1 is less than Prod. 2, the whole mass of Prod.1 could be in contact with the heated walls more than Prod. 2. This should explain why the maximum value reached by Prod. 1 is higher than Prod. 2. After this period, the heat transfer coefficient deceases until the end of the process. Bennamoun et al. [2] and Ferasse et al. [4] confirmed that after the constant drying rate phase, the heat transfer coefficient continue its decrease tendency until the end of the process. However, a small increase of the heat transfer coefficient is observed when the material changes its form. This observation will be confirmed by Figure 7 representing the variation of the temperature of the tested material.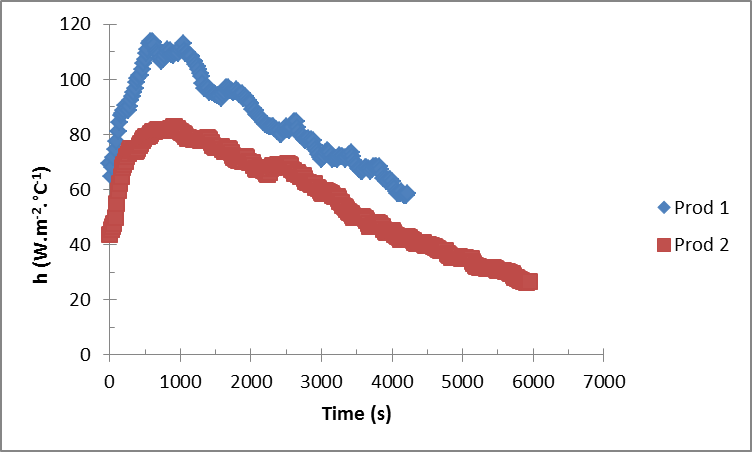 | Figure 6. Variation of heat transfer coefficient for the two products during the constant drying rate phase |
Figure 7 shows the variation of the temperature of the material noted (Prod. 2) during vacuum agitated contact drying. The figure shows an important increase of the product temperature from 20°C to around 60°C in a small lap of time. This increase is exactly corresponding to the adaptation drying phase. After that, the temperature is almost kept constant at around 60°C, corresponding to the constant drying phase. During this phase, the energy serves in particular to evaporate the water existing in the material. After the constant drying rate phase, a sudden increase in the temperature is observed. This increase could be related to the change of the material form, and could lead to the small increase of the heat transfer coefficient, as it was explained before. Finally, during the falling drying rate phase, an increase of the product temperature is recorded which means that the energy serves now to both evaporation of the product moisture and increasing its temperature until reaching the temperature of the walls. 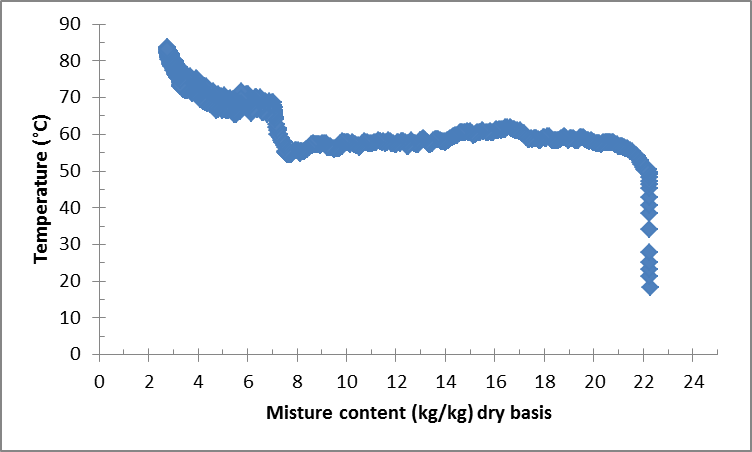 | Figure 7. Variation of the temperature of prod. 2 during vacuum agitated contact drying |
Figure 8 is a photo of the final product (Prod. 1) dried using vacuum agitated contact drying method.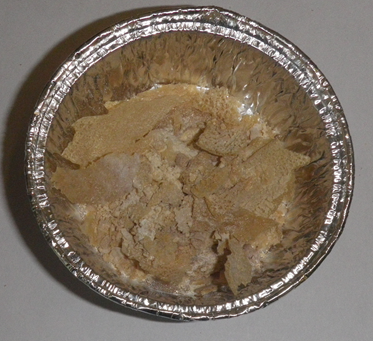 | Figure 8. Final product (Prod. 1) after vacuum agitated contact drying until 10% moisture content |
5. Conclusions
During vacuum agitated contact drying the dried products passes mainly by 3 distinguished phases: short adaptation phase, long constant drying phase then falling drying phase. The observation of the torque gives information about the passage of the tested materials from liquid to solid phase. This information is detected by the increase of the values of the torque. In a precedent work [2], temperature and impeller velocity are presented as influent parameters as their increase caused the decrease of the drying time. Drying is also influenced negatively by the initial mass of the material and the pressure as their increase leads to the increase of the drying time. Finally, by knowing the evaporated quantities of water and the temperature of the product, it is possible to determine the variation of the heat transfer coefficient.Further work and experiments and comparison between the registered values of the torque during vacuum agitated contact drying and its drying kinetic should be done in order to determine if there is correspondence between the changes in the form of the material and its drying phases.
References
| [1] | Bennamoun L., Arlabosse P., and Léonard A., 2013, Review on fundamental aspect of application of drying process to wastewater sludge, Renewable and Sustainable Energy Reviews, 28, 29-43. |
| [2] | Bennamoun L., Afzal M., and Léonard A., 2013, Study of the baker’s yeast behavior during vacuum agitated contact drying, Chemical Engineering and Technology, 36 (10), 1795-1800. |
| [3] | Arlabosse P., Ferasse J.H., Lecompte D., Crine M., Dumont Y., and Léonard A., 2012, Efficient sludge thermal processing : from drying to thermal valorisation, In Modern Drying Technology: Energy Savings, 4, 295-329. |
| [4] | Ferasse J.H., Arlabosse P., and Lecompte D., 2002, Heat, momentum, and mass transfer measurements in indirect agitated sludge dryer, Drying Technology, 20 (4-5), 749-769. |
| [5] | Yan J.H., Deng W.Y., Li X.D., Wang F., Chi Y., and Lu C.S., 2009, Experimental and theoretical study of agitated contact drying of sewage sludge under partial vacuum conditions, Drying Technology, 27 (6), 787-796. |
| [6] | Arlabosse P., and Chitu T., 2007, Identification of the limiting mechanism in the contact drying of agitated sewage sludge, Drying Technology, 25 (4), 557-567. |
| [7] | Hippinen I., and Ahtila P., 2004, Drying of activated sludge under partial vacuum conditions – An experimental study, Drying Technology, 22 (9), 2219-2134. |
| [8] | Sahni, E.K. and chaudhuri, B., 2013, Numerical simulations of contact drying in agitated filter-dryer, Chemical Engineering Science, 97 (28), 34-49. |
| [9] | Tarhan, S., Telci, I., Taner Tuncay, M. and Polatci, H., 2011, Peppermint drying performance of contact dryer in terms of quality, energy consumption, and drying duration, Drying Technology, 29 (6), 642-651. |
| [10] | Arlabosse, P., Chavez, S. and Lecomte, D., 2004, Method for thermal design of paddle dryers: Application to municipal sewage sludge, Drying Technology, 22(10), 2375-2393. |
| [11] | Bennamoun L., 2012, Solar drying of wastewater sludge: A review, Renewable and Sustainable Energy Reviews, 16 (1), 1061-1073. |
| [12] | Deng W., Li X., Yan J., Wang F., Chi Y., Cen K., 2011, Moisture distribution in sludges base on different testing methods, Journal of Environmental Sciences, 23 (5), 875-880. |
| [13] | Lowe P., 1995, Development in the thermal drying of sewage sludge, Water and Environment, 9 (3), 306-316. |
 Abstract
 Reference
 Full-Text PDF
 Full-text HTML