-
Paper Information
- Next Paper
- Previous Paper
- Paper Submission
-
Journal Information
- About This Journal
- Editorial Board
- Current Issue
- Archive
- Author Guidelines
- Contact Us
International Journal of Energy Engineering
p-ISSN: 2163-1891 e-ISSN: 2163-1905
2014; 4(2A): 33-39
doi:10.5923/j.ijee.201401.05
A Mathematical Model for Deep Bed Drying of Gelatinized White Yam (Dioscorea rotundata, Poir)
 Abstract
 Reference
 Full-Text PDF
 Full-text HTML
Adesola A. Satimehin
Department of Agricultural and Environmental Engineering, University of Agriculture, Makurdi, 97001, Nigeria
Correspondence to: Adesola A. Satimehin, Department of Agricultural and Environmental Engineering, University of Agriculture, Makurdi, 97001, Nigeria.
| Email: |  |
Copyright © 2014 Scientific & Academic Publishing. All Rights Reserved.
A mathematical model was developed for analyzing simultaneous heat and mass transfer in a deep bed of gelatinised white yam during a drying process. The model comprised three partial differential equations which were dynamic functions of the temperature and moisture content of the product as well as the temperature and humidity ratio of the drying air. The coefficients of the equations were continuous functions of the physical, thermal and hygroscopic properties of the product as well as the thermodynamic properties of air. The properties of the product were determined experimentally. Thin-layer drying data required for solving the differential equations were obtained experimentally by drying samples of the product in a convective air dryer at temperatures of 40 to 70°C and 10 to 50% relative humidity. Moisture desorption isotherms data also required for the solution of the model equation were obtained experimentally using static gravimetric method. The partial differential equations were solved numerically by using finite difference method. The deep bed drying model was validated by drying samples of gelatinized white yam in a convective air dryer; and the experimental drying data were compared with simulated data. Data obtained by the numerical simulation of the mathematical deep bed drying model agreed well with experimental data. As a result of its reasonable accuracy, therefore, the mathematical model provides many possibilities for predicting the relevant variables for a drying process. For example, the model permits the predetermination of the values of time-averaged moisture content as well as instantaneous distribution of the drying variables along the bed height. The model can also be used for predicting the product’s final moisture content and drying time, thereby making a drying process accurate, precise and amenable to automatic control using microcontrollers and computers.
Keywords: Deep bed drying, Gelatinized white yam, Theoretical modelling
Cite this paper: Adesola A. Satimehin, A Mathematical Model for Deep Bed Drying of Gelatinized White Yam (Dioscorea rotundata, Poir), International Journal of Energy Engineering, Vol. 4 No. 2A, 2014, pp. 33-39. doi: 10.5923/j.ijee.201401.05.
Article Outline
1. Introduction
- Drying is a very important unit operation in the processing of yam tubers into flour. However, drying of any food substance is an energy-intensive unit operation due to the high latent heat of vaporization of water and the inherent inefficiency of using hot air as the drying medium. According to Mujumdar [1], national energy consumption for industrial drying operations ranges from 10 - 15% for USA, Canada, France and UK to 20 - 25% for Denmark and Germany. In Hungary, drying consumes about 15 % of the total energy input in crop production [2]; and according to Patil [3], the energy used in the drying of grains accounts for 20 to 30 % of the total energy used in the production of grains in the USA. Ngoddy and Onuoha [4] and Ajibola et al. [5] acknowledged that one serious problem associated with the industrial processing of yam is the high cost of the energy consumed during drying. The authors explained that yam, especially when cooked, has a very dense structure and as a result, dries very slowly at an enormous energy cost. Besides, as much as 25% of the energy consumed in the drying process may be lost through ineffective practice and dryer designs [1].During the drying of yam, changes in its chemical, physical, biological and other characteristics do occur. Many of these changes are internal such as changes in shape and structure, shrinkage, cracks, casehardening, and denaturation of unstable components [6], [7]. These changes are influenced both by the external process conditions such as air temperature, humidity and air velocity, and by the mechanisms of internal moisture movement.Thus, if the drying of yam is to be done in such a manner that guarantees minimal energy consumption and maximum retention of the yam’s desirable quality, there must be a procedure for selecting appropriate process conditions. This requires accurate knowledge of temperature and moisture movement within the yam during the drying process. As at the moment, reports on such knowledge on yam drying are scanty. Thus, the objective of this work is to develop a mathematical model for simultaneous heat and mass transferin a stationary deep-bed of drying gelatinised white yam. The dynamics of drying a deep bed of moist material depends on the thermo-physical properties of the material being dried and the external conditions of the drying air. Drying models developed to give quantitative explanation of the complex interaction between these variables may be classified as logarithmic, equilibrium and non-equilibrium types [8]. The logarithmic-type models such as those of Hukill [9] and Baughman et al. [10] have been applied to predict average drying-time history and forecast average moisture content of a deep bed of grain dried with ambient or solar-heated air [11], [12], [13]. Logarithmic models are useful because of their simplicity and computational economy. However, in most cases their application has been to low temperature drying in fixed beds.Equilibrium models assume that deep bed drying of a material occurs near equilibrium [8]. The major limitation of these models is that they apply only to near-ambient temperatures and low velocity conditions. Nevertheless, like the logarithmic models, equilibrium-type models have contributed significantly to the understanding of the processes involved in deep bed drying of agricultural materials.Non-equilibrium models assume that there is no heat and mass equilibrium between the drying air and the product throughout the deep bed. They include the models of Boyce [14], Bakker-Arkema et al. [15], Thompson et al. [16], Spencer [17], Ezeike [18] and Stakic [19]. Aregba and Aregba-Droillet [20] presented a non-equilibrium simulation model for stationary grain deep-bed drying. All of these models are able to predict experimental data to varying degrees of accuracy.In this paper, we appealed to the general law of the conservation of an intensive property to construct a non-equilibrium deep bed drying model. Simply put, the law states that the rate of accumulation of an intensiveproperty is the algebraic sum of the net rates of convective transfer, molecular transfer, surface generation, and bulk generation of the property.
2. Materials and Methods
2.1. Development of the Theoretical Deep-bed Drying Model
- Let Figure 1 represent a control volume (CV) of a bed of drying product (x,x+dx) over a short time interval (t,t+dt). The CV comprises two thermodynamic systems namely a solid phase (the drying product) and a gas phase (air).
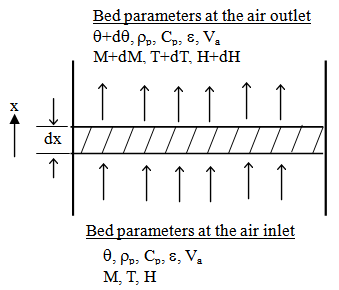 | Figure 1. Control volume of a stationary deep bed drying system |
 and the absolute humidity of air (kg H2O/kg dry air) by H. Va is the nominal velocity of air through the control volume (m/s), ρp and ρaare densities of the product and air respectively (kg/m3), Datm is the coefficient of moisture diffusion in air along the path of airflow (m2/s). Then the mass of dry air within the CV is ρaε.Sdx and the mass of dry solids within the CV is ρp (1-ε). Sdx.Thus, by taking heat and moisture balances in the control volume, the following second order partial differential equations (1), (2) and (3) were derived to describe the conservation of the air humidity ratio (H), air temperature (T) and the product’s temperature (θ). The three equations were complimented by the product’s thin-layer drying kinetic equation (4).
2.1.1. Equation of the Air Humidity Ratio
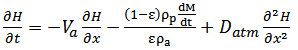 | (1) |
2.1.2. Equation of the Enthalpy of the Drying Air
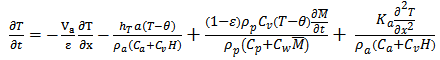 | (2) |
2.1.3. Equation of the Enthalpy of the Product
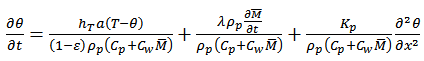 | (3) |
2.1.4. Thin-Layer Drying Equation
- Equation (4) is a thin-layer drying equation used with equations (1), (2) and (3). The equation was determined experimentally using the apparatus shown in Figure 2.
 | (4) |
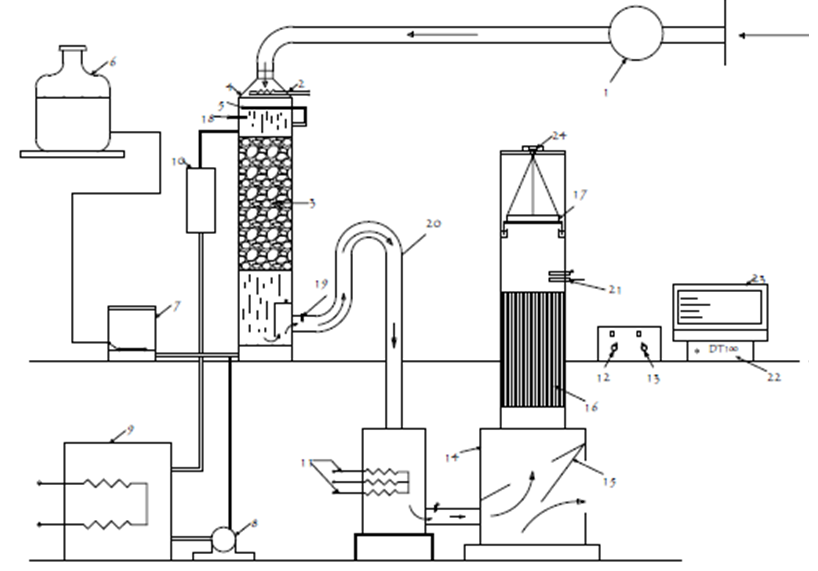 | Figure 2. Digramatic illustration of the deep bed drying apparatus. (1) - A centrifugal fan; (2) - Air pre-heater; (3) - Column of gravel; (4) - Humidification tower; (5) - Water sprinkler; (6) - transparent plastic jar; (7) - Constant-head water tank; (8) - A centrifugal pump; (9) - water pre-heater; (10) - Thermostatically controlled heater; (11) - Bank of resistance heaters; (12) and (13) - Water temperature controller; (14) - surge tank) ; (15) - Air diversion flap; (16) - aluminum honeycomb; (17) - Sample holder; (18) - Thermistor; (19), (20) and (21) - copper-constantan thermocouples; (22) - data logger |
 | (5) |
 | (6) |
 | (7) |
2.1.5. Initial and Boundary Conditions of the Bed

2.1.6. External Heat Transfer Parameter
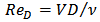
- One correlation which has been recommended for convective heat transfer in a bed of spheres [21], is of the form:
 | (8) |
 | (9) |
 | (10) |
 | (11) |
 | (12) |
2.2. Numerical Solution of Model Equations
- In solving the simultaneous system of equations (1), (2), (3) and (4) the following assumptions were made:(i) In a transfer process in which convection is the dominant transfer mechanism, the contribution of molecular diffusion to heat and mass transfer is negligible (i.e.
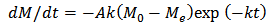
 ).(ii) The bin walls are adiabatic with negligible heat capacity.(iii) Air velocity throughout the bed of product is constant with respect to time and space (plug flow).(iv) The process was considered a one-dimensional flow problem.With the foregoing assumptions, the resultant derivatives were replaced with their corresponding finite difference approximations using forward difference method. Numerically, the elemental change in moisture content, ΔM, after a small time interval, Δt, is
  and the new moisture content is expressed explicitly as Mt+Δt = Mt + ΔM. Equation (4) and the expression for ΔM were used with the finite difference forms of the modified equations (1), (2) and (3) in calculating values of H and T at the next node, and the product temperature, θ, at the new time step. The routine for solving the equations was implemented by means of a program coded in FORTRAN77 and run on a UNIX operating system. The program contained function subprograms for calculating the changing thermodynamic properties of the moist air within the bed. It also checked for condensation and restricted the relative humidity every where in the bed to a maximum value of 0.99.
2.3. Validation of the Deep-Bed Model Equations
- The deep bed drying model was validated by drying samples of gelatinized white yam cubes in a laboratory scale drying apparatus (Figure 2).
2.3.1. Experimental Setup
- The setup of the apparatus used for the thin-layer drying tests is illustrated diagrammatically in Figure 2. A centrifugal fan (1) delivered the air required for drying. After preliminary heating by means of a pre-heater (2), the air was forced through a column of gravel (3) in a humidification tower (4). Humidification of the air was achieved by continuously spraying warm distilled water on the gravel using a water sprinkler (5). The sprinkler was made of stainless steel tube coiled into a circular loop and perforated on the underside so as to achieve uniform distribution of water onto the bed of gravel. The distilled water was held in a transparent plastic jar (6) from where it flowed, by gravity, to a constant-head glass tank (7). The head of the water in the glass was maintained constant by means of a float. A centrifugal pump (8) further pumped the water though a pre-heater (9) and a thermostatically controlled heater (10) before delivery at the sprinkler. As the water droplets flowed concurrently with the air stream down the column of gravel, the air absorbed part of the water until it became saturated. The unabsorbed part of the water was drained at the bottom of the humidification tower for recirculation into the water supply line. The saturated air, on leaving the humidification tower, was passed through a bank of resistance heaters (11) to further raise the dry-bulb temperature of the air to a desired level. One ON-OFF temperature controller (12) maintained the dew point temperature of the saturated air, and a second controller (13) acted on the resistance heaters to keep the air temperature constant within ±0.5 °C.The heated air was delivered to a surge tank (14) where some of the pressure fluctuations were dampened. The surge tank was provided with a flap (15) which diverted airflow whenever measurement of the mass of sample was to be made. From the surge tank, the air was passed through an arrangement of aluminum honeycomb (16) which helped to smoothen the airflow before delivery to the yam sample in a sample holder (17).The sample holder sample holder was an 18 cm deep cylindrical container made from a stainless steelsheet. The holder was provided with a false floor and a skirt that dipped into mineral oil to prevent drying air from side-tracking the product being dried.
2.3.2. Process Control and Data Acquisition System
- During a drying test, it was necessary to keep the temperature and relative humidity of the drying air constant. Thus, two ON-OFF controllers (12) and (13) were used to maintain the dew-point and dry-bulb temperatures at predetermined values. The dew-point temperature of the air was measured at the inlet of the humidification tower by means of a thermistor (18), while the dry-bulb temperature was measured at the outlet with a copper-constantan thermocouple (19). From the dry-bulb and dew point temperatures, the relative humidity of the air was calculated using thermodynamic relationships of moist air. In order to ascertain the reliability of the temperature controllers, final measurements of the controlled dry-bulb temperature and relative humidity were made using a second set of thermocouples. Therefore, a thermocouple (20) located at the exit of the humidification tower measured the dew-point temperature of the drying air, while another thermocouple (21) was placed immediately before a sample holder (17) to measure the dry-bulb temperature. The thermocouples were connected to a 15-channel data logger (22) (Sciemetric Instruments, Labmate data acquisition system). A data-logger scan of the thermocouples was done every eight seconds and the average readings were recorded every 30 seconds. A process control and data acquisition program was used to record the temperatures. The program also computed the relative humidity from dew-point and dry-bulb temperatures using known thermodynamic relationships. The mass of drying samples was measured by means of a bottom-loaded Mettler PJ12 electronic balance (24). The weighing balance has an accuracy of 0.1 g. A flap (15) in the plenum chamber diverted the airflow from the samples for 30 seconds each time the electronic balance was read. This was done in order to eliminate buoyancy effects of air which could lead to overestimation of the mass the samples as the drying progressed. The process control program controlled the closing and opening of the flap.
2.3.3. Sample Preparation
- White yams (Dioscorea rotundata, Poir) from Benue State of Nigeria were used for the study. The yams having a total weight of 25 kg were peeled, washed and diced into 10 millimetre cubes by means of a dicing machine (Hobart Manufacturing Company Ltd, Toronto, Canada). The cubes were immediately immersed in a bath of 1% solution of sodium meta-bisulphite for 10 minutes to prevent non-enzymatic browning. The yam pieces were blanched in a steam blancher operating at atmospheric pressure until they were completely gelatinised. This generally took about five minutes. Test for complete gelatinisation was performed using a differential scanning calorimeter (Du Pont Instruments DSC, Model 910). The Interactive Differential Scanning Calorimeter Version 3.0 Programme (Du Pont Thermal Analyzer, Model 1090) was then used to determine the heat and temperatures of transition of the samples. The blanched yam cubes showed no heat of transition whatsoever, even at 100 °C. Samples that deviated from the regular 10 mm cubes were discarded; and the rest were sealed in plastic bags and kept in refrigerated storage at 3 °C until they were required for further tests.
2.3.4. Experimental Procedure
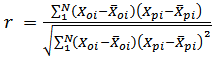
- The drying apparatus was run empty for about two hours to attain steady state at a chosen drying air condition. Approximately 215.5 g of sample representing one layer of diced yam pieces were loaded into the sample holder one layer after the other. A wire screen separated two successive layers. Copper-constantan thermocouples (0.2 mm) thick were placed two centimeters apart along the bed axis. Readings of the thermocouple were recorded every 30 seconds by the 15-channel data logger (Sciemetric Instruments, Labmate data acquisition system).During a drying run, the mass of samples was measured every 10 minutes by means of the bottom-loaded electronic balance (Mettler PJ12). Separate experiments were conducted to determine moisture content profiles after two, three, and five hours of drying. Moisture content determinations were performed by the air oven method at 103°C for 72 hours. Simulated drying data were compared with experimental data under the same conditions assumed in the deep-bed model. The goodness of fit of the theoretical deep-bed drying model was evaluated by using the mean percentage relative deviation modulus (E%), percentage root mean square (% RMS), root mean square of error (RMSE), standard error of estimate (SEE) and the correlation coefficient (r). These parameters are expressed respectively as
 | (5) |
 | (6) |
 | (7) |
 | (8) |
3. Results and Discussion
- Figure 3 shows the profile of product moisture content during simulated deep bed drying at 63°C and 19.2% relative humidity. The figure shows that drying kinetics varied considerably from one layer to another within the bed. This is because the humidity of the drying air increases as it moves along the bed depth. The product in turn adsorbs moisture from the humid air thereby delaying the incipience of drying at successive layers in the direction of airflow. The simulated profile of product temperature is shown in Figure 4. After an initial rise in the product temperature, a ‘plateau temperature’ was observed at each point of the bed, followed by a brief cooling and then a sharp rise as the drying front passed from one bed layer to another. The brief cooling of the product is attributable to the fact that as the drying air swept through the bed, heat was transferred from the air to the bed product. As a result, there was product warming which induced evaporation of surface moisture which, in turn, caused a cooling of the bed product. Interestingly, the instance of cooling at the various bed heights was related to the arrival of the advancing evaporation front.
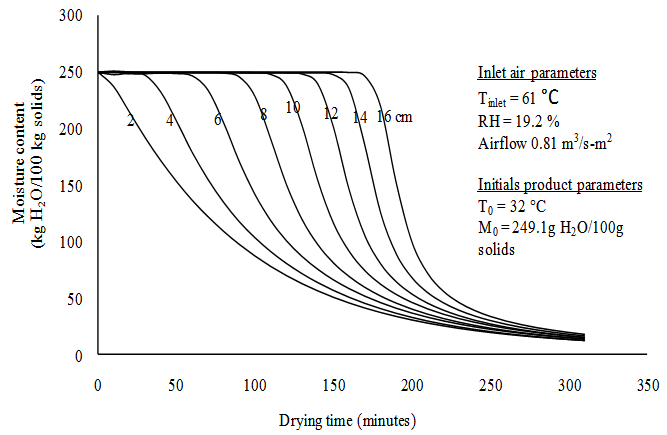 | Figure 3. Simulated product moisture content profile during drying of a 16 cm deep bed of gelatinized white yam |
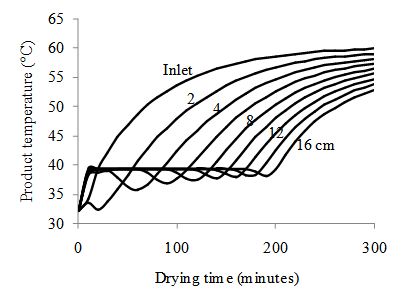 | Figure 4. Simulated temperatures of a 16-cm deep bed of gelatinized white yam drying at inlet air condition of 61 °C; 19.2% RH; 0.81 m3/m2.s |
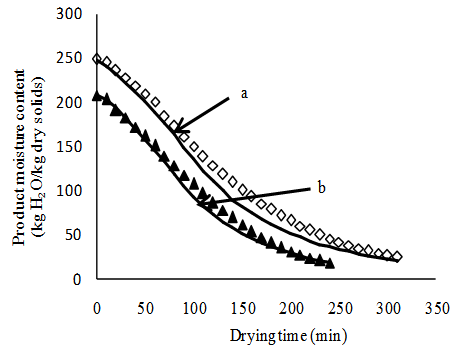 | Figure 5. Comparison between experimental and simulated average bed moisture content at inlet air conditions of (a) = 61°C, 19.2% RH and (b) =70°C, 10% RH (symbols are experimental data while solid lines are simulated data) |
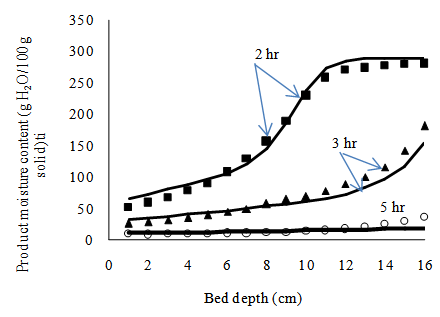 | Figure 6. Comparison between experimental (symbols) and theoretical (lines) profiles of product moisture content in a 16 cm deep bed after drying for 2, 3 and 5 hr at 63°C and 10.87% relative humidity |
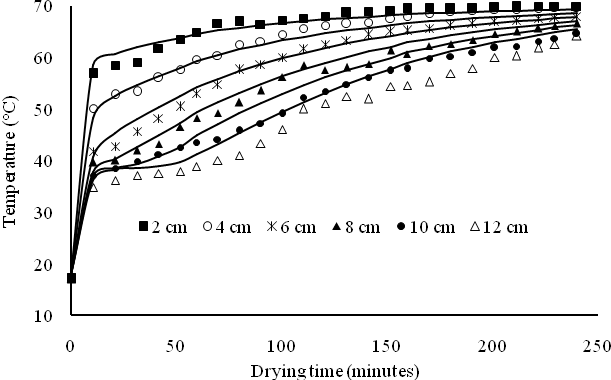 | Figure 7. Comparison between experimental (symbols) and simulated (solid lines) temperature profiles in a 16-cm bed of gelatinized white yam drying at 70°C, 10% rh |
4. Conclusions
- A deep bed drying model was developed which accurately described heat and mass transfer in a fixed bed of gelatinised white yam cubes during convective air-drying. Data obtained from the numerical simulations agreed well with experimental data. Therefore, the model provides many possibilities for predicting the values of time-averaged moisture content as well as instantaneous distribution of a product’s moisture content and temperature along the bed height. The model enables the prediction of the spatial and transient distribution of the state properties of the drying air, especially, where re-circulation of outlet air becomes critical for efficient energy utilization. The model can also be used for predicting the product’s final moisture content and drying time, thereby making a drying process amenable to automation through the application of microcontrollers.