-
Paper Information
- Next Paper
- Previous Paper
- Paper Submission
-
Journal Information
- About This Journal
- Editorial Board
- Current Issue
- Archive
- Author Guidelines
- Contact Us
International Journal of Energy Engineering
p-ISSN: 2163-1891 e-ISSN: 2163-1905
2014; 4(2A): 25-32
doi:10.5923/j.ijee.201401.04
Mathematical Modeling of Microwave Drying of Beans (Vicia faba L.), Peas (Pisum sativum) and Tomatoes (Rio grande) in Thin Layer
 Abstract
 Reference
 Full-Text PDF
 Full-text HTML
Ridha Fethi Mechlouch1, Belgacem Mahdhaoui1, Walid Elfalleh2, Ammar Mahjoubi1, Ammar Ben Brahim1
1Applied Thermodynamic Research Unit (UR11ES80), National School of Engineering of Gabes, Gabes University, Avenue of Omar Ibn Elkhattab 6029 Gabes–Tunisia
2IRA, Laboratoire d’Aridoculture et des Cultures Oasiennes, Medenine 4119, Tunisia
Correspondence to: Ridha Fethi Mechlouch, Applied Thermodynamic Research Unit (UR11ES80), National School of Engineering of Gabes, Gabes University, Avenue of Omar Ibn Elkhattab 6029 Gabes–Tunisia.
| Email: |  |
Copyright © 2014 Scientific & Academic Publishing. All Rights Reserved.
The main objectives of this paper are firstly to investigate the behavior of the thin layer drying of beans, peas and tomato experimentally in a microwave oven for different power density (1; 2 and 3W/g) and secondly to perform mathematical modeling by using thin layer drying models from literature. The variation of the moisture content of the products studied and four statistical models are tested to validate the experimental result. A non-linear regression analysis is used to evaluate the models constants. The Page and the modified Page models were found to be the most suitable to describe the microwave drying curves of beans, peas and tomato respectively. The effective diffusivity for beans, peas and tomatoes was ranged from 0.326×10⁻⁹ to 1.609×10⁻⁹ m²/s, from 0.169×10⁻⁹ to 1.024×10⁻⁹m²/s and from 0.484×10⁻⁹ to 2.127×10⁻⁹m²/s, respectively. The experimental data of the products have been analyzed to obtain the values of the effective diffusivity as a function of power density during the falling drying rate phase.
Keywords: Drying, Microwave, Power density, Thin layer, Modeling
Cite this paper: Ridha Fethi Mechlouch, Belgacem Mahdhaoui, Walid Elfalleh, Ammar Mahjoubi, Ammar Ben Brahim, Mathematical Modeling of Microwave Drying of Beans (Vicia faba L.), Peas (Pisum sativum) and Tomatoes (Rio grande) in Thin Layer, International Journal of Energy Engineering, Vol. 4 No. 2A, 2014, pp. 25-32. doi: 10.5923/j.ijee.201401.04.
Article Outline
1. Introduction
- Microwave energy is rapidly absorbed by water molecules which, consequently, results in rapid evaporation of water and thus higher drying rates, therefore microwave drying offers significant energy savings, with a potential reduction in drying times of up 50% in addition to the inhibition of surface temperature of treated [15]. To improve microwave drying a number of studies have been conducted to investigate the effects of different microwave power levels and drying temperatures, and different prediction models have been established [1-7]. The effect of microwave power level and the NaCl concentration on the drying rate of tomato pomace was investigated [8]. It was found that microwave drying could be used effectively for drying of such waste product by shortening of the drying process time.A microwave drying system, which can automatically and continuously adjust microwave power, control sample temperature and measure sample mass, was developed and used in apple drying [9].Several thin layer equations available in the literature for explaining drying behavior of agricultural products have been used by Diamente and Munro, 1993 [17] for sweet potato slices, Madamba et al., 1996 [18] for garlic silices, Midilli, 2001 [19] for pistachio, Panchariya et al., 2002 [20] for black tea, Lahsasni et al., 2004 [21] for prickly pear peel, Sacilik et al., 2005 [22] for tomato, Roberts et al., 2008 [23] for grape seeds.In a typical microwave drying application, a fixed microwave power level is applied throughout the entire drying process, but power density (W/g) not included. In this study, the thin layer drying behavior of beans, peas and tomatoes in microwave are investigated in order to discover the effect of the power density (W/g) in the drying kinetic and the effective diffusivity.
2. Materials and Methods
2.1. Materials
- Beans (Vicia faba L.), peas (Pisum sativum) and tomatoes (Rio grande) were collected from experimental parcel Arid Lands Institute (IRA ; Tunisia), washed in water and stored at 4°C for about one day prior to the drying experiment. The average initial moisture content of the samples was determinate by drying representative samples in a convectional oven at 105-110°C for 8-10h [10]. The initial moisture ratio on a dry basis of beans, peas and tomato are 2.15, 3.20 and 11.55 (g/g dried mass) respectively.
2.2. Drying Processes
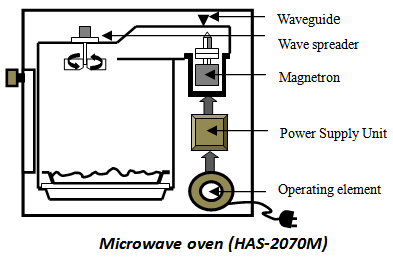
- In microwave process, beans, peas and tomatoes were dried in a programmable domestic microwave oven (HAS-2070M), with maximum output power (700 W) a frequency (2450 MHz) and uncrated weigh (10.5 kg). Samples were subjected to three microwave power densities 1, 2, and 3W/g for 5, 10, 15, 20, 25, 30 and 35 min [16]. The experiment consists in measuring the mass, moisture content and in the following the drying kinetics evolution of the three products to be dried. The mass losses are carried out by using weighting with a type Metter PL 1200 digital display electronic balance of 0.01gr precision.
2.3. Mathematical Modeling of Drying Curves
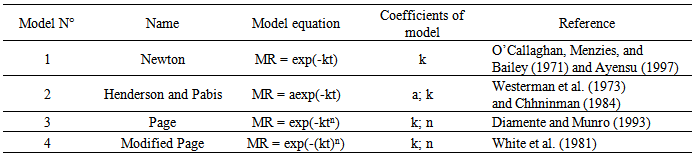
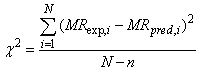
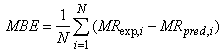
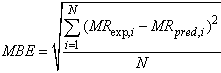
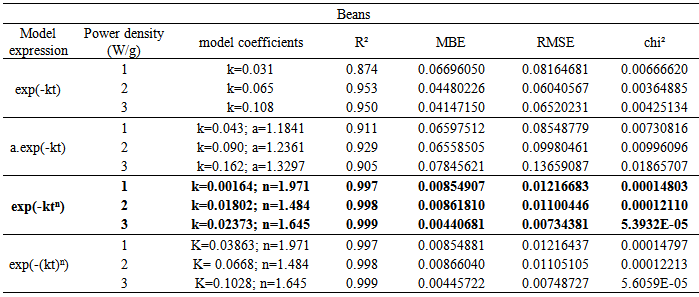
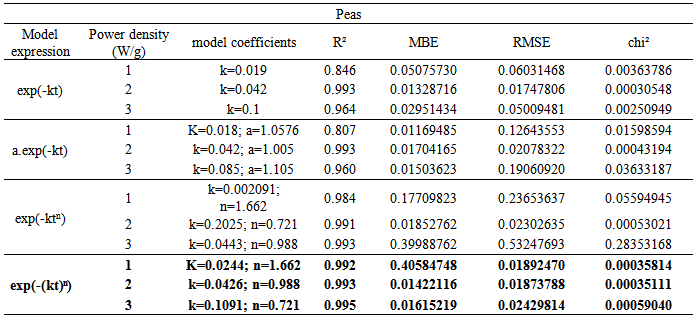
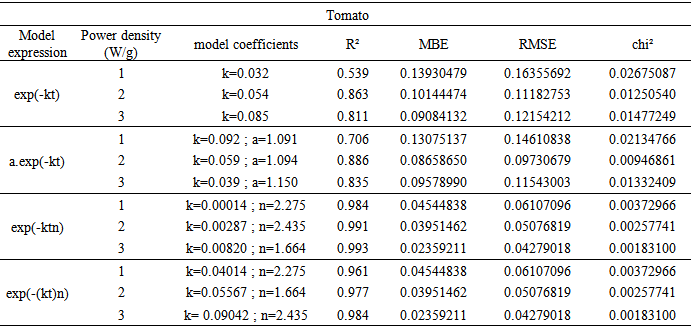
- The drying curves obtained are processed to find the most convenient expression to describe it. Moisture ratio curves are exponential pace, which is why we chose the 4 models listed in table 1 to be used in this study. Regression analyses are done by using the statistical routine. The coefficient of correlation (r) was one of the primary criteria for selecting the best equation expressing the drying curves of the sample. In addition to r, the various statistical parameters such as; chi-square (χ2), mean bias error (MBE) and root mean square error (RMSE) were used to determine the consistency of the fit.
|
 | (1) |
 | (2) |
 | (3) |
2.4. Statistical Analysis
- Data were analyzed, using SPSS (Version 17.0) statistical software. SPSS package was used to estimate parameters of models at a 95% confidence level.
2.5. Effective Diffusivity
- Analytical solution of Fick’s equation for an infinite slab (Eq.(4)) was used in order to estimate effective diffusivity [11].
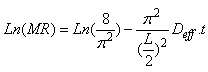 | (4) |
3. Results and Discussions
3.1. Drying Curves
- The variation of the moisture content dried bases of beans, peas and tomato with the drying time and power density (Pd) are shown in figs. 1-3, respectively. It can be seen that the decrease of MC with power density is remarkable.
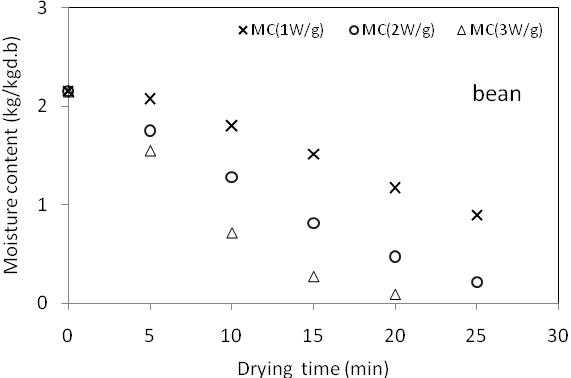 | Figure 1. Variation of beans moisture content with drying time and power density |
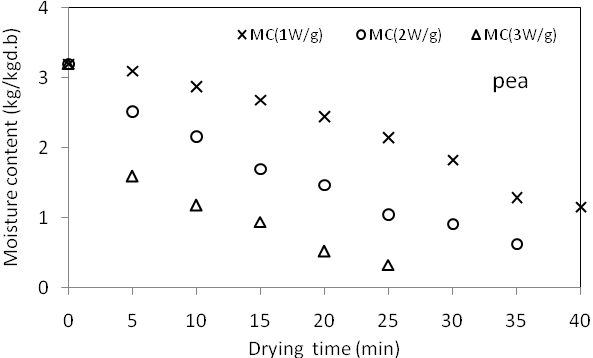 | Figure 2. Variation of peas moisture content with drying time and power Density |
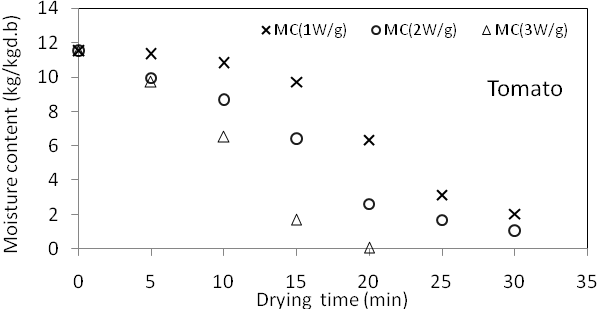 | Figure 3. Variation of tomato moisture content with drying time and power density |
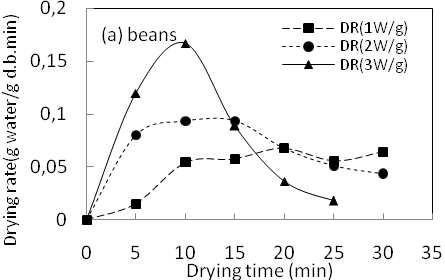 | Figure 4. Variation of beans drying rate with drying time and power density |
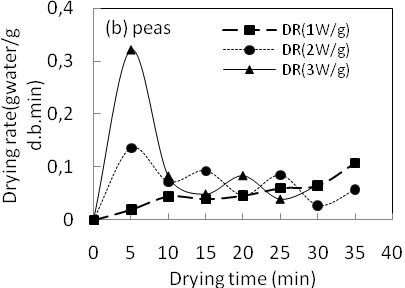 | Figure 5. Variation of peas drying rate with drying time and power density |
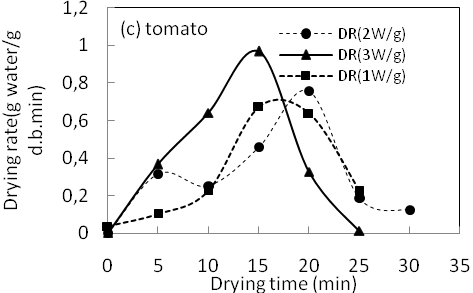 | Figure 6. Variation of tomato drying rate with drying time and power density |
3.2. Mathematical Modeling of Microwave Drying Curves
3.2.1. Moisture Ratio Modeling
- The moisture content data obtained for different products are converted to the moisture ratio expression and then curves fitting computations with the drying time are carried on the four drying models evaluated by the previous workers. The results of statistical analyses undertaken on them are given in tables 2-4.
|
|
|
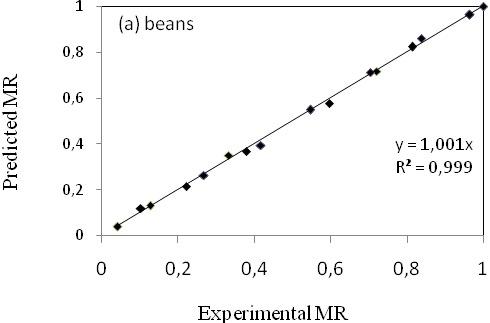 | Figure 7. Comparison of experimental and predicted moisture ratio of beans by Page model |
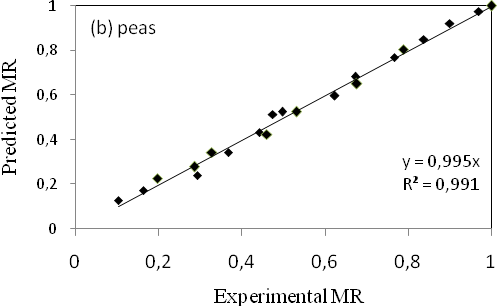 | Figure 8. Comparison of experimental and predicted moisture ratio of peas by modified Page model |
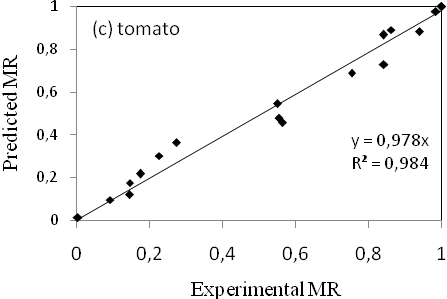 | Figure 9. Comparison of experimental and predicted moisture ratio of tomato by Page model |
|
3.2.2. Effective Diffusivity
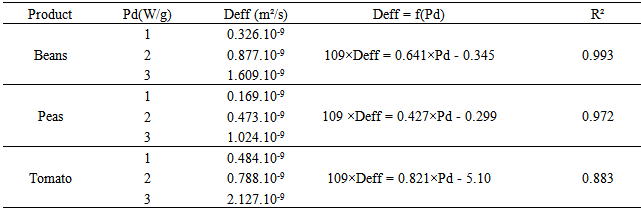
- The drying during the falling rate is governed by the diffusion of water in the product. The effective diffusivity Deff is typically calculated by graphic method representing the experimental data in terms of the logarithm of moisture ratio (MR) according to the drying time (Figs. 10-12). The result is a straight line which slope allows calculating the effective diffusivity for different powers density (Table 6).
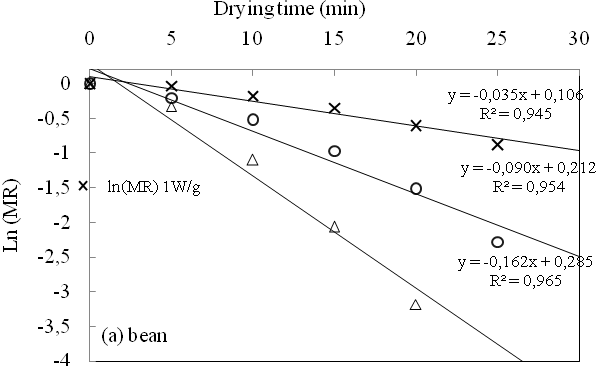 | Figure 10. Variation of logarithm of bean moisture ratio with drying time and power density |
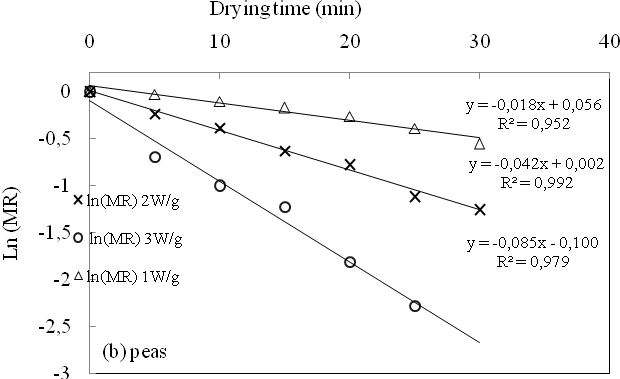 | Figure 11. Variation of logarithm of pea moisture ratio with drying time and power density |
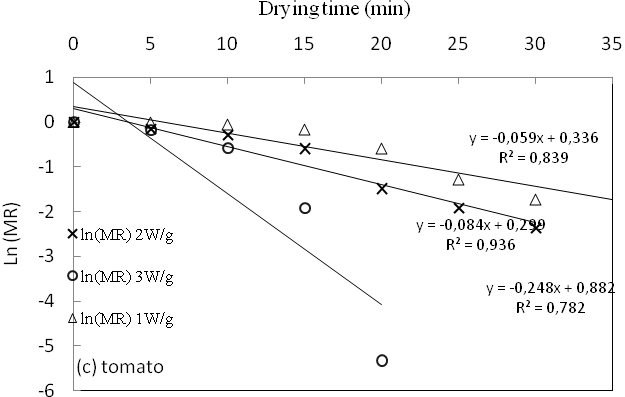 | Figure 12. Variation of logarithm of tomato moisture ratio with drying time and power density |
|
4. Conclusions
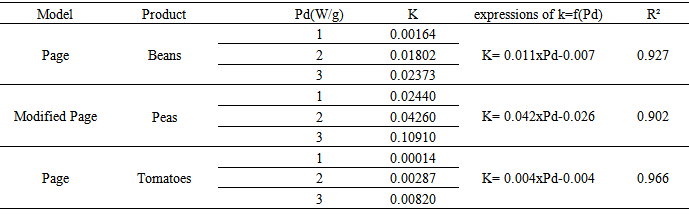
- The following results are drawn from the drying kinetics of beans, peas and tomato in a microwave oven using different power density. No constant drying rate period was observed and all the drying processes occurred in the falling rate period. All the drying models considered in this study are adequately representing the drying behavior of bean, peas and tomatoes. Although the Page and modified Page model were better than others models. The drying parameters k in Page and modified Page models equations can be expressed as a linear function of the power density. The effect of power density on the effective diffusivity Deff was mentioned. The effective diffusivity for beans, peas and tomatoes was ranged from 0.326×10⁻⁹ to 1.609×10⁻⁹ m²/s from 0.169×10⁻⁹ to 1.024×10⁻⁹ m²/s and from 0.484×10⁻⁹ to 2.127×10⁻⁹ m²/s respectively and the correlation of Deff with power density was presented.
Nomenclature
- a, b, c, n: empirical coefficients in drying modelsDeff: effective diffusivity (m²/s)K: empirical constant in drying modelsL: half thickness of product (m)MBE: mean bias errorMC: moisture content (g water/g dry basis)MR: moisture ratioMRexp: experimental moisture ratioMRpred: predicted moisture ratioN: number of observationR²: coefficient of determinationRMSE: root mean square errort: drying time (min)