Sana Ben Mariem 1, 2, Salah Ben Mabrouk 1
1Research and Technology Centre of Energy. C.R.T.En. - Laboratory L.P.T. Po Box : 95 Hammam-Life 2050, Tunisia
2Higher Institute of Agronomic Sciences of Chott-Mariem P.O. Box: 47 Chott-Mariem 4042 Tunisia
Correspondence to: Salah Ben Mabrouk , Research and Technology Centre of Energy. C.R.T.En. - Laboratory L.P.T. Po Box : 95 Hammam-Life 2050, Tunisia.
| Email: |  |
Copyright © 2014 Scientific & Academic Publishing. All Rights Reserved.
Abstract
In this study, convective drying kinetics of tomato slices was conducted in order to identify the characteristic parameters of such high moisture content product and to establish mathematical models of the drying kinetic for various range of temperatures typically encountered in industrial dryers. The results allow the calculation of the effective diffusivity and the activation energy. Drying experiments were conducted in Thermal Process Laboratory of the Research and Technology Centre of Energy. The drying characteristics of tomato were studied at 38°C, 44°C, 52°C, 57°C and 64°C with three air flow rates of 1ms-1, 2ms-1 and 3ms-1. The drying continues until samples' mass reaches a final moisture content of 11%. Some different mathematical models available in the literature (Newton, Page, Henderson and Pabis, Two-term, modified Wang and Singh, Logarithmic ...) were used and compared to estimate drying curves of tomatoes. The results indicated that to reach a final moisture content of 11% at 38°C, 44°C, 50°C, 57°C and 64°C, the drying time for 1 m/s, respectively, was 22.4h, 18.5h, 16.7h, 13.5h and 9.9h. For an air flow rate of 1ms-1, 2ms-1 and 3ms-1, the drying time of tomato slices at 50°C were 16.7h, 14.2h and 11.7h, respectively. The effective diffusivity and activation energy varied from in the temperature range (38°C - 64°C). Out of the considered mathematical models, the drying curves were fitted to Logarithmic and Two-Term equation.
Keywords:
Convective drying, Tomato, Mathematical models, Reduced moisture content, Effective diffusivity, Activation energy
Cite this paper: Sana Ben Mariem , Salah Ben Mabrouk , Drying Characteristics of Tomato Slices and Mathematical Modeling, International Journal of Energy Engineering, Vol. 4 No. 2A, 2014, pp. 17-24. doi: 10.5923/j.ijee.201401.03.
1. Introduction
Many of the industrialized food products have been manufactured after a drying operation. The heat transfer and mass take place during the process, causing the variation of the product water content and its temperature. The setting of the different curves of the water content evolution is necessary in order to optimize the conduct and control of industrially dryers.In this purpose, there have been many studies on the drying behavior of vegetables and fruits such as grape seeds (Roberts and al, 2011) [1], mint, sage and verbena, (Kouhila and al, 2001)[2] and tomato (Hawlader and al, 1991) [3], (Doymaz, 2007) [4], (Gürlek, 2009) [5], (Taheri-Garavand, 2011) [6] and (Seyoum Workneh, 2011)[7]. The most used method of convective drying is the one with the hot air.The Regions of Cap Bon and Tunisia Centre are major producers of fruits and vegetables, which part is destined for the export. The Tomato (Lycopersicon esculentum Mill) of the solanaceae family is among the most important vegetables cultivated in these regions. However, the degradation of the fresh tomato is a result of its very high moisture content (about 92%) [8], which favors its physico-chemical and microbiological degradation. The lack of equipment needed to evaluate this production big waste.Drying is one of the most important operations in chemical processing. Many food products are dried to increase their life, reduce packaging costs and improve the appearance. The interest in the production of dried tomatoes is increasing because of the possibility of using them in different purposes. Therefore, the deep knowledge of the distribution of water in the product and the behaviour of moisture loss in drying time and velocity of the drying air is essential or the conception of the drying process, the product manipulation and energy savings. For this purpose, mathematical models are used for describing the drying mechanisms and predicting the rate of dewatering is necessary. The main objective of this study is to investigate the effect of temperature and air velocity of drying on kinetics drying tomatoes and to evaluate the ability of some mathematical models to quantify the drying behavior on the range of temperatures usually encountered in industrial dryers.
2. Materials and Methods
2.1. Sample Preparation
The drying experiments were conducted on fresh tomatoes at commercial maturity (red color and farms) and collected from the local producer. Tomato samples were washed in the distilled water and cut into four pieces of uniform size about 10cm length and 1cm thickness. Twelve to sixteen pieces slices weighing between 200g-210g were dried under different conditions of temperature and hot air velocity.
2.2. Experimental Procedure
The drying tests were carried out in a hot air blower installed in the Centre CRTEn of Borj Cedria Technopark. Figure 1 [9] shows a typical tunnel dryer used for drying of tomato: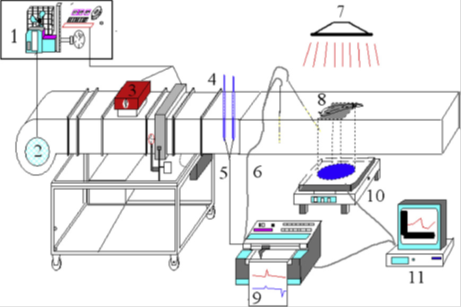 | Figure 1. Schematic diagram of the laboratory apparatus: (1) electric power control, (2) blower, (3) heaters, (4) thermo hygrometer, (5) temperature probes, (6) thermocouples, (7) spotlight Hg, (8) product sample (tomato), (9) HP data logger, (10) digital balance (Mettler), and (11) computer |
- A ventilator for ensuring the air flow where we can having control,- A set heaters to heat the air in flow,- A set of thermocouples for the temperature measurement,- A trial vein equipped with a perforated plate on which a single layer of product to be dried is exposed,- A balance and a chain of acquisition (HP data logger) to register and treat instantly the losses of mass measured.The plate is connected to a digital balance with a capacity of 600g and a precision of 0.01g which allows the monitoring of the variations in the weight of the product.The air flow is transversal and homogeneous with the surface of the product layer, to be dried within a tunnel 80cm in length and within a section 27*27cm2, in open buckle with free air.To ensure a greater stability of the drying conditions and a perfect homogenization of the temperature inside the blower, the whole equipment has to work at least half an hour before introducing the product into the drying room.The drying of the tomato conducted at various temperatures (38°C, 44°C, 50°C, 57°C and 64°C) for variable air flow rates like 1 ms-1, 2 ms-1 and 3 ms-1.The loss of mass was registered in intervals of 5 minutes in the early stage of drying then increased in 10min, 15min, 30 min and 1 hour in the later stage of drying.The drying tests were carried out in triplicate and average values are reported.Drying continued until the mass of the sample reaches the final moisture of 11%.After drying completion, the samples were dried in an oven at 105°C during for 6-7 hours to identify the final dry mass of the sample.
2.3. Mathematical Modeling of Drying Curves
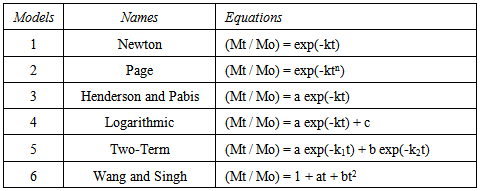
Two types of models are used to describe the drying kinetics and predict the reduced moisture content MR according to drying time: diffusion models and empirical models.The accuracy of diffusion models to predict the moisture content depends on hypotheses about the geometry, the diffusivity and the temperature profile of the product. These models require more computation time and more computer memory compared to the simple empirical models. According to some authors diffusion models are more accurate and allow the modeling of the diffusion of the internal moisture.However, they noted that the empirical models are most useful because they require less time to calculate the drying rate and are more applicable for the control of drying technologies. Therefore, it was decided to consider simple models, the most widely used [7]. The problem of modeling for drying curves consists usually in elaborating a function verifying the following equation:MR = f (t)Given the complexity of the occurring phenomena during the product drying, mathematical models in the form of empirical or semi-empirical relations to describe the drying were proposed.The equations of these models express the evolution of the reduced moisture content MR according to time. These formulas contain constants which are adjusted to make the theoretical results match with the experimental drying curves. Consequently, they are valid only in the field of experimental investigation for which they were established.Table 1 groups some mathematical equations reported in the literature and are frequently used to fit empirical correlations for describing the drying behavior of natural products.In these relations, MR represents reduced mean moisture content defined by equation (1).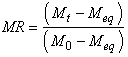 | (1) |
Where Mt is the moisture content at any time t (kg moisture/kg dry matter); M0 is the initial moisture content (kg moisture/kg dry matter), and Meq is the equilibrium moisture content of the product with air in T, HR (kg moisture/kg dry matter).The values of Meq are relatively small compared to Mt and M0, where error implied in the simplification is negligible.
2.4. Fitting Experimental Drying Curve
The variations of moisture contents with the drying time are described by the models listed in Table 1 using a nonlinear regression analysis.Table 1. Mathematical models of drying curves given by different authors [10]
 |
| |
|
The regression analysis was performed using Origin Pro8 software. The coefficients of each drying model are determined.The appropriate model for the description of the drying kinetics of tomato samples was chosen according to the following criteria [11]:• with the highest coefficient of determination( R2) and the Modeling Efficiency (EF),• the least reduced Chi-square (χ2) and the Systematic error mean ( ESM ),• and the Root mean square error (RMSE)These statistical parameters are defined by: 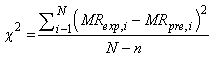 | (2) |
 | (3) |
 | (4) |
 | (5) |
Where MRexp,I is the experimental moisture ratio found in any measurement, MRpre,I is the predicted moisture ratio for this measurement, MRexpmean is the mean value of the experimental MR, N is the number of observations, and n is the number of constants.
3. Results and Discussion
3.1. Drying Characteristics
The kinetics of the moisture content loss of tomato samples was determined at temperatures of 38°C, 44°C, 50°C, 57°C and 64°C at a drying air flow rate of 1ms-1 and at a variable drying air flow rates (1ms-1, 2ms-1 and 3ms-1) for a temperature of 50°C.The variation of moisture content over time at different temperatures and various flow rate of the drying air is given in figures 2 (a) and (b). The drying process is characterized by a progressive decreasing of moisture content with time, later followed by stabilization, to reach a constant value, especially at high temperatures.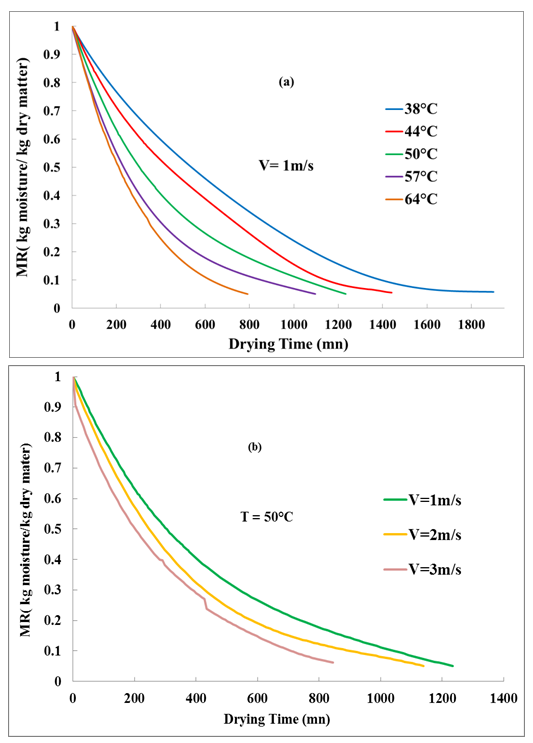 | Figure 2. Variation of the MR of tomato samples over drying time for different temperatures (a) and drying air flow rate (b) |
As can be seen from the presented data for the same air flow drying, the time required to dry the slices of tomato decreased with increasing temperature of the air drying and therefore the moisture content of the samples of tomatoes decreases considerably.The drying time of tomato slices to moisture content of 11% at 38°C, 44°C, 50°C, 57°C, and 64°C with an air flow rate of 1ms-1 was, respectively, 22h, 18.5h, 16.7h 13.5h and 9.9h. It is reduced from 1320min to 594min when the drying temperature increased from 44°C to 64°C.The same for air flow rate, an increase of 1ms-1 to 3ms-1 causes a relative decrease in drying time (T = 50°C, the drying time is 16.7h, 14.2h and 11.7h, respectively, for V equal to 1ms-1, 2ms-1 and ms-1); this is due to the increase in the coefficient of heat and mass transfer between the product and the drying air.It can be concluded therefore that there is a significant influence of the drying air temperature compared to air flow rate. These results were highlighted also by Kouhila [12] for different agricultural products where the temperature is the most factor influencing drying kinetics.The moisture content decreases with drying temperature and higher air velocities which can offer a bigger deficit of the water vapor pressure, which is one of the driving forces for the diffusion process of moisture to the outside. The increase of the drying potential and the reduction of the drying time can be explained by the fact that the rise of temperature causes an increase of the heat transfer intensity. The increase of the drying temperature is responsible for the increase of the energy of water molecules, thus accelerating the migration of the water inside the product, what can escape more easily and more quickly.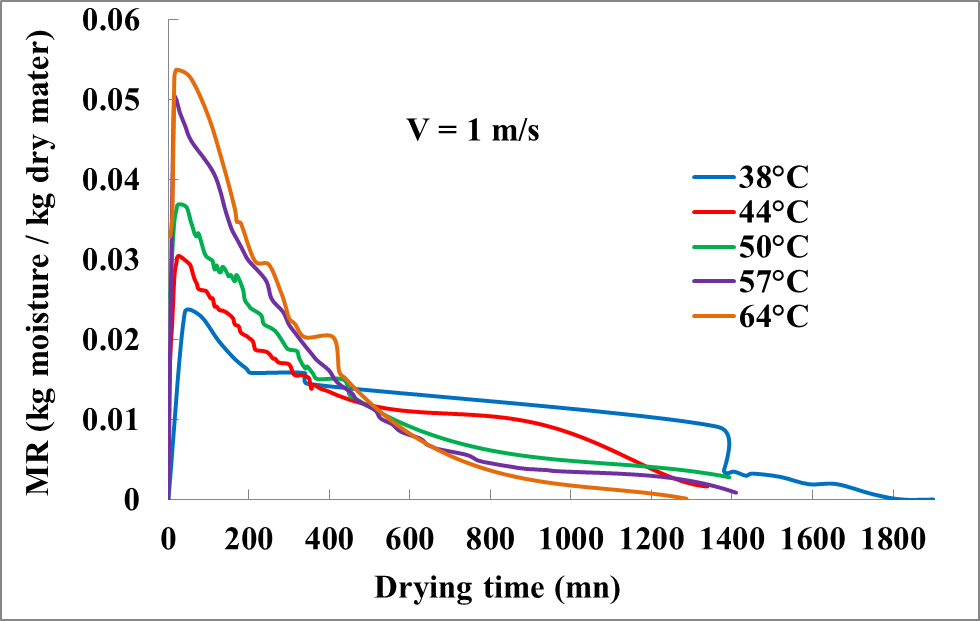 | Figure 3. Variation of the samples tomatoes drying rate for the various temperatures |
The process of drying (figure 3) is characterized by two distinct periods. • A short initial period which coincides with the stage of " sample overheating" due to the difference of initial temperature between the sample and the drying air [13]. During this period the quantity of free water is important and the internal heat production leads to an increase of internal temperature and steam pressure, which both help in the diffusion of moisture to the surface, thus increasing of the drying speed.• The second period during which the drying rate decreases gradually; it can be due to the reduction of the availability of water molecules.Consequently, the period of decreasing the drying rate expressed a high resistance to transfer of heat and mass within the material. Besides, the rapid evaporation of the surface water could lead to the formation of a solid layer on the surface which inhibits water elimination, what reduces the drying velocity. When the drying reaches its final stages, the majority of water molecules are linked [14], and thus the plan of evaporation and the drying rate decreases again.
3.2. Modeling of the Drying Curves
The experimental data of the reduced moisture content obtained at different drying temperatures were simulated for the various drying models indicated in the Table 1.The coefficients and the statistical parameters were calculated for the various drying models and are summarized in Table 2.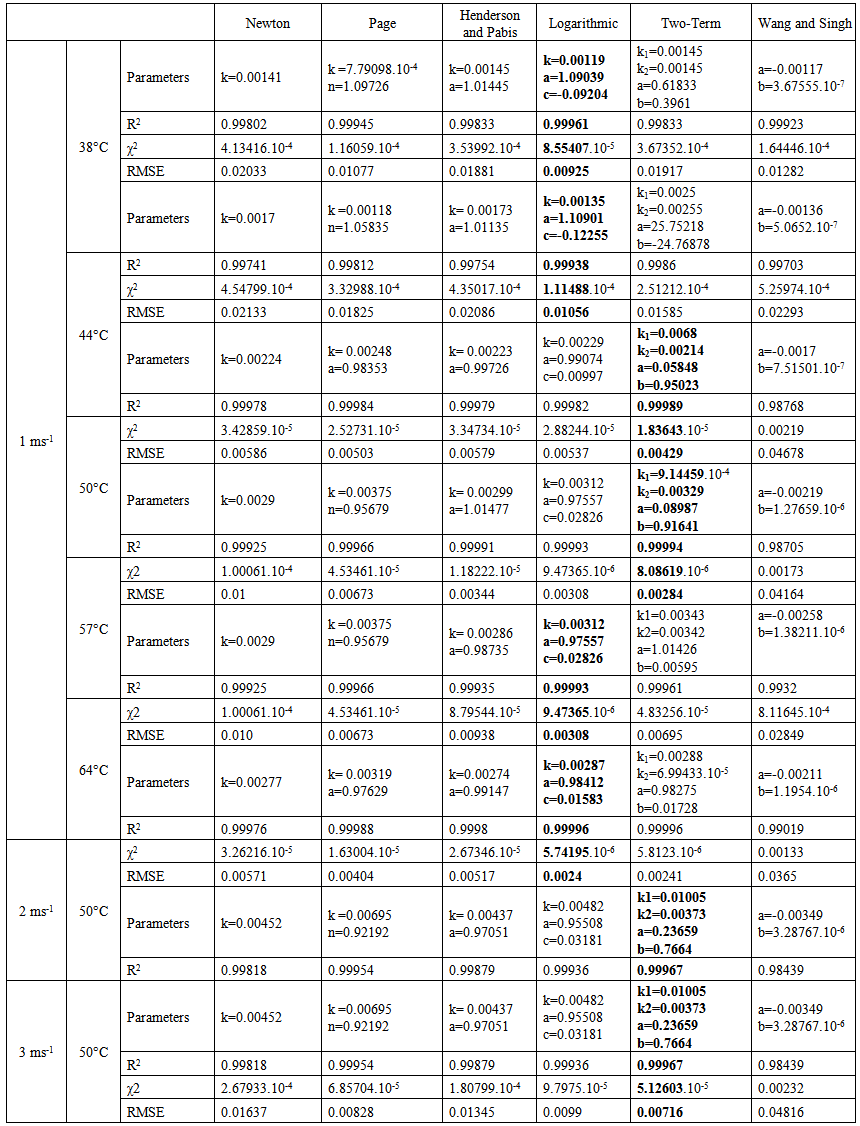 | Table 2. Statistical parameters |
This indicates that all models can be used to describe the drying behavior of tomato samples.The model with lowest RMSE and χ2 and highest R2 provide a good description of the experimental data.The highest values of R2 and the lowest values of RMSE and of χ2 were observed in the'' Logarithmic'' and ''Two-Term'' models.We can conclude, therefore, that ''Logarithmic'' and ''Two-Term'' models show a better concordance between the simulated and experimental values.On the other hand, the least appropriate model is the Wang and Singh model for all the drying temperatures used.Figure 4 presents the results of the regression analysis performed by Origin Pro.8 software with a comparison between the experimental values and the simulated values by the ''Logarithmic'' and ''Two-Term'' models.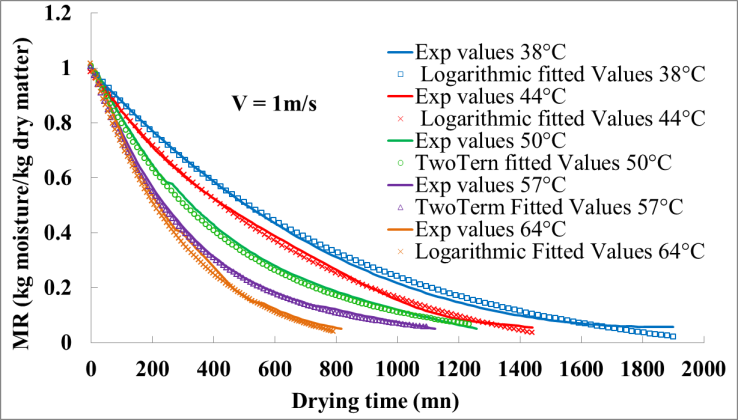 | Figure 4. Comparison of the experimental MR values and the simulated MR values by ''Logarithmic'' and ''Two-Term'' models at various drying temperatures |
3.3. Effective Diffusion Coefficient and Activation Energy
The water migrates from the inside to the surface of the product under the effect of various mechanisms which can be combined. In this analysis, the main mechanism of the water transport for the tomatoes slices is considered as diffusive type.A Simple diffusion model based on Fick's second law is considered for the evolution of the moisture content according to the gradient of moisture content and a global diffusivity which includes the various transport phenomena: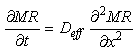 | (6) |
MR = moisture content (g water/ g dry matter);t = time (s);x = thickness of the sample (m); Deff =diffusion coefficient (m2/ s).This mathematical equation describing the drying process and calculating the diffusion coefficient is based on the classic simplifying hypotheses:- The migration of water is only by diffusion; - The water content on the surface is equal to that of equilibrium; -The diffusion coefficient and the temperature of product are considered constant; - And the retreat of the sample is negligible. Based on these hypotheses, the analytical solution of Fick's second law, developed by (Crank, 1975) [15], considering the slice of tomato as a fine layer of half the thickness L, can be expressed by: | (7) |
When the drying time is enough large and MR is less than 0.6, all the terms of the series are negligible compared to the first term and the equation can be simplified to a linear equation expressed by (Crank, 1975) :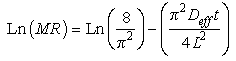 | (8) |
The Deff values are generally determined by the graphic method by representing the experimental data of drying in terms of Ln (MR) according to the drying time (t). The result is a line with a slope (π2Deff/4L2) which allows calculating the effective diffusion coefficient (figure 5).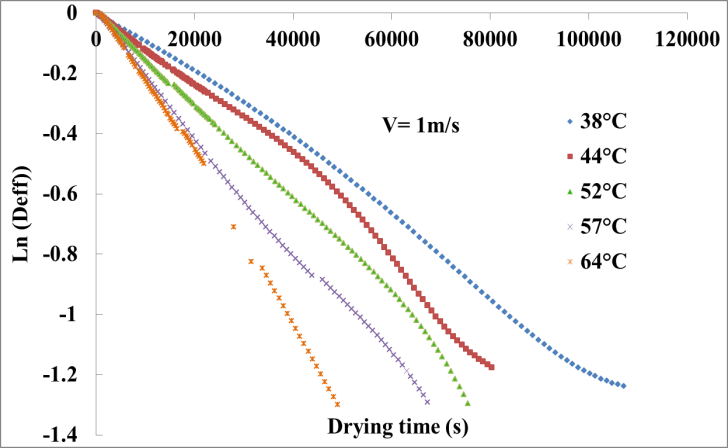 | Figure 5. Simultaneous effects of the temperature and the drying air flow on the tomatoes effective diffusion coefficient |
The Deff calculated values are presented in Table 3.| Table 3. The tomatoes samples Deff Values |
| | Temperature °C | Drying flow rate (ms-1) | Deff Values(m2s-1) | | 38 | 1 | 3.0722 .10-9 | | 44 | 1 | 3.6220 .10-9 | | 50 | 1 | 4.0480 .10-9 | | 57 | 1 | 4.7995 .10-9 | | 64 | 1 | 6.7881 .10-9 | | 50 | 2 | 4.8186.10-9 | | 50 | 3 | 5.7023.10-9 |
|
|
The relationship between Deff values and the drying temperatures can be calculated using the Arrhenius equation: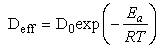 | (9) |
Where D0 is the pre-exponential factor of the Arrhenius equation (m2/s);Ea: The activation energy for water diffusion (kJ/mol); R is the constant of perfect gases (= 8.3143kJ/k mol.K); and T is the air drying temperature K.The activation energy which represents the energy barrier that the system has to exceed for stabilizing is determined from the slope of the Arrhenius curve representing experimental Ln (Deff) according to 1/ T shown in figure 6.Equation 9 can be rearranged as: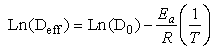 | (10) |
We pull an activation energy of the tomato samples of 13.56kJ.mol-1with a correlation coefficient r = 0.99 with air drying velocity of 2ms-1 and 10.67kJ.mol-1 with a correlation coefficient r = 0.93 for the drying air velocity of 1ms-1.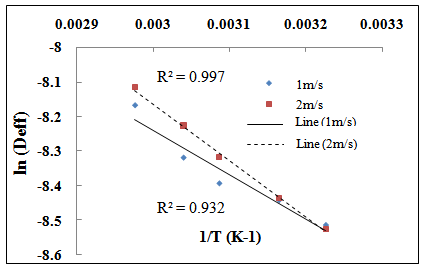 | Figure 6. Effect of drying temperature on the effective diffusion coefficient of water |
4. Conclusions
In this study, the kinetics drying of tomato slices were experimentally studied under various temperatures and air flow rates. The air drying temperature has an essential role in the characterization of drying behavior of tomato samples. The increase in temperature and flow rate of the drying air increases the drying potential and consequently decreases the drying time.To explain the tomato drying behaviour, different mathematical models were used. The ''Logarithmic'' and ''Two-Term'' models provide the best representation of the drying kinetics of tomato slices. This was based on three statistical parameter used to evaluate the fitting quality of each model, the correlation coefficient, the reduced chi-square and the root mean square error (RMSE).
ACKNOWLEDGEMENTS
We would like to thank and appreciate the valuable comments by Dr. Lyes Bennamoun.
References
| [1] | J.S. Roberts, D.R. Kidd and O. Padilla-Zakour, 2008, Drying kinetics of grape seeds, Journal of Food Engineering, 89, 460–465. |
| [2] | M. Kouhila, A. Belghit, M. Daguenet and B.C. Boutaleb, 2001, Experimental determination of the sorption isotherms of mint (Mentha viridis), sage (Salvia offcinalis) and verbena (Lippia citriodora), Journal of Food Engineering, 47, 281-287. |
| [3] | M. N. A. Hawlader, M. S. Uddin, J. C. Ho and A. B. W. Teng, 1991, Drying Characteristics of Tomatoes, Journal of Food Engineering, 14, 259-268. |
| [4] | I. Doymaz. Air-drying characteristics of tomatoes, 2007, Journal of Food Engineering, 78, 1291–1297. |
| [5] | G. Gürlek, N. Özbalta and A. Güngör, 2009, Solar tunnel drying characteristics and mathematical modeling of tomato, J. of Thermal Science and Technology, 29(1), 15-23. |
| [6] | A. Taheri-Garavanda, S. Rafieea and A.Keyhania, 2011, Effective Moisture Diffusivity and Activation Energy of Tomato in Thin Layer Dryer during Hot Air Drying, International Transaction Journal of Engineering, Management, & Applied Sciences & Technologies, 2(2), 239-248. |
| [7] | S. Tilahun, R.Vijaya and Y. Gariepy, 2011, Microwave Assisted Hot Air Ventilation Drying of Tomato Slices, International Conference on Food Engineering and Biotechnology, 9, 150-161. |
| [8] | A.S. Kholmanskiy, Tilov A.Z.,. Sorokina E.Yu, 2013, Drying kinetics of plant products: Dependence on chemical composition, Journal of Food Engineering, 117, 378 –382 |
| [9] | Ben Mabrouk S., Ben Ali E., Oueslati H., 2012, Experimental study and numerical modeling of drying characteristics of apple slices, Food and Bioproducts Processing, 90, 719 –728 |
| [10] | G. Gurlek, N. Ozbalta, and A. Gungor, 2009, Solar tunnel drying characteristics and mathematical modeling of tomato, Journal of Thermal Science and Technology, 29(1), 15-23. |
| [11] | Zhu A., Shen X., 2014, The model and mass transfer characteristics of convection drying of peach slices, International Journal of Heat and Mass Transfer, 72, 345 –351. |
| [12] | M. Kouhila, A. Belghit, M. Daguenet, 2001, Détermination expérimentale et théorique des courbes de sorption et de la cinétique de séchage de la menthe verte. Entropie, 233, 20 -31. |
| [13] | A. Ruiz Celma, F. Cuadros, F. López-Rodríguez, 2012, Convective drying characteristics of sludge from treatmentplants in tomato processing industries, Food and Bioproducts Processing, 224–234. |
| [14] | H.Thao, A.Noomhorm, 2011, Modeling and Effects of Various Drying Methods on Sweet Potato Starch Properties, Walailak Journal, 8(2), 139–158. |
| [15] | J. Crank, The Mathematics of Diffusion, 2nd ed., Clarendon Press, Oxford, 2- 4, 1975. |
 Abstract
 Reference
 Full-Text PDF
 Full-text HTML