-
Paper Information
- Next Paper
- Paper Submission
-
Journal Information
- About This Journal
- Editorial Board
- Current Issue
- Archive
- Author Guidelines
- Contact Us
International Journal of Energy Engineering
p-ISSN: 2163-1891 e-ISSN: 2163-1905
2013; 3(5): 256-266
doi:10.5923/j.ijee.20130305.04
An Appraisal of Process Units Energy Utilisation Pattern in Nigerian Refineries, Warri Refining and Petrochemical Company Case Study
 Abstract
 Reference
 Full-Text PDF
 Full-text HTML
Badmus I.1, Fagbenle R. O2, Oyewola M. O1
1Mechanical Engineering Department, University of Ibadan, Nigeria
2University of Ibadan, Ibadan, Nigeria; and Professor, Obafemi Awolowo University, Ile-Ife, Nigeria
Correspondence to: Badmus I., Mechanical Engineering Department, University of Ibadan, Nigeria.
| Email: |  |
Copyright © 2012 Scientific & Academic Publishing. All Rights Reserved.
An appraisal of process units’ energy utilisation pattern in Nigerian Refineries has been carried out, using Warri Refining and Petrochemical Company as a case study. The purpose of the study is to ascertain whether energy consumptions in Nigerian refineries have been for the main function of the refineries (i.e. refining) or not.) The investigation covers a period of eight years: 2000 to 2008, except 2001 for which the necessary data could not be retrieved. The average energy consumption distribution over the period of nearly one decade is: Atmospheric Distillation Unit and Desalter: 34%; Power, Utilities and Maintenance: 28%; Hydrotreating: 18%; Reforming: 15%; Fluidised Catalytic Cracking: 3%; Vacuum Distillation Unit: 2% and Alkylation: 0%. The process units have been operating with low time efficiencies, while energy has been consumed mostly for power, utilities and routine system maintenance. This has led to low capacity utilisations and high specific fuel consumption values. This is indeed not favourable to efficient and profitable energy consumption as it implies energy consumption for a purpose different from the primary one for which the refinery exists.
Keywords: Process Units, Energy, Refinery, Warri, Nigeria
Cite this paper: Badmus I., Fagbenle R. O, Oyewola M. O, An Appraisal of Process Units Energy Utilisation Pattern in Nigerian Refineries, Warri Refining and Petrochemical Company Case Study, International Journal of Energy Engineering, Vol. 3 No. 5, 2013, pp. 256-266. doi: 10.5923/j.ijee.20130305.04.
Article Outline
1. Introduction
- Efficient use of energy has both economic and environmental benefits. For industries, while it lowers production costs and raises productivity, it also reduces emissions of various pollutants, including Green House Gases like CO2. Nigeria is energy-resource rich. She is endowed with a vast amount of energy resources. Nigeria’s export blends are light, sweet crudes that have low sulphur contents of 0.05 - 0.2%[1]. The country is the eleventh largest producer and the eighth largest exporter of crude oil in the world. It typically produces over 2.4 million barrels per day of oil and natural gas liquids[2]. In 2010, Nigeria exported approximately 2.2 million bbl/d of total oil and 1.8 million bbl/d of crude oil[3]. Unfortunately, for about the past one decade, only 17% - 20% of gasoline demand could be supplied by local refineries[4]. Nigeria has four domestic refineries, with a total refining capacity of 445,000 barrels per day[5, 6]. An assessment of the oil and petrochemical industry in Nigeria would yield a myriad of challenges. Despite the oil fortune, Nigeria is a net importer of refined petroleum products. The situation has led to very unstable petroleum products price regimes in the country. This is forcing poor Nigerians to look for cheaper fuel alternatives to satisfy their domestic energy needs, with the attendant negative environmental effects[7, 8]. Besides, virtually every Nigeria life is affected by availability or otherwise of petroleum products, primarily through transportation. The operation of internal combustion engines to generate electricity due to the electrical power crisis in the country for household energy use and industrial use also contribute to dependency on petroleum products. However, before these products can be obtained from crude oil it has to pass through the refining process where it is ‘cracked’ into different useful components. The useful components includes Premium Motor Spirit (PMS) or gasoline, Automotive Gas Oil (AGO) or Diesel Oil, Dual Purpose Kerosene (DPK) and others. Since there is no other way of getting these components from crude oil except through this process, the energy consumed during the process is a critical determinant of the final product price in the energy market. Energy utilisation efficiencies are affected by the manner of energy conversion, or ‘path’ followed by the conversion process. Besides, no matter the path followed, every conversion is accompanied by energy degradation. One of the most energy-intensive processes in modern day civilisation is crude oil refining. Despite the continuous search for alternative energy sources, our civilisation is still hydrocarbon fuel-driven. Being an oil-rich country, Nigerian economy very much depends on oil. The world transport system, at least for now, also depends on how efficient the oil refining process is, because our means of transportation on land, water and in the air are powered by hydrocarbon fuels. Nigeria has peculiar challenges of unstable petroleum products prices. This is due to what is perceived by many as non-functionality and/or poor performance of government-owned refineries, incessant natural gas flaring and environmental degradation in the oil producing areas. Due to all these, there is a need to look for ways of improving the efficiencies of energy utilisation and environmental protection in our refineries. Due to the fact that energy is a factor that touches every aspect of human existence, everyone has been naturally concerned about the deplorable state of the Nigerian energy sector. Different researchers have tried to tackle the challenge, each from their intellectual viewpoint. Badmus et al[9] gave an in-depth analysis and review of performance appraisals of Nigerian federal government-owned refineries carried out by different authors in recent times.Warri Refining and Petrochemical Company Limited (WRPC) was commissioned in September 1978 with an initial capacity of 10,000 barrels per stream day of crude oil and debottlenecked in 1987 to a capacity of 125,000 barrels per stream day. Hence, its present capacity is 125,000 barrels per day. The main business of WRPC is to process crude oil into petroleum and petrochemical products. An obvious fact is that an oil refinery is set up with the primary objective of processing crude oil into finished products. This objective is the major factor in defining its capacity utilisation and specific fuel consumption. Hence, even if fuel is utilised efficiently for a different or secondary purpose, the system capacity will still be considered under-utilised with high and consequently inefficient specific fuel consumption. In the particular case of WRPC, fuel consumption pattern is very important because various forms of energy consumption in the refinery depend on it. This is due to the fact that neither steam nor electricity is purchased by the refinery. They are both generated within the refinery from the fuel utilised.Besides, process units’ fuel consumption allocation pattern is important because it assists in establishing the units that actually utilise the fuel and in what proportion. Hence, appropriate process units fuel consumption allocation pattern is a necessary prerequisite but not a sufficient condition to guarantee efficient energy utilisation in a refinery plant. After examining the general process unit fuel distribution, it is then necessary to assess each process unit for efficient energy utilisation.Several researchers who have examined Nigerian government-owned refineries have mentioned capacity under-utilisation as a major challenge militating against good performance in general and efficient energy utilisation in particular. For instance, Aigbedion and Iyayi[10] observe that the oil and gas sub-sector has also been constrained by the unenviable state of the nation’s refineries which have been producing at minimal capacities in the past few years. However, none of the published works in the open literature has specifically identified the reason or cause of capacity under-utilisation in clear terms or how this has directly or indirectly led to inefficient energy utilisation. This work is embarked upon to determine whether the process units get the required major share of fuel utilisation in the refinery or not.
2. Methodology
- For the purpose of this paper, data gathering was conducted during a weeklong visit paid to WRPC. Data was collected on fuel consumption pattern for the period 2000 – 2008 in the fuels section of the refinery. The required secondary data were obtained from Annual and Monthly Reports of the refinery and various publications of relevant institutions such as Nigerian National Petroleum Corporation (NNPC), US Energy Information Administration, OPEC and reputable journals. The aggregated data on overall annual fuel utilization in the refinery have been obtained. Interview technique was also used to elicit information where necessary. Analyses are made, bearing in mind the fact that processes of production are quite specific to the various plants, the type of end products generated and the number of plant units used.
2.1. The Governing Equations
- The relevant equations to the subject of this paper are set out as follows:
2.1.1. Capacity Utilisation
- Every refinery is designed to refine a certain quantity of crude oil within a particular period. However, most refineries do not always operate at the design level. Capacity utilisation of the Crude or Atmospheric Distillation Unit is the parameter used to assess performance with respect to the quantity of crude oil processed per time.
 | (1) |
2.1.2. Specific Fuel Consumption, sfc
- The specific fuel consumption as used in this work is ratio of fuel utilised at the refinery per unit mass of crude oil processed expressed as a percentage. Hence,The specific fuel consumption (s f c) used in this work is:
 | (2) |
2.1.3. Time Efficiency
- Time efficiency, ηtime, is one of the macro parameters used to measure the refinery performance[11].
 | (3) |
|
|
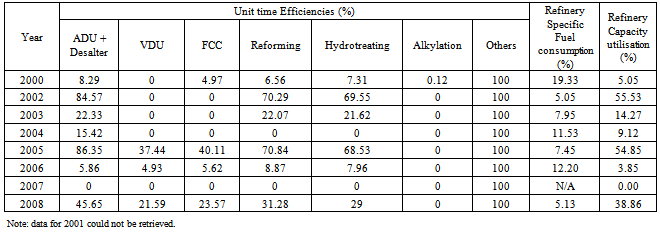
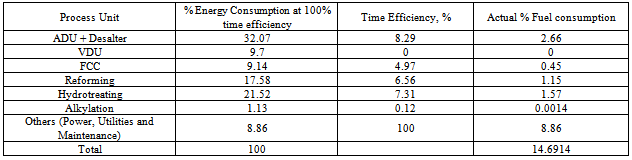
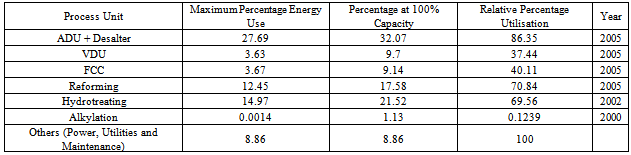
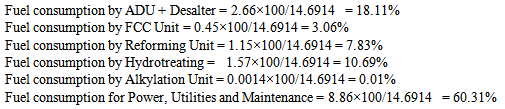 In this paper, based on Worrell and Galitsky[12], quoted in White[13], giving rise to Tables 1 and 2, we assign second to the last row of each of the Tables, “Others” to Power, Utilities and maintenance purposes in Table 4 and subsequently in Tables 5 and 6.
3. Results
|
|
|
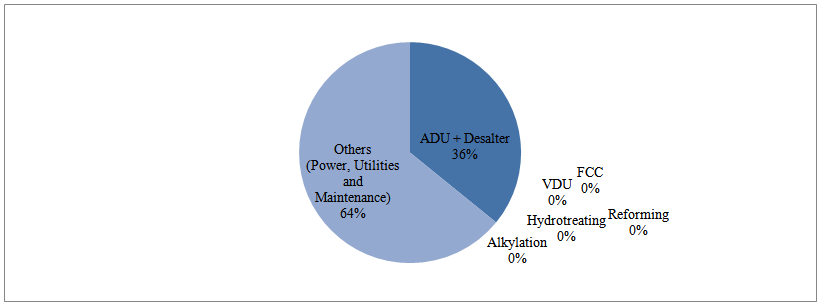
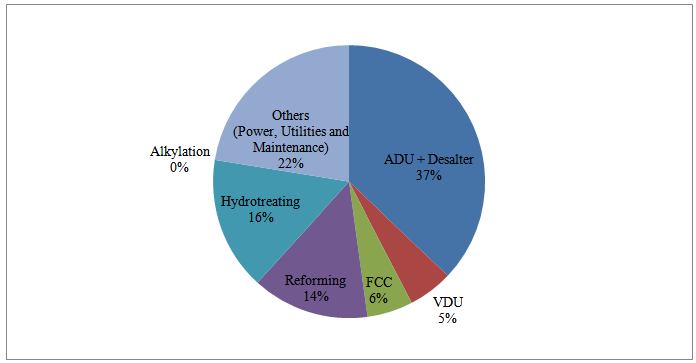
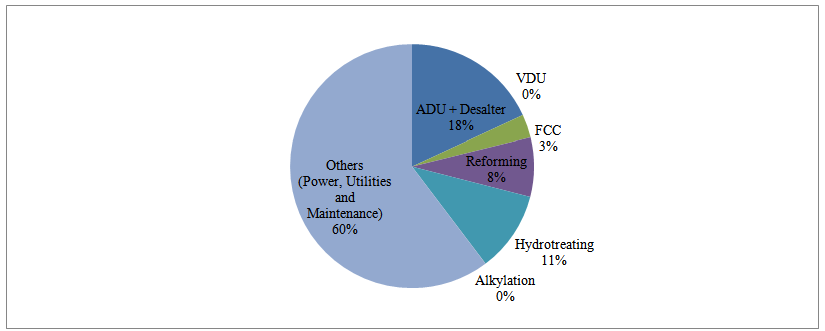 | Figure 1. WRPC Process Units Fuel Distribution for the Year 2000 |
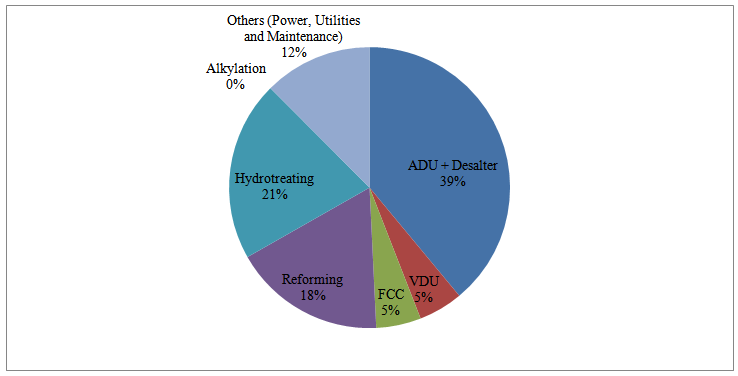
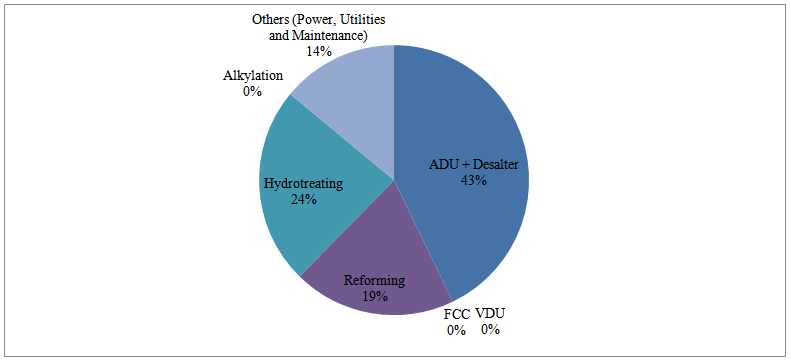 | Figure 2. WRPC Process Units Fuel Distribution for the Year 2002 |
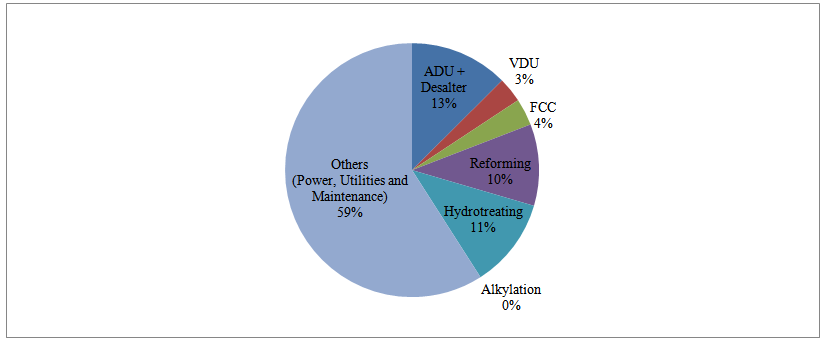
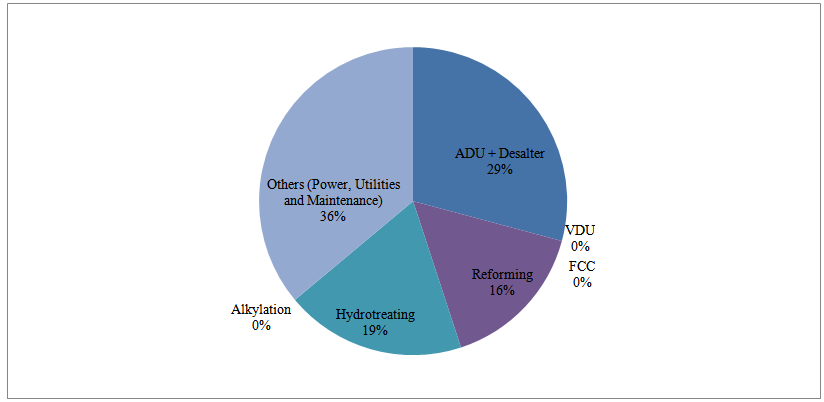 | Figure 3. WRPC Process Units Fuel Distribution for the Year 2003 |
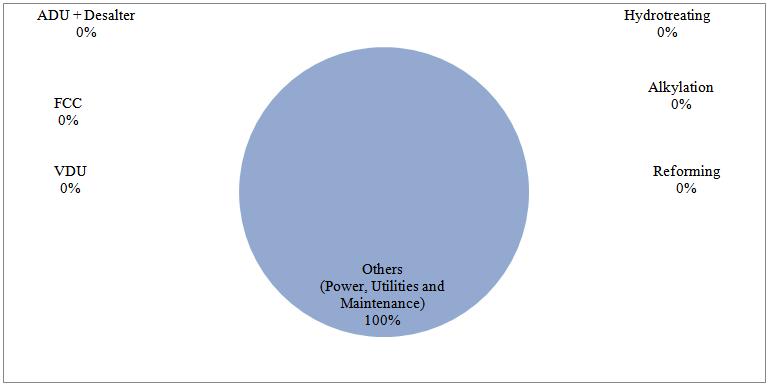
 | Figure 4. WRPC Process Units Fuel Distribution for the Year 2004 |
 | Figure 5. WRPC Process Units Fuel Distribution for the Year 2005 |
 | Figure 6. WRPC Process Units Fuel Distribution for the Year 2006 |
 | Figure 7. WRPC Process Units Fuel Distribution for the Year 2007 |
 | Figure 8. WRPC Process Units Fuel Distribution for the Year 2008 |
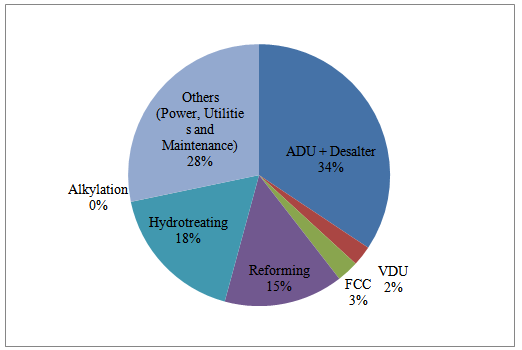 | Figure 9. WRPC Average Process Units Fuel Distribution over the Years |
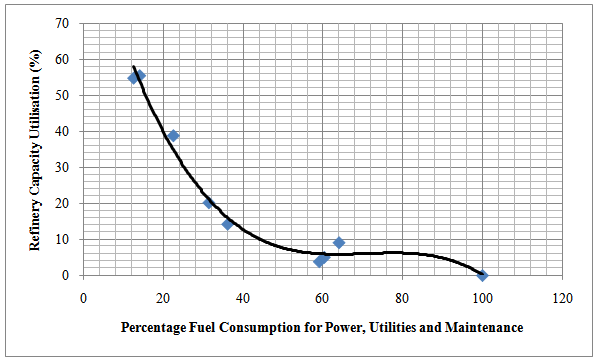 | Figure 10. Relationship between Refinery Capacity Utilisation and Percentage Fuel Utilisation for Power, Utilities and Maintenance |
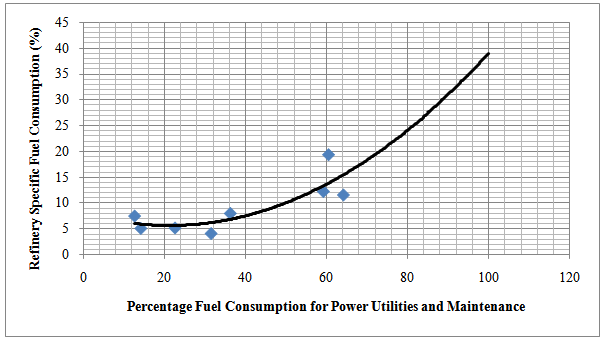 | Figure 11. Relationship between Refinery Specific Fuel Consumption and Percentage Fuel Consumption for Power, Utilities and Maintenance |
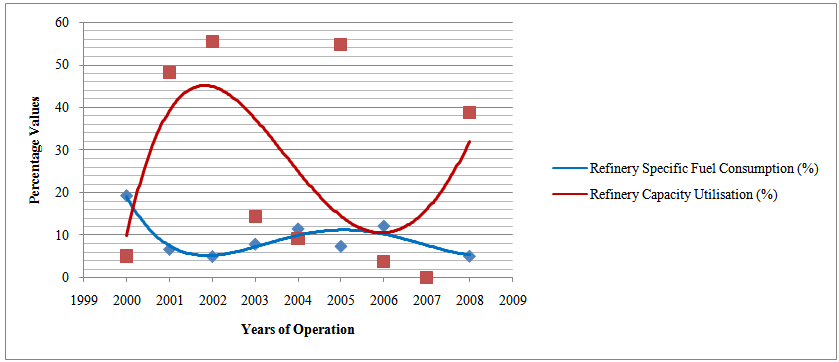 | Figure 12. Relationship between Refinery Capacity Utilisation and Specific Fuel Consumption |
4. Discussion of Results
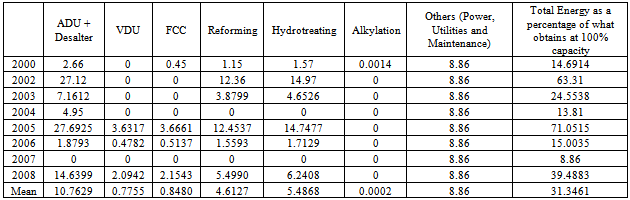
- There are indications from WRPC annual technical reports that considerable quantities of energy are consumed annually for other purposes. For instance, in the year 2000, with annual capacity utilisation of 5.05%, and specific fuel consumption of more than 19%, it was stated: “there was a high consumption of fuel oil as a result of low production and high utilisation of fuel oil in maintaining the system”[14]. In the year 2007, when there was no refining process whatsoever due to Escravos crude oil pipeline vandalisation, a total of 38,334 metric tonnes of various types of fuel was consumed[20]. This quantity of fuel consumption solely for ‘other’ purposes is quite enormous but justifiable when one considers the submissions of several authors on possible causes. Firstly, energy is consumed in system start-ups generally [22]. Secondly, energy consumed by a refinery system increases as the system ages. This age factor is very important considering the fact that WRPC was commissioned in September 1978 with an initial capacity of 10,000 barrels per stream day of crude oil. It was debottlenecked in 1987 to the present capacity of 125,000 barrels per stream day. This energy loss due to aging is frequently associated with fouling[23]. In the Netherlands for instance, with a refinery energy use of 6% of energy content of crude oil, fouling mitigation is about 2% of total fuel use[24]. This is 33% of refinery use of energy content of crude oil. Other researchers say: “Based on experience, energy consumption is 10% to 20% higher due to fouling” [25]. Odigure et al[26] investigated quality of water used in boilers of refining companies in Nigeria. The results show that the quality of water fed to the boilers is low and off specification, leading not only to fouling but also to frequent failure of the boilers as a result of tube rupture. Of course, heat exchanger tube fouling increases fuel consumption while tube rupture leads to frequent breakdown maintenance, long downtimes and low time efficiency and capacity utilisation. The poor performance of the boiler feed treatment plant is attributable to the deplorable condition of water intake plant, raw water treatment, demineralization plant, change in raw water quality and non-functioning of the polisher unit. On the other hand, poor maintenance of the Nigerian government-owned refineries led to a drastic fall of production level to 15 % of the total installed capacity in 2004[10]. In this same year, the capacity utilisation share of WRPC was 9.12% (Table 3 and Fig. 12). Thirdly, energy is totally internally sourced in Nigerian refineries. There is no externally purchased steam or electricity. The fuel consumption is thus utilised to:(a) generate electricity using Steam Turbine Generators (STGs), Gas Turbine Generators (GTGs) and Diesel Generators(b) raise steam for general plant use(c) fire heaters for process heat generation(d) cook food in the staff canteen(e) start-up systems generally and maintain them even during downtimes Out of the five uses enumerated above, only (b) and (c) may be drastically reduced when the plants are shut down. For as long as the refinery still opens for business, whether the plants are running or not, electricity would still be utilised and the staff canteens patronised. However, process steam and fuel consumption may go down depending on the level of activities in the plant. Since processed/refined crude is the primary commodity for which the refinery exists, it is customary to “bill” the refined and/or processed crude for all the energy consumed. This explains why the specific energy consumption goes up when the capacity is underutilised since the quantity of crude processed (the numerator in equation (1) and the denominator in equation (2)) would then be low. This corroborates findings of authors like White[13] who observe that specific energy use is higher at low capacity than at high capacities. If one were to quantify the specific fuel consumption in the year 2007 with 0% capacity utilisation, one would have an undefined value (∞)! This can be seen in Fig. 12, using capacity utilisation and specific fuel consumption values within the period of this study. While total fuel consumed at low capacities may be quantitatively low (Table 4), the distribution is usually skewed in favour of secondary uses. It is clear from Table 5 that the energy proportion for maintenance, power and utilities at expected 100% capacity is constant at 8.86% throughout the years. However, the actual proportions in the main process units fluctuate rapidly, due to unfavourable time efficiencies, alkylation unit being the worst hit (0%). Perhaps this is why EnSys Energy & Systems et al[27] assume in their report that in Nigeria, the alkylation units would not run at any time. Table 6 also emphasizes the fact that no process unit attained the design energy utilisation throughout the period under review. However, power, utilities and maintenance have always exacted the full energy consumption. Unfortunately, it is the performances of the process units, especially the CDU that really determine the refinery capacity utilisation levels. Thus we can see the refinery capacity falling as percentage energy utilised for power, utilities and maintenance goes up in Fig. 10. In all the years considered (Fig. 1 – Fig. 8), 2007 has been the worst because all the process units were down throughout the year. Since low capacity utilisation in our case has been caused by unfavourable process units energy pattern, the specific fuel consumption also increases with increase in percentage energy use for power, utilities and maintenance purposes (Fig. 11). Hence, generally, WRPC has been adversely affected by low capacity utilisation which has also been caused by energy utilisation mostly for purposes other than crude refining, the primary purpose. During the selected seven years of study, the capacity utilisation varied from 0% in 2007 when there was absolutely no crude refining throughout the year due to pipeline vandalisation, to a maximum of 54.85% in 2005. This is despite the fact that the international benchmark for capacity utilisation is 90%[6]. Thus, the 38, 912 metric tonnes of all types of refinery fuels consumed in 2007 all went for system maintenance, Power and Utilities. The importance of this investigation lies in its exposure of where energy is actually utilised most among the various sections/units of the refinery. The average energy consumption distribution over the period of nearly one decade is: Atmospheric Distillation Unit and Desalter: 34%; Power, Utilities and Maintenance: 28%; Hydrotreating: 18%; Reforming: 15%; Fluidised Catalytic Cracking: 3%; Vacuum Distillation Unit: 2% and Alkylation: 0% (Fig. 9). The very sharp difference between this energy distribution and the one for the US refineries in Table 1 is apparent. This is indeed not favourable to efficient and profitable energy consumption as it implies energy consumption for a purpose different from the primary one for which the refinery exists.
5. Conclusions
- The process units energy consumption pattern evaluation carried out over a period of 8 years reveals that the process units have been operating with low time efficiencies, while energy has been consumed mostly for power, utilities and routine system maintenance. This has led to low capacity utilisations and high specific fuel consumption values. It is believed that the results of this investigation would assist the WRPC policy makers in tackling the challenge of low capacity utilisation appropriately.
References
| [1] | Odularu, G. O and Okonkwo, C.[2009]: “Does Energy Consumption Contribute to Economic Performance? Empirical evidence from Nigeria”, Journal of Economics and International Finance, 1.2:44-58.http://www.academicjournals.org/JEIF |
| [2] | Watts, M. 2009. Crude Politics: Life and Death on the Nigerian Oil Fields. Niger Delta Economies of Violence Working Papers, Institute of International Studies, University of California, Berkeley, The United States Institute of Peace, Washington, DC, Paper No. 25. |
| [3] | EIA Country Analysis Briefs (2011): “Nigeria”, Aug. 2011, retrieved on April, 28, 2012 from www.eia.doe.gov |
| [4] | Iwayemi, A[2008]: “Nigeria’s Dual Energy Problems: Policy Issues and Challenges” Proc. 31st Int. Conf. of International Association for Energy Economics, June 18 – 20, pp. 17 – 21, Istanbul, Turkey |
| [5] | Energy Commission of Nigeria (ECN)[2003]: “National Energy Policy”, The Presidency, April 2003 |
| [6] | Oniwon, A[2011]: “Oil and gas in Nigeria's national development: an assessment”, A presentation at the National Defence College, Abuja |
| [7] | Maconachie, R, Tanko, A. S and Zakariya, M[2009]: “Descending the Energy Ladder? Oil Price Shocks and Domestic Fuel Choices in Kano, Nigeria”, Land Use Policy, Vol. 26, pp. 1090 – 1099 |
| [8] | Adelekan, I. O and Jerome, A. T[2006]: “Dynamics of Household Energy Consumption in a Traditional African City, Ibadan”, Environmentalist, Vol. 26, pp. 99 – 110 |
| [9] | Badmus, I., Oyewola, O. M and Fagbenle, R. O.[2012]: “A Review of Performance Appraisals of Nigerian Federal Government-Owned Refineries” Energy and Power Engineering. Vol. 4, pp. 47-52, doi:10.4236/epe.2012.41007, http://www.SciRP.org/journal/epe |
| [10] | Aigbedion, I and Iyayi, S. E[2007]: “Diversifying Nigeria’s Petroleum Industry”, International Journal of Physical Sciences, Vol. 2, No 10, pp. 263 – 270 |
| [11] | Rambakus, Z and Moodley, M.[2009]: “A Just-In-Time Approach to Refining”, Proc South African Sugar Technology Association. 82: 278 – 293 |
| [12] | Worrell, E, and Galitsky C.[2004]: “Profile of the Petroleum Refining Industry in California”, California Industries of the Future Program, Energy Analysis Department,Environmental Energy Technologies Department, Berkeley, USA |
| [13] | White, D. C.[2005]: Advanced automation technology reduces refinery energy costs. Oil & Gas Journal. October 3, PennWell Corporation |
| [14] | WRPC Annual Technical Report and Material Balance, 2000, Warri Refining and Petrochemical Company Limited, Ekpan-Warri, Nigeria |
| [15] | WRPC Annual Technical Report and Material Balance, 2002, Warri Refining and Petrochemical Company Limited, Ekpan-Warri, Nigeria |
| [16] | WRPC Annual Technical Report and Material Balance, 2003, Warri Refining and Petrochemical Company Limited, Ekpan-Warri, Nigeria |
| [17] | WRPC Annual Technical Report and Material Balance, 2004, Warri Refining and Petrochemical Company Limited, Ekpan-Warri, Nigeria |
| [18] | WRPC Annual Technical Report and Material Balance, 2005, Warri Refining and Petrochemical Company Limited, Ekpan-Warri, Nigeria |
| [19] | WRPC Annual Technical Report and Material Balance, 2006, Warri Refining and Petrochemical Company Limited, Ekpan-Warri, Nigeria |
| [20] | WRPC Annual Technical Report and Material Balance, 2007, Warri Refining and Petrochemical Company Limited, Ekpan-Warri, Nigeria |
| [21] | WRPC Annual Technical Report and Material Balance, 2008, Warri Refining and Petrochemical Company Limited, Ekpan-Warri, Nigeria |
| [22] | California Energy Commission.[2004]: “Energy Efficiency Roadmap for Petroleum Refineries in California” Columbia, Maryland. Energetics Incorporated |
| [23] | Szklo, A and Schaeffer, R.[2007]: “Fuel Specification, Energy Consumption and CO2 Emission in Oil Refineries” Energy. 32: 1075 – 1092 |
| [24] | Alsema, E.[2001]: “ICARUS-4 Sector Study for the Refineries”, Report prepared for the Utrecht Centre for Energy Research (UCE), as a part of project nr. EB/99044645, contracted by Netherlands Ministry of Economic Affairs, Netherlands Ministry of Housing Spatial Planning & Environment, Report nr. NWS-E-2001-26, ISBN 90-73958-77-6 |
| [25] | Sikos, L and Klemeš, J.[2009]: “Reliability, Availability and Maintenance Optimisation of Heat Exchanger Networks” Applied Thermal Engineering.30.1.63:DOI:10.1016/j.applthermaleng.2009.02.013 |
| [26] | Odigure, J. O, Abdulkareem, A. S and Asuquo, E. T.[2005]: “Effect of Water Quality on the Performance of Boiler in Nigerian Petroleum Industry”, Leonardo Electronic Journal of Practices and Technologies, 4.7: pp. 41-48 |
| [27] | EnSys Energy & Systems, ICF International, Hammitt, J and Robinson, L[2009]: “Sub-Saharan Africa Refinery Study”, Extractive Industries for Development Series #12, July 2009, Energy Sector Management Assistance Program and The World Bank |