Jagannath Hirkude1, 2, Atul Padalkar3, Shafee Shaikh1, Avil Veigas1
1Department of Mechanical Engineering, Padre Conceicao College of Engineering, Goa, 403722, India
2Department of Mechanical Engineering,Sinhgad College of Engineering Pune, 411041, India
3Department of MechanicalEngineering, Flora Institute of Technology, Pune, 412 205, India
Correspondence to: Jagannath Hirkude, Department of Mechanical Engineering, Padre Conceicao College of Engineering, Goa, 403722, India.
| Email: |  |
Copyright © 2012 Scientific & Academic Publishing. All Rights Reserved.
Abstract
Aim of present work is to experimentally investigate the effect of compression ratio (CR), blend and load on performance of single cylinder water cooled naturally aspirated direct injection diesel engine operated with Waste Fried Oil Methyl Ester (WFOME) blended with mineral diesel. Biodiesel derived from waste fried oil through transesterification process, blended with mineral diesel was used as alternate fuel in this work. Compression ratios considered for this analysis were 14.5, 16.5 and 17.5. A statistical tool known as Design of Experiments (DoE) based on response surface methodology (RSM) was used to design experiments. Input parameters considered were CR, Blend and load on the engine. The resultant models of the response surface methodology were found helpful to predict the response parameters such as Brake Specific Fuel Consumption (BSFC), Brake Thermal Efficiency (BTE), Exhaust Gas Temperature (EGT), Carbon monoxide (CO), particulate matter (PM) and Nitrogen Oxides (NOx) to identify the significant interactions between the input factors on the responses. Prediction of optimal input parameters for better performance and lower emissions was performed using the desirability approach of RSM. The model test results were validated experimentally and it was observed that response parameters were in good agreement with predicted values.
Keywords:
Waste Fried Oil Methyl Esters, Performance, Response Surface Methodology
Cite this paper: Jagannath Hirkude, Atul Padalkar, Shafee Shaikh, Avil Veigas, Effect of Compression Ratio on Performance of CI Engine Fuelled with Biodiesel from Waste Fried Oil Using Response Surface Methodology, International Journal of Energy Engineering, Vol. 3 No. 5, 2013, pp. 227-233. doi: 10.5923/j.ijee.20130305.01.
1. Introduction
The exhaustion of world crude oil reserves and increased ecological concerns has motivated recent interest in alternative sources for petroleum-based fuels. Biodiesel created from vegetable oil or animal fats by transesterification is recommended for use as a substitute for petroleum-based diesel. This is mainly because biodiesel is an oxygenated, renewable, biodegradable, environmentally friendly fuel with similar flow and combustion propertiesas mineral diesel [1, 2]. It has been shown by many researchers that the vegetable oil based fuels can significantly reduce exhaust gas emissions, like Carbon Monoxide (CO), Carbon Dioxide (CO2), Particulate Matter (PM) and Sulfur Dioxide (SO2).[3-5]. The prospect of waste fried oil based biodiesel is very attractive for energy conversion in a developing country like India. Cost of biodiesel from waste fried oil was Rs. 24.20 per liter as against subsidized market price of diesel approximately Rs. 40 per liter[6].Raheman and Ghadge analyzed the performance of diesel engine using biodiesel and its blends with diesel at various compression ratios (18, 19 and 20:1). Their results showed that BSFC decreased, whereas BTE and exhaust gas temperature increased with the increase in the CR[7]. Laguittonet al. studied the effect of CR on the emissions of a diesel engine. They found that, although there was a small CO and HC penalty, either reducing the CR or decreasingthe ignition timing greatly reduced NOx emissions[8].Win et al.used Response Surface Method (RSM) to optimize the parameter like load, speed and static injection timing of a diesel fueled CI engine to reduce noise, fuel consumption and exhaust emissions[9]. Lee and Reitzused RSM to optimize a high speed direct injection diesel engine equipped with a common rail injection system neglecting the interactive effects of the parameters[10]. Satake et al. performed the rapid development of diesel engines using RSM based optimization of the fuel injection control[11]. Although few studies were reported using DoE in internal combustion Engine applications, the study on combined effects between input parameters such as compression ratio, blends and load on the performance and emission characteristics of CI engine arerarely available. Thus in present work, the objective is to study the individual and combined effects of Compression ratio with WFOME blends and load on the performance and emissions of the diesel engine using RSM. Other objective of present work is to investigate appropriate input parameters for optimal output response parameters. In the present work, RSM based desirability approach is used for optimization of input parameters .
2. Methodology
2.1. Preparation of WFOME Blends
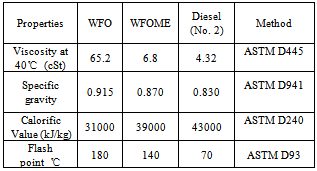
The raw material (i.e. waste fried oil) was collected from different hotels in Goa, a premier tourist destination in India. Biodiesel was produced from collected waste fried oil using transesterification process. Transesterification process outputs were 85% methyl ester, glycerin 9%, and recovered methanol 6%. The properties of the WFOME and diesel have been determined as per the ASTM standards in an industrial testing and analytical laboratory, established at Goa, India. The properties are tabulated in Table 1.The blends prepared for testing purpose were B50 (50% biodiesel + 50% mineral diesel), B70 (70% biodiesel + 30% mineral diesel), B0 (100% mineral diesel).
2.2. Experimentation
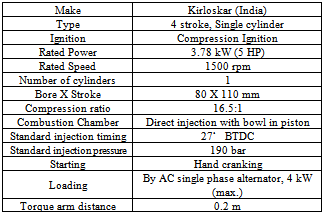
Typical engine extensively used in the agricultural segment in developing countries, has been selected for the present experimental analysis. The engine was provided with suitable arrangements, which permitted wide variation of controlling parameters. This unit is manufactured by Ind Labs Equipments Bangalore, India. The major specifications of the engine used for investigations are presented in Table 2. Compression ratios considered for this analysis were 14.5, 16.5 and 17.5. The variation in CR of this engine was achieved by raising or lowering the cylinder block relative to the crankshaft with help of power screw. Movement of the cylinder was measured by means of a micrometer. The experimental set up consists of a single cylinder diesel engine, air metering unit, fuel measuring equipment, exhaust gas analyzer and thermocouples with temperature indicator. The experimental set up is shown in Figure 1.Table 1. Properties of various fuels
 |
| |
|
Table 2. Engine specifications
 |
| |
|
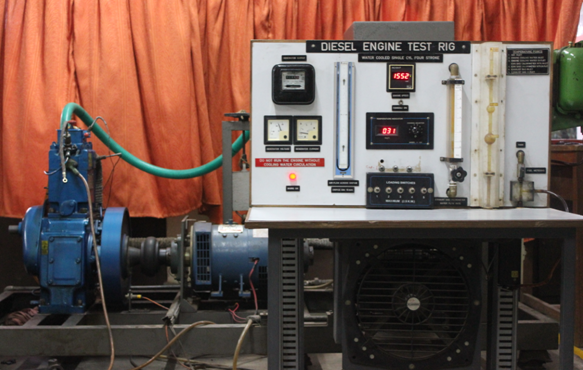 | Figure 1. Engine Test rig |
Table 3. Standards used for emission analysis
 |
| |
|
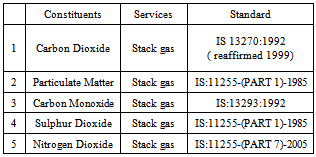
All the tests with different fuels were conducted for constant engine speed of 1500 rpm and with varying load on engine. The engine was coupled with a single phase, 220 V AC alternator. The alternator was used for loading the engine through a resistive load bank. The load bank consists of eight heaters of 500 W each. The load was varied from 0.5 kW to 4 kW in step of 0.5kW. The specific fuel consumption was calculated by measuring the time taken for a fixed volume of fuel to flow into the engine. The torque was measured using swinging field electrical dynamometer. The engine speed (rpm) was measured by electronic digital counter. The reading was taken three run times for each run and the average value was used to calculated performance parameters. The performance parameters like BTE and BSFC were calculated from measured data. EGT was measured by using an electronic digital indicator with iron-constantan thermocouple. Emission analysis was carried for exhaust gas emissions particulate matter, NOX, and CO. A sample gas was contacted successively by a series of chemically reactive solutions. A levelling bulb was used to adjust all gas volume measurements to atmospheric pressure. Indian standards used for emission analysis are presented in Table 3.
2.3. Response Surface Methodology
RSM was applied in the present study for modeling and analysis of response parameters in order to obtain the performance and emission characteristics of the engine. The analysis involved the following steps:1. The first step was the selection of the parameters that influence the performance and emission characteristics. In this study, CR, Load and blend were considered as the input parameters. The output parameters (responses) selected were BTE, BSFC, EGT, CO, PM and NOx2. The compression ratio (denoted by “CR”) was varied at three levels (14.5, 16.5 and 17.5). The biodiesel-diesel blend (denoted by “B”) too was varied at three levels (B50, B70 and B0). The brake load (denoted by “L”) was varied at eight levels from 0.5 kW to 4 kW in step of 0.5 kW. Emission parameters were tested at rated brake load of 3.5 kW. 3. The design matrix was selected based on the historical data of response surface methodology generated from the software ‘‘Design expert’’ trial version 8.0.7.1 of Stat ease, US, which contains 72 experimental runs. As per run order, the experiments were performed on the engine and the responses were tabulated in the design matrix.4. Using statistically significant model, the correlation between the process parameters and several responses were obtained. With help of a multiple regression analysis the coefficients and the equations were used to predict the responses.5. Finally, the optimal input parameters for better performance and less emissions were analyzed by using the desirability approach of RSM.
2.4. RSM Model Analysis
The experimental readings were fitted to the second order polynomial equation using design of expert software. The quadratic models for the response were developed in terms of actual factors and are given below as equations (1) – (6) | (1) |
 | (2) |
 | (3) |
 | (4) |
 | (5) |
 | (6) |
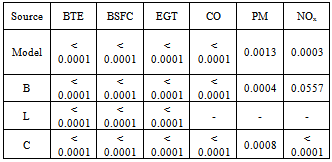
The principal model analysis was based on the Analysis of Variance (ANOVA) which provides numerical information for the p value. The ANOVA for different response parameters is tabulated in Table 4. The models found to be significant as the values of P were less than 0.05. Table 4. ANOVA for various responses indicating Values of "Prob> F"
 |
| |
|
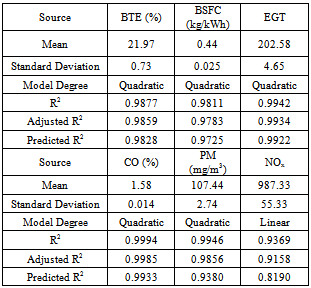
The regression statistics goodness of fit (R2) and the goodness of prediction (Adjusted R2) are presented in Table 5 for all the responses. The R2 value indicates the total variability of the response after considering the significant factors. The Adjusted R2 value accounts for the number of predictors in the model. Both the values indicate that the model fits the data very well.Table 5. RSM model evaluation
 |
| |
|
3. Results and Discussion
3.1. Interactive Effect of Blend and Load on Performance Parameters
Figure 2 shows the interactive effect of load and blend on BTE. BTE increased with lower proportion of WFOME in the blend. Oxygen present in the fuel molecules improves the combustion characteristics but higherviscosity and poor volatility of WFOME lead to their poor atomization and combustioncharacteristics. Therefore, BTE was found lower for higher blend concentrations compared to that of mineral diesel. Figure 3 shows interactive effect of load and blend on BSFC, the minimum BSFC was observed at rated power output for all fuels. BSFC increasedwith higher proportion of WFOME in the blend compared to diesel for all loads. Figure 4 shows effect of load and blend on EGT. The exhaust gas temperature with blends having higher percentage of WFO Methyl ester was higher.As WFOME contains constitutes of poor volatility, which is burning during the late combustion phase. Higher density, higher viscosity and poor volatility would have resulted in higher exhaust gas temperature and BSFC. Increasing the brake load from 0.5 kW to 4 kW increased BTE and reduced BSFC. This could be because of relatively less portion of power was lost with increase in load. The exhaust gas temperature increased with increase in load. This could be due to more fuel burnt to meet the power requirement at higher loads.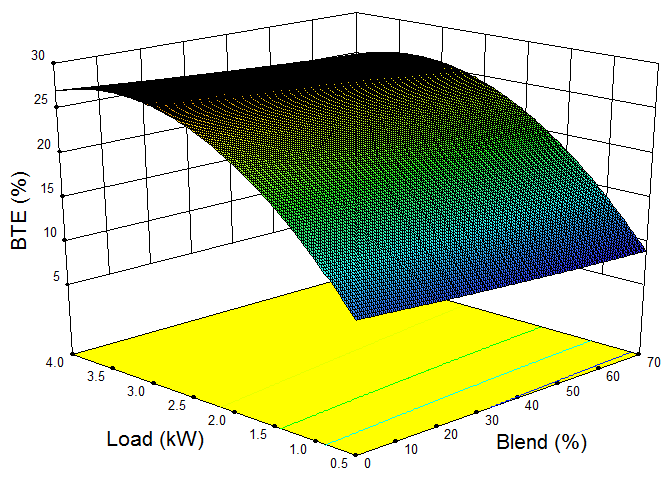 | Figure 2. BTE variations against WFOME blend and brake load |
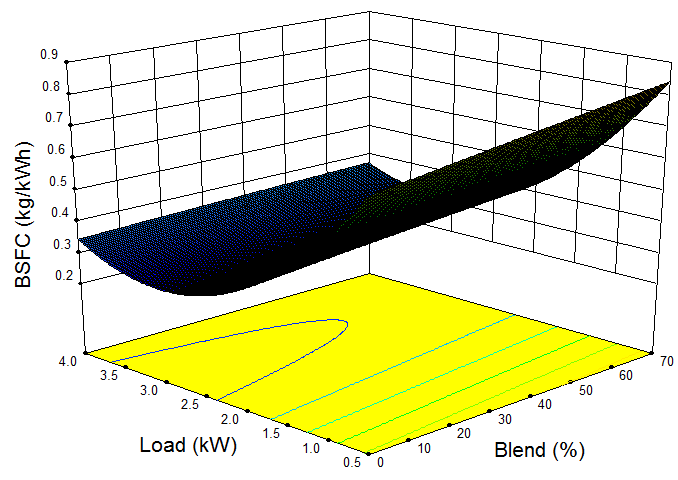 | Figure 3. BSFC variations against WFOME blend and brake load |
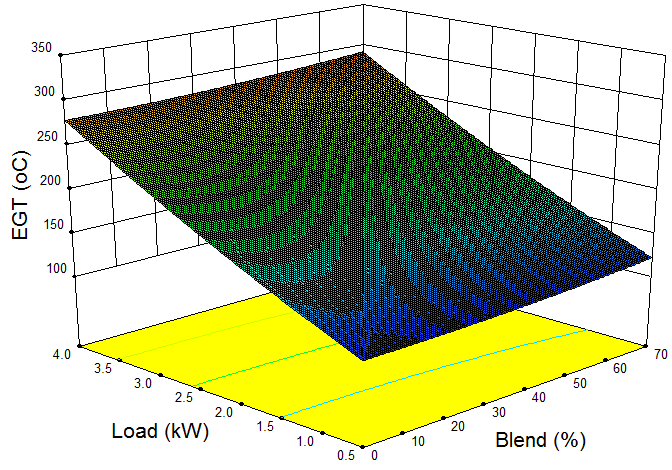 | Figure 4. EGT variations against WFOME blend and brake load |
3.2. Interactive Effect of CR and Load on the Performance
The interactive effect of CR and load on BTE, BSEC and EGT are shown in Figures 5-7. As seen in figure 5, BTE increases with increase in CR. As illustrated in figure 6 the BSFC was found decreasing with increase in CR.Increase in BTE (and reduction in BSFC) with increase in CR could be attributed to enhancement of density of intake air and reduction in ignition delay associated with it.Increase in CR improves brake thermal efficiency of the engine. The mean BTE increased by 8.61% when CR was raised from 16.5 to 17.5. The exhaust gas temperature increased with increase in load because more fuel was burnt to meet the power requirement (figure 7). Maximum EGTs observed were 315℃, 309℃ and 305℃ for B70, B50 and B0 respectively when operated at 17.5 CR.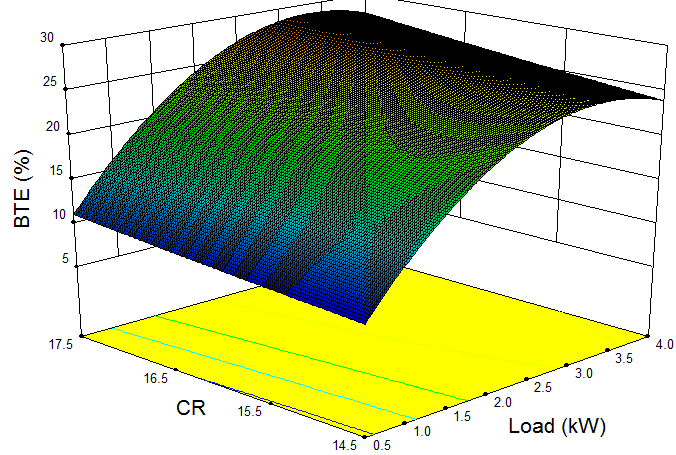 | Figure 5. BTE variations against CR and brake load |
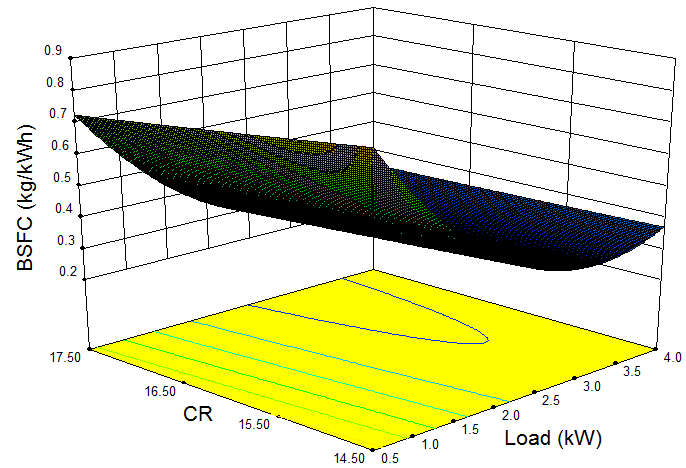 | Figure 6. BSFC variations against CR and brake load |
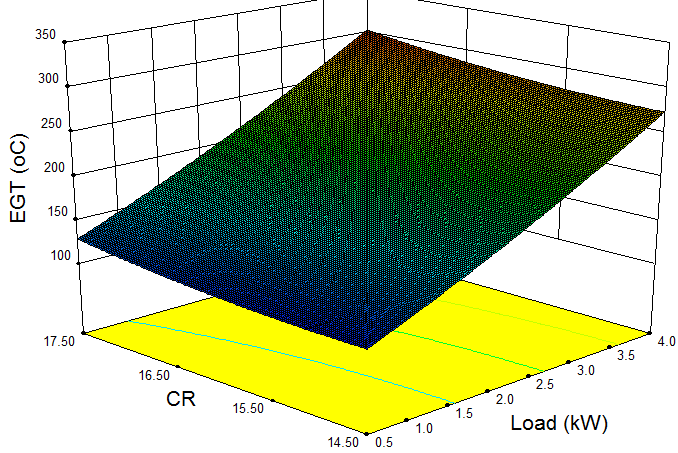 | Figure 7. EGT variations against CR and brake load |
3.3. Interactive Effect of CR and Blend on the Performance Parameters
Figs. 8–10 showed the interactive effect of compression ratio and WFOME blend over BTE, BSEC and EGT. Figs. 8–10 revealed that the BTE and EGT were increased while BSFC was decreased on the advancement of compression ratio for all blends since operating temperature is more when engine operates at higher compression ratio. The change in CR from 16.5 to 17.5 resulted in 5.41%, 6.59% and 7.25% increase in BTE in case of B70, B50 and B0 respectively. 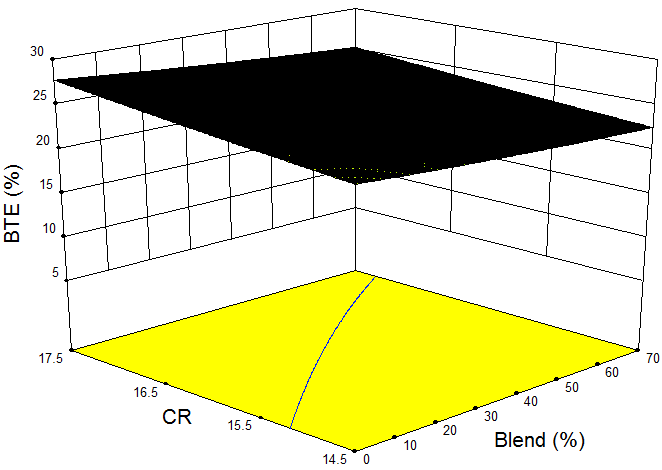 | Figure 8. BTE variations against CR and blend |
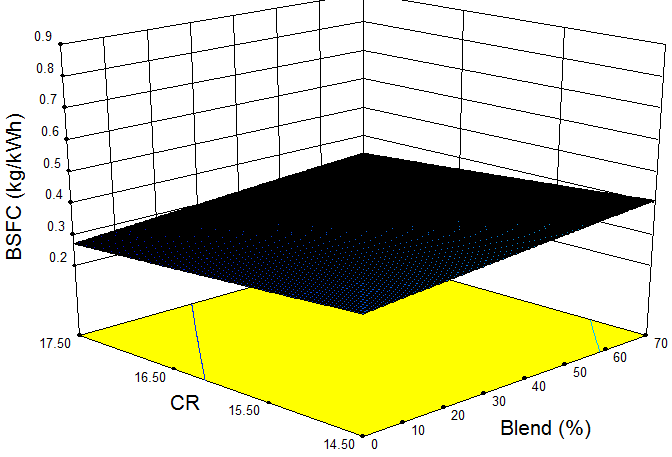 | Figure 9. BSFC variations against CR and blend |
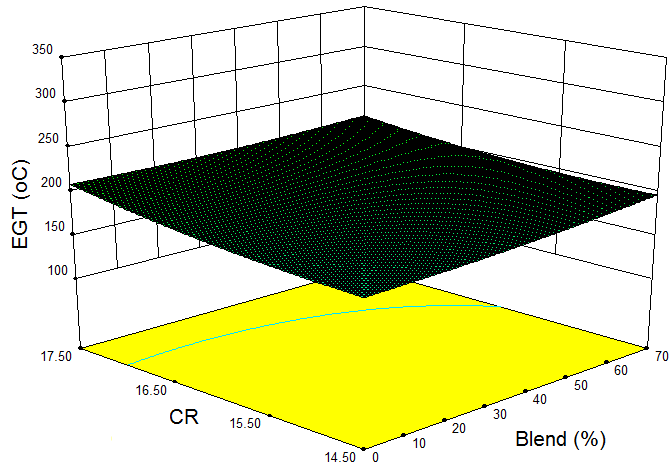 | Figure 10. EGT variations against CR and blend |
3.4. Interactive Effect of Blends and CR on Emissions at Rated Output
Emission analysis of diesel engine for different blends and compression ratios was carried out at rated loading condition (3.5 kW). The interactive effect of compression ratio and WFOME blends on CO, PM and NOx are shown in Figs. 11–13respectively. As the biodiesel blend increased from B0 to B70, there was a reduction in CO and PM emission with increase in NOx emissions. This was because additional oxygen content in biodiesel enhances complete combustion of the fuel and its higher cetane number. The least percentage of particulate matter was observed with B70. NOx emission was increased with increase in WFOME concentration in the blend because of advancement of injection process with biodiesel. With the increase of CR, maximal cylinder pressure was increasing for the same injection timing. This undesirable increase in maximum pressure is followed by relatively improved atomizing of large amount of fuel in the cylinder under higher pressure and engine temperature. Improved conditions for combustion process may be attributed to reduction of emission levels at higher CR with biodiesel blends. CO concentration of the engine with the biodiesel blends decreases with the increase CR. At lower CR, insufficient heat of compression delays ignition and so PM and CO emissions increases. Other possible reason for reduction in CO and PM could be that the increased CR actually increases the air temperature inside the cylinder therefore reducing the ignition lag causes better and more complete burning of the fuel. With the increase in CR, the temperature reached is also high and this effect increased NOx emissions. The NOX increase for WFOME may be associated with the oxygen content of the WFOME, since the oxygen present in the fuel may provide additional oxygen for NOX formation. An alternate factor causing the increase in NOX could be the higher peak temperatures for WFOME and its blends compared to diesel. However NOX can be reduced by adopting exhaust gas recirculation and by employing appropriate catalytic converters.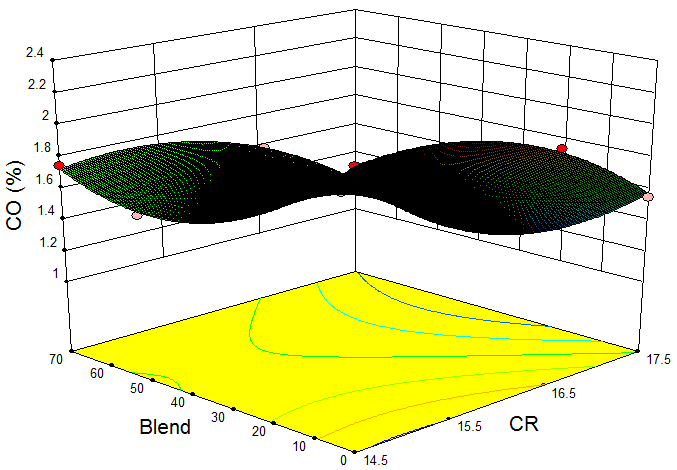 | Figure 11. CO variations against CR and Blend |
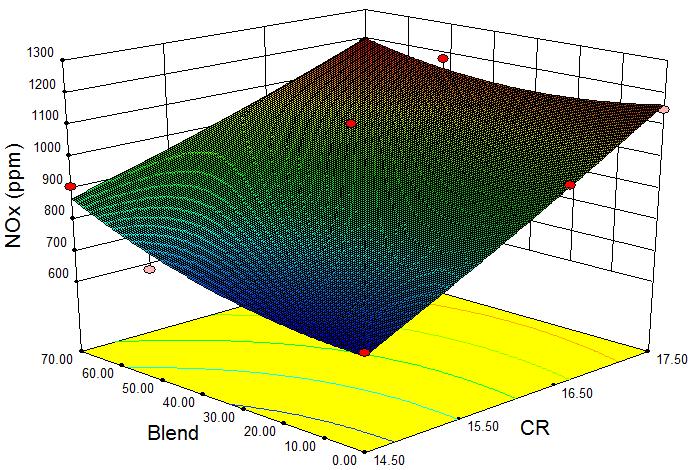 | Figure 12. NOX variations against CR and Blend |
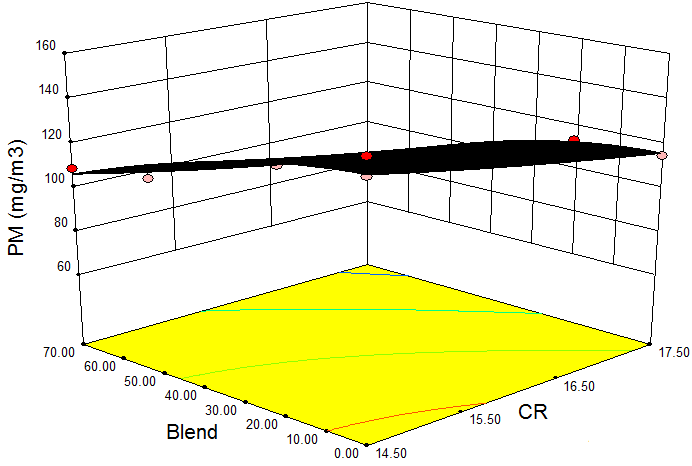 | Figure 13. PM variations against CR and Blend |
3.5. Optimization
Optimization of experimental work has been carried out separately for performance parameters and emission parameters. Emission analysis has been carried out only at rated load. In desirability based approach, different best solutions were obtained. The solution with high desirability is preferred. Optimization of performance parameters at maximum desirability of 0.911 was observed at B0 and 2.15 kW with compression ratio of 15.8. The predicted performance responses for optimal input parameters obtained were 25.23% (BTE), 0.318 kg/kWh (BSFC) and 180.7oC (EGT). Maximum desirability of 0.943 was obtained at the input system parameters like 57% of WFOME blend (B57) and 14.5 CR which could be considered as the optimum parameters for minimum emissions at rated power output (at 3.5 kW brake load) at 1500 rpm. The predicted responses in terms of emission parameters for optimal input parameters obtained were 1.6 % (CO), 113.53 mg/m3 (PM) and 787.43 ppm (NOx).
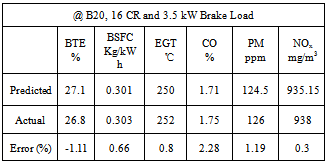
3.6. Validations of Test Results
In order to validate the test results, the experiments were performed thrice at the input parameters of B20 (blend), 3.5 kW (Load) and 16 (CR). For the actual responses, the average of three measured results was calculated. Summary of the predicted values, the average of experimentally calculated values and percentage of error is presented in Table 6. The validation of results indicated that the models developed were quite accurate as the percentage of error in prediction was in a good agreement.Table 6. Validation of test results
 |
| |
|
4. Conclusions
In this study, the effect of input parameters (CR, Load and Blend) on the improvement in performance and reduction of exhaust emissions were investigated on a single cylinder diesel engine. The conclusions of this work based on the results of this study are as follows:• Compression ratio, biodoesel blend and load influences performance and emission characteristics of the engine.• Increase in compression ratio increases brake thermal efficiencies for all blends. The brake specific fuel consumption increases with increase in WFOME in the blends. It was observed that exhaust gas temperature increased with increase in WFOME in the blends. • With increase in CR reduction in emission parameters like CO and PM were observed. Further reduction in CO and PM was observed with increase in WFOME blend in diesel. But NOx emission increases with increase in CR because of high temperature level at higher CR.• Desirability approach of RSM found extremely efficient optimization technique to optimize input parameters.• Optimal input parameters for performance were observed at B0 and CR of 15.8. While Minimum level of exhaust emission were observed at B57 and CR of 14.5.• It can be concluded from this paper that B30 at 3 kW loading condition could be could compromise to run the engine (of CR -16.5) with WFOME. • Validation of test result showed that developed models were quite accurate and in good agreement.• Further effect of some other important parameters like injection pressure and injection timing along with compression ratio should be analyzed.
References
| [1] | R. Altin, C. Selim, 2001, The potential of using vegetable oil fuels as diesel engines, Energy Convers. Manag., 45, 529–538. |
| [2] | H. Fukuda, A. Kondo, H. Noda, 2001, Biodiesel fuel production by transesterification of oils, Journal of Bioscience and Bioengineering, 95, 405–416. |
| [3] | M. S. Graboski, R. L. McCormick, 1998, Combustion of fat and vegetable oil derived fuels in diesel engines, Prog. Energy Comb. Sci., 24, 125-164. |
| [4] | M. E. Gonzalez Gomez, R. Howard-Hildige, J. J. Leahy, T. O’reilly, B. Supple, M. Malone, 2000, Emission and performance characteristics of a 2 litretoyota diesel van operating on esterified waste cooking oil and mineral diesel fuel,Environmental Monitoring and Assessment, 65, 13–20. |
| [5] | T. Murayama, 1994, Evaluating vegetable oils as a diesel fuel, INFORM, 5, 1138 – 1145. |
| [6] | Jagannath Balasaheb Hirkude, Atul S. Padalkar, 2012, Performance and emission analysis of a compression ignition Engine operated on waste fried oil methyl esters,Applied Energy, 90, 68–72. |
| [7] | H. Raheman, S.V. Ghadge, 2008, Performance of diesel engine with biodiesel at varying compression ratio and ignition timing, Fuel, 87, 2659-2666. |
| [8] | O. Laguitton, C. Crua, T. Cowell, M.R. Heikal, M.R. Gold, 2007, The effect of compression ratio on exhaust emissions from a PCCI diesel engine, Energy Conversion and Management, 48, 2918-2924. |
| [9] | Win Z, Gakkar RP, Jain SC, Bhattacharya M., 2005, Parameter optimization of a diesel engine to reduce noise, fuel consumption, and exhaust emissions using response surface methodology,ProcInstMechEng Part D: J Automobile Engg., 219, 1181–92. |
| [10] | Lee T, Reitz RD., 2003, Response surface method optimization of a high speed directinjection diesel engine equipped with a common rail injection system, ASME JEng Gas Turbines Power, 125, 541–6. |
| [11] | Satake K, Monaka T, Yamada S, Endo H, Yamagisawa M, Abe T., 2008, The rapiddevelopment of diesel engine using an optimization of the fuel injectioncontrol, Mitsubishi Heavy Industries Limited, Tech. Rev., 45, 6–10. |
 Abstract
 Reference
 Full-Text PDF
 Full-text HTML