-
Paper Information
- Paper Submission
-
Journal Information
- About This Journal
- Editorial Board
- Current Issue
- Archive
- Author Guidelines
- Contact Us
International Journal of Energy Engineering
p-ISSN: 2163-1891 e-ISSN: 2163-1905
2013; 3(3): 190-199
doi:10.5923/j.ijee.20130303.10
Fuel-Mix and Energy Utilisation Analysis of Kaduna Refining and Petrochemical Company, Nigeria
 Abstract
 Reference
 Full-Text PDF
 Full-text HTML
Badmus I 1, Fagbenle R. O 2, Oyewola M. O 1
1Mechanical Engineering Department, University of Ibadan, Nigeria
2Adjunct Professor, University of Ibadan, Ibadan, Nigeria; and Professor, Obafemi Awolowo University, Ile-Ife, Nigeria
Correspondence to: Badmus I , Mechanical Engineering Department, University of Ibadan, Nigeria.
| Email: |  |
Copyright © 2012 Scientific & Academic Publishing. All Rights Reserved.
This paper analyses the fuel-mix and energy utilisation patterns in Kaduna Refining and Petrochemical Company from the years 2000 to 2011. The average fuel-mix over the 12-year period is 9% Refinery Fuel Gas, 8% Liquefied Petroleum Gas, 79% Low Pour Fuel Oil, 1% Coke and 3% Automotive Gas Oil. The refinery has been discovered to have specific fuel consumption ranging from 11.32% to 53.92%, aside from the year 2007 when there was no crude processed due to pipeline vandalisation, leading to an undefined value of specific fuel consumption. The two main factors responsible for high specific fuel consumption in the refinery have been low capacity utilisation and poor fuel mix. It is proposed that Low Pour Fuel Oil be substituted with natural gas in order to reduce the specific fuel consumption as well as combustion products CO2 production. The capacity utilisation has also been recommended to be boosted.
Keywords: Kaduna, Fuel-Mix, Capacity Utilisation, Refinery, NNPC
Cite this paper: Badmus I , Fagbenle R. O , Oyewola M. O , Fuel-Mix and Energy Utilisation Analysis of Kaduna Refining and Petrochemical Company, Nigeria, International Journal of Energy Engineering, Vol. 3 No. 3, 2013, pp. 190-199. doi: 10.5923/j.ijee.20130303.10.
Article Outline
1. Introduction
- Nigeria has four domestic refineries, with a total capacity of 445,000 barrels per day. At the top of the petroleum industry is the Federal Government – owned Nigerian National Petroleum Corporation (NNPC) that operates joint venture agreements with some foreign multi-national oil companies in Nigeria to produce the nation’s oil and gas. Kaduna Refining and Petrochemical Company (KRPC) is an integrated type of refinery commissioned in 1980. It has a total capacity of 110,000 barrels per stream day, which is 25% of all NNPC refining capacity[15]. Despite the oil fortune, Nigeria is a net importer of refined petroleum products. This situation has led to very unstable petroleum products price regimes in the country, forcing poor Nigerians to ‘descend the energy ladder’ in looking for cheaper fuel alternatives to satisfy their domestic energy needs with the attendant negative environmental effects[1,16]. Aigbedion and Iyayi[2] observe that: “The sub-sector has also been constrained by the unenviable state of the nation’s refineries which have been producing at minimal capacities in the past few years, despite huge expenses incurred on the Turn Around Maintenance of the crisis – ridden refineries. This development has led to massive importation of petroleum products to fill demand gaps that exist in domestic consumption”. Importation of refined petroleum products obviously increases their pump prices. For instance, the Petroleum Products Pricing Regulation Agency (PPPRA) pricing templates are a function of the exchange rate of Nigerian Naira to the US Dollar, landing costs and distribution margins. The landing cost, which accounts for most of the cost, is the cost of imported products delivered into the jetty depots[34]. In contrast, the Venezuelan Petroleum Corporation (PDVSA), which was established about the same time as NNPC as a public corporation has grown to be the third largest international conglomerate and also a net exporter of refined petroleum products[31]. As observed by Iwayemi[12], despite the fact that Nigeria has domestic refineries owned by the government with capacity to process 445,000 barrels of oil per day, the country still imports more than 75% of petroleum products requirements for local consumption. Collecting data from both Warri and Kaduna refineries, Eti et al[8] appraised the Nigerian petrochemical industry from engineering management viewpoint within the period 1997 – 2001, observing that: “The results show that the input resources were ineffectively utilized. The installed capacity, designed to be 35,000 metric tonnes/year of polypropylene, has never been reached, while the costs of capital, labour, interest on working capital, energy, and utilities have increased.” Besides, virtually every Nigeria life is affected by availability or otherwise of petroleum products, primarily through transportation but also through household energy use and industrial use which includes operation of internal combustion engines to generate electricity due to the electrical power crisis in the country. However, before these products can be obtained from crude oil it has to pass through the refining process where it is ‘cracked’ into different useful components like Premium Motor Spirit (PMS) or gasoline, Automotive Gas Oil (AGO) or Diesel Oil, Dual Purpose Kerosene (DPK) and others. Since there is no other way of getting these components from crude oil except through this process, the energy consumed during the process is a critical determinant of the final product price in the energy market. The poor state of Nigerian government-owned refineries is reflected in the gap between refinery capacity and refinery output. Practically all researchers believe there is a general decline in the level of technical efficiency at which Nigerian refineries operate. Naturally, inadequate maintenance and technological obsolescence would lead to a general decline in technical efficiency of a system. Perhaps this is why even social scientists like Bamisaye and Obiyan[6] have also advocated urgent repair of Nigeria’s oil refineries. Jesuleye et al[13] analysed energy demand of Port-Harcourt refinery, Nigeria, based on information obtained from its annual publications, backed-up by spot interviews. There is a general dearth of research work on detailed fuel-mix analysis of KRPC. However, there are some works in other areas. For instance, it has been observed as far back as the early 1980s[UNDP/World Bank, 1983] that the overall energy consumption at all three refineries is high, because a substantial quantity of LPG and hydrocarbon gas in excess of normal refinery process energy requirements is flared. Besides, Hart et al[11] observe that although KRPC has been designed to consume 3.75% of crude processed as refinery fuel, it has seldom kept within this limit and most of the time its Fluidised Catalytic Cracking Unit (FCCU) is out of service. Anozie and Odejobi[4] collected the process data of the heat exchanger network in the Crude distillation units of the four refineries in the country and used to them to formulate the Problem Table supplied to HERO software for pinch analysis of the heat exchanger networks. The study revealed that all the refineries need to be retrofitted to improve energy efficiency and operability. Osofisan and Obafaiye[33] developed a fuzzy logic model for the relationship between the vital variables (reactor temperature/ riser outlet temperature, regenerator gas temperature, regenerated catalyst feed rate, and the airflow rate), of KRPC FCCU. Ajao and Akande[3] carried out an energy integration of crude pre-heat train of CDU of the Fuels section of Kaduna refinery and Petrochemicals Company using pinch technology, concluding that there is waste of energy by the Crude pre-heat train. Jibril et al[14] carried out a simulation of the CDU of KRPC Fuels section, concluding that the atmospheric residue had the highest volumetric flow rate, while diesel had the lowest value of volumetric flow rate. This showed that the column needed to be optimized in order to convert more of the atmospheric residue into other premium products like diesel, kerosene and naphtha. Raji et al[35] also carried out optimisation of the KRPC FCCU using HYSYS software and got improved results after optimisation. A general review of performance assessment research works on Nigerian government-owned refineries is in Badmus et al[5]. Energy consumption of a refinery is so important that its specific fuel consumption is one of the main criteria used for assessing its performance. Besides, in order to meet the global demand for environmentally friendly fuel consumption, energy-intensive process industries like petroleum refineries have to reduce their general greenhouse gases emissions and CO2 emissions in particular. Good fuel-mix and energy consumption analyses are a precursor to this green house gases emission reduction. This is because the results of the analyses will enable the decision makers make necessary and appropriate adjustment of the energy mix and consumption to improve utilisation efficiency and reduce green house gas emissions. Despite all these, there is a general dearth of research work on detailed fuel-mix and energy utilisation analyses of KRPC in the open literature. This has motivated the work embarked upon in this paper.
2. Methodology
2.1. Data Collection
- The study employs a quantitative method of analysis through intensive primary data gathering, collation and processing. The required data are obtained from Annual Reports of the government owned refineries and various publications of relevant institutions such as Nigerian National Petroleum Corporation (NNPC) and Department of Petroleum Resources. The aggregated data on overall annual fuel utilization in the refinery have been obtained for a period of twelve years. Interview technique has also been used to elicit information where necessary. An energy analysis (based on1st law of thermodynamics) of the data collected has been done and the results are presented. Apart from this, mass conservation law has also been applied in conjunction with this energy conservation law.
2.2. Theoretical Background
- In applying mass conservation law, the total mass of crude oil processed must be equal to the total mass of various products.
 | (1) |
 | (2) |
 | (3) |
 | (4) |
2.2.1. Heating Value
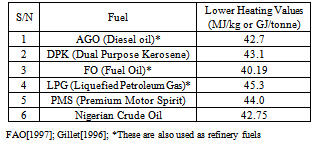
- In practice, the parameter used to determine the energy content of a fuel is its heating value, defined as the amount of heat released when a fuel is burned completely in a steady flow process and the products are returned to the thermodynamic state of the reactants. The heating value is thus equal to the absolute value of the enthalpy of combustion of the fuel:
 | (5) |
2.2.1.1. Higher Heating Value (HHV)
- The heating value is called the higher heating value when the H2O in the products is in the liquid form.
2.2.1.2. Lower Heating Value (LHV)
- This is the heating value when the H2O in the combustion products is in the vapour form. Hence, Higher Heating Value (HHV) and Lower Heating Value (LHV) are related thus:
 | (6) |
|
|
2.2.1.3. Mean LHV
- When a fuel is a mixture of different components with distinct LHV’s, the mean LHV can be derived as follows:Total energy consumed based on LHV of the fuels, is given by:
 | (7) |
 | (8) |
2.2.2. Equivalent Fuel Mass
- It may be necessary to obtain the equivalent mass of a particular fuel that will provide the same quantity of thermal energy as the fuel mixture, as in the case of fuel substitution. For instance, in this paper, a case is made for Natural gas as a fuel substitute. In this case, Eq. Mass of Natural Gas for the same Energy value as in (5) is given by:
 | (9) |
2.2.3. Capacity Utilisation
- This is one other parameter used to assess the performance of systems like the refineries. For the refineries,
 | (10) |
2.2.4. Specific Fuel Consumption
- The specific fuel consumption as used in this work is ratio of fuel utilised per unit mass of crude oil processed expressed as a percentage.
3. Results
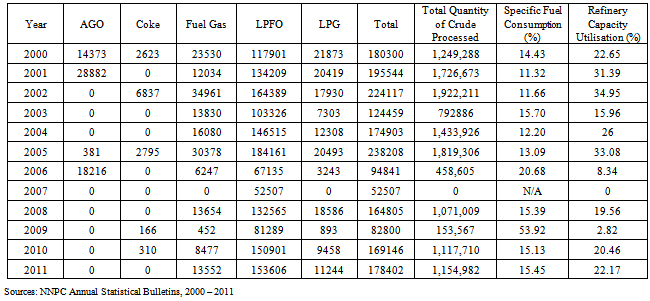
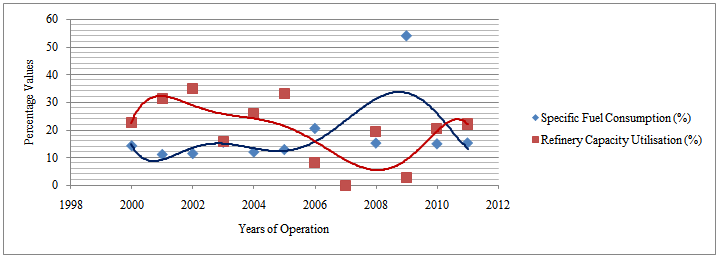
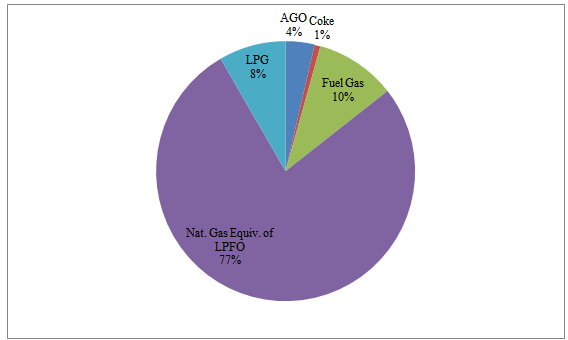
- Table 3 displays the fuel-mixes in KRPC on an annual basis. Special highlights of the Table include the ninth row which displays information for the year 2007 when no crude oil was processed due to pipeline vandalisation. During the year, only LPFO was consumed, probably for power and utilities; capacity utilisation was naturally zero and specific fuel consumption indeterminate. Besides, the third column also indicates that coke was consumed during only five of the twelve years under consideration. Fig. 1a shows how capacity utilisation and specific fuel consumption interrelate over the years. However, Fig. 1b brings out vividly the general graphical relationship between the two important parameters, where it is shown that they are inversely proportional to one another. Fig. 2a is a pie chart, giving a graphical summary of the average fuel-mix at the refinery for the period 2000 – 2011. Fig. 2b and Fig. 2c are also pie charts displaying graphically, the fuel-mixes in a particular year within the period under consideration (the year 2008, precisely) in the same industry in Brazil and US respectively. Fig. 2d is a graphical representation of the effects of high Carbon fuel (namely AGO and LPFO) consumption rates on the refinery specific fuel consumption while Fig. 2e displays, graphically, the effects of consumption rate of LPFO alone on specific fuel consumption.
|
 | Figure 1a. Trends in KRPC Capacity Utilisation and Specific Fuel Consumption Values over the Years |
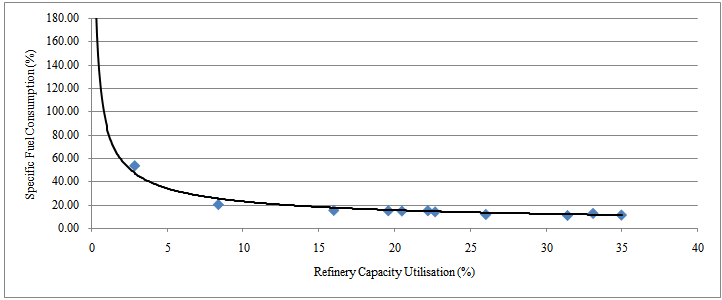 | Figure 1b. Variation of Specific Fuel Consumption with Refinery Capacity Utilisation |
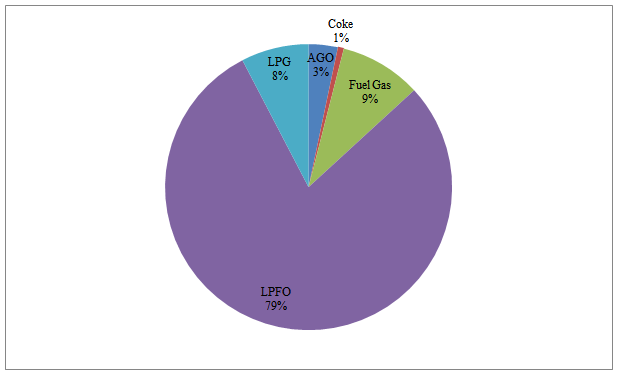 | Figure 2a. Average KRPC Fuel Mix from the Year 2000 to the Year 2011 |
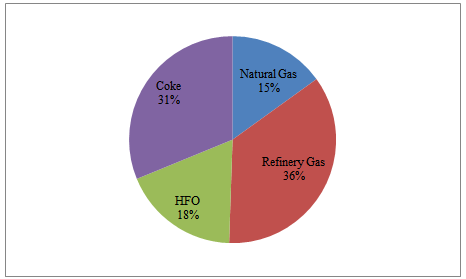 | Figure 2b. Brazilian Refineries Fuel Mix as at 2008 |
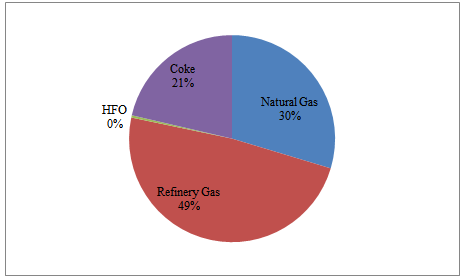 | Figure 2c. US Refineries Fuel Mix as at 2008 |
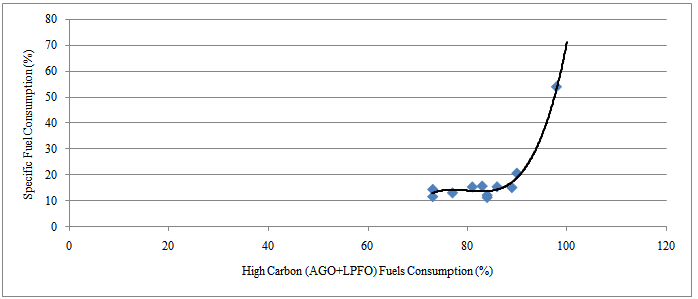 | Figure 2d. Effects of High Carbon Fuel Consumption Rates on Specific Fuel Consumption |
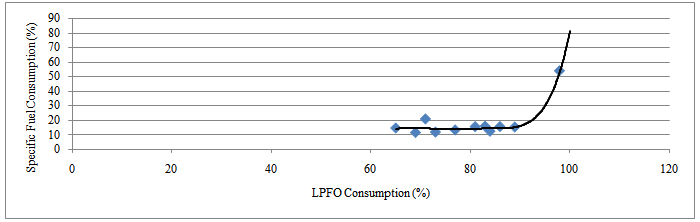 | Figure 2e. Effects of LPFO Consumption Rate on Specific Fuel Consumption |
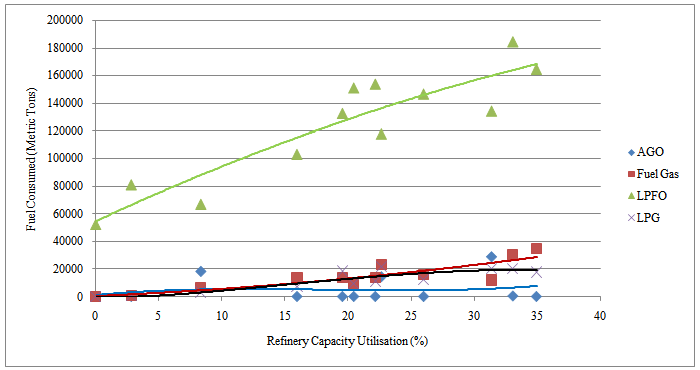 | Figure 3a. Variation of Consumption of Various Fuel Types With Capacity Utilisation |
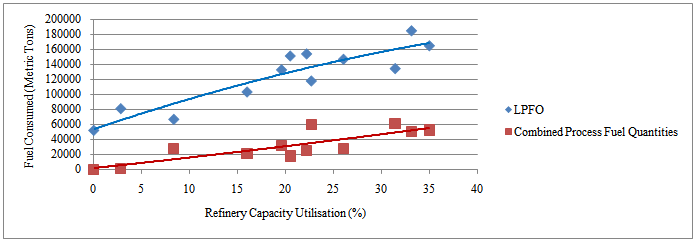 | Figure 3b. Comparative Variations of Consumptions of LPFO and Process Fuels With Capacity Utilisation |
 | Figure 4. Proposed Fuel-Mix with LPFO Substituted with Natural Gas |
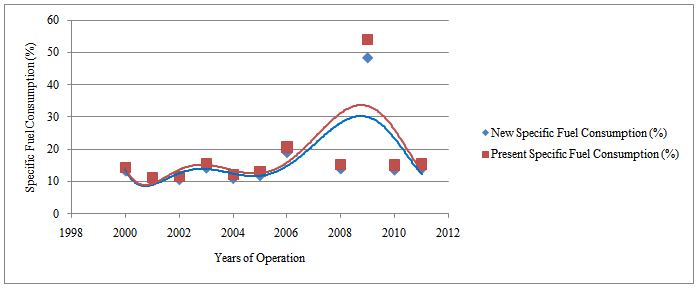 | Figure 5. Comparison between the Present and the New Specific Fuel Consumptions |
- In Fig. 3a and Fig. 3b, we graphically examine how various fuel consumption rates vary with capacity utilisation in the refinery generally, with Fig. 3a logically leading to Fig. 3b. It is the observation in Fig. 3a that some fuel consumption lines pass through the origin (0, 0) that has led to their being lumped together as process fuels in Fig. 3b. Finally, Fig. 4 shows, in a pie chart form, the proposed fuel-mix for the Kaduna Refining and Petrochemical Company,
4. Discussion and Conclusions
4.1. Discussion of Results
- Table 3 shows the values of various fuel types utilised in KRPC within the twelve-year period (2000 – 2011) covered by this work.
4.1.1. Capacity utilisation and Fuel Consumption
- Generally, one major challenge of KRPC is capacity under-utilisation. As shown in Fig. 1a and brought out more clearly in Fig. 1b, the percentage fuel consumptions are inversely proportional to capacity utilisations. In Fig. 1b, the specific fuel consumption asymptotically approaches an infinite value as zero value of capacity utilisation is approached, while it seems to stabilise around a value of about 10% as capacity utilisation reaches 35%. However, from the trend beyond the point of inflexion at around (2.82%, 53.92%), the specific fuel consumption could still go lower than 10%, albeit, extremely slowly with higher values of capacity utilisation. KRPC never attained a specific fuel consumption of 3.5%, which is its design value[11], throughout the period. In fact, it never had a single-digit value, let alone the 4% - 8% range benchmark mentioned by Ocic[29]. Apart from the year 2007, when the plant was totally down due to pipeline vandalisation[24], resulting in zero crude processed and hence undefined value of specific fuel consumption, the specific fuel consumption ranged from 11.32% (2001) to 53.92% (2009) as shown in Table 3. However, according to Oniwon[32], the international benchmark for capacity utilisation is 90% while the international benchmark for fuel consumption as far back as 2008 was 6%. Around the same period of this analysis (1998 – 2008), Brazilian refineries had an average specific fuel consumption of 6% and a capacity utilisation of at least 82% while US refineries had a minimum capacity utilisation of 79% around the same period[de Lima and Schaeffer, 2011] .Besides, energy is totally internally sourced in Nigerian refineries. There is no externally purchased steam or electricity. In the particular case of Kaduna Refining and Petrochemical Company, the fuel consumption is thus utilised to:(a) generate electricity for general use through Steam Turbine Generators (STGs) and Gas Turbine Generators (GTGs)(b) raise steam for general plant use(c) fire heaters for process heat generationOut of the three uses enumerated above, only (b) and (c) may stop entirely when the plants are shut down. For as long as the refinery still opens for business, whether the plants are running or not, electricity would still be utilised. However, process steam and fuel consumption may go down depending on the level of activities in the plant. Since processed/refined crude is the only commodity for which the refinery exists, it is customary to “bill” the refined and/or processed crude for all the energy consumed. This explains why the specific energy consumption goes up when the capacity is underutilised.
4.1.2. Fuel-mix Trend and its Effect on Overall Fuel Consumption Trend
- The average fuel-mix over the 12-year period is very poor, as shown in Fig. 2a, with only 17% low-carbon fuels. Besides, the 1% coke fuel consumption indicates a very low functionality of the Fluidised Catalytic Cracking unit, which utilises this particular fuel. This buttresses the findings by Hart et al[11] that the Fluidised Catalytic Cracking unit of KRPC is hardly in operation. This dismal performance of KRPC would be appreciated when compared with Brazilian refineries with a fuel-mix of Natural gas: 14.52%; Refinery fuel gas: 34.23%; High Pour Fuel Oil: 17.63%and coke: 30.08% (Fig. 2b) and that of United States: Natural gas: 28.25%; Refinery fuel gas: 46.33%; High Pour Fuel Oil: 0.34% and coke: 20.34 %(Fig. 2c) as at 2008[Solomon,[37] quoted in de Lima and Schaeffer, 2011]. Fig. 2d shows the relationship between specific fuel consumption and the quantity of high-carbon fuels (AGO + LPFO) as a percentage of total fuel consumed while Fig. 2e shows the relationship between specific fuel consumption and the quantity of LPFO as a percentage of total fuel consumed. The two figures are practically similar, giving generally constant high values of specific fuel consumption of about 15% up till around a high-carbon fuel percentage of above 90% when the specific fuel consumption soars astronomically. The non-single-digit specific fuel consumption values appear to have been maintained by the combined effects of low capacity utilisation and high-carbon fuels percentages at values between 11% and 20%. However, when the percentage of high carbon fuels goes beyond about 90%, its effect becomes more pronounced, making the specific fuel consumption value to rise sharply.
4.1.3. Power and Utilities Fuel and Process Units Fuels
- Fig. 3a shows plots of various fuel quantities consumed against capacity utilisation. It shows that all fuel plots except that of LPFO intercept both axes at the origin. Indeed, at zero value of capacity utilisation, 52,507 metric tons of LPFO is consumed. This suggests that LPFO is utilised for a purpose different from that for which other fuels are utilised. From the definition of capacity utilisation, the three other fuels whose curves pass through the origin can only be fuels used by the process units. Besides, the only other function which is performed, whether the process units are functional or not, is electric power supply. Hence, it is concluded that LPFO is used to generate power for the refinery use. Fig. 3b brings out this observation vividly, with all the process units fuels combined together. One important deduction here is that most of the fuel consumed in KRPC has been used to supply electric power and utilities.
4.1.4. Fuel Substitution Option
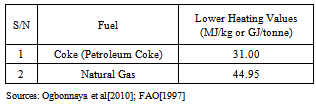
- As a first step to ameliorate the situation, it is necessary to improve the fuel-mix in the KRPC. This paper suggests substitution of LPFO, which is the bulk of fuel consumed, with natural gas. The substitution has three advantages: natural gas has a higher heating value (44.95 MJ/kg) than that of LPFO (40.19 MJ/kg). Secondly, natural gas has a lower carbon content and hence its combustion is more environmentally friendly. Thirdly, natural gas utilisation will reduce the present level of gas flaring in the Nigerian oil and gas sector thus leading to both financial gains and environmental protection. This replacement of fuel oil with natural gas has been done successfully in the Iranian refining industry[36]. The additional main step is boosting the refinery capacity utilisation so that the specific fuel consumption can go down and the present energy utilisation pattern that is skewed mainly in favour of power production and utilities would be redistributed productively in favour of the refinery primary function. Fig. 4 shows the resultant fuel-mix of this proposal, while Fig. 5 shows the specific fuel consumption values would be attained compared to the present values. It is obvious that the present values are higher than those with the proposed fuel-mix
4.2. Conclusions
- Fuel-mix analysis of energy utilisation in Kaduna Refining and Petrochemical Company (KRPC) has been made for the period 2000 – 2011. The analysis has unravelled capacity under-utilisation and poor fuel mixes that need to be improved upon for environmental sustainability and higher utilisation efficiency as the major challenges. Finally, capacity utilisation improvement and substitution of fuel oil with natural gas are hereby recommended to rescue the situation.