Youcef Kerkoub, Yasmina Kerboua Ziari, Ahmed Benzaoui
Laboratory of Thermodynamics and Energy Systems, Faculty of Physics, University of Science and Technology Houari Boumediene (USTHB), BP 32 El-Alia Bab Ezzouar, Algiers, Algeria
Correspondence to: Yasmina Kerboua Ziari, Laboratory of Thermodynamics and Energy Systems, Faculty of Physics, University of Science and Technology Houari Boumediene (USTHB), BP 32 El-Alia Bab Ezzouar, Algiers, Algeria.
| Email: |  |
Copyright © 2012 Scientific & Academic Publishing. All Rights Reserved.
Abstract
This paper focuses on the effect of gradients of pressure, between anode and cathode side, on the performance of the cell and also investigates the effect of these parameters on water management within the cell. Different cases of these gradients have been investigated and compared to the experimental results reported by. The model is implemented into computational fluid dynamics (CFD) for solving all coupled equations. The results derived using the proposed model compare with known experimental results for certain conditions, described in published research work.
Keywords:
Energy, Fuel Cell, Simulation, Pressure, PEMFC
Cite this paper: Youcef Kerkoub, Yasmina Kerboua Ziari, Ahmed Benzaoui, Effect of Pressure in Proton Exchange Membrane Fuel Cell (PEMFC), International Journal of Energy Engineering, Vol. 3 No. 3, 2013, pp. 158-164. doi: 10.5923/j.ijee.20130303.05.
1. Introduction
PEMFC (Proton Exchange Membrane Fuel Cell) using very thin polymer membrane has been considered as a promising candidate of future power sources for transportation and residential applications. The difficulties related to the fuel cell systems experimental environment have stimulated efforts to develop models that could enable simulation and prediction of multi-dimensionally coupled transport of reactants, heat and charge spies. The model based on ohm’s low and Butler-Volmer (or Tafel) equation is the first kind of model which describes the performance of the PEM fuel cell, Ticianelli et al.[1] and Srinivasan et al.[2] were among the first to use the empirical equation to analyze their experimental polarization results. However, they do not provide insight into the underlying transport and electrochemical phenomena that occur inside the fuel cells. More detailed analysis of the multiple transport and electrochemical mechanisms requires the use of numerical models (CFD). The first applications of CFD methods to fuel cells focused on two-dimensional models[3],[4],[5] and[7]. More recently, CFD and improved transport models have allowed the development of increasingly more realistic computational models, accounting for fluid, thermal and electrochemical transport, complex three-dimensional geometries including flow and cooling channels, and two-phase transport[8-12].
2. Model Description
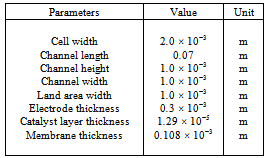
Table 1. Physical dimensions for the straight channel fuel cell section[13]
 |
| |
|
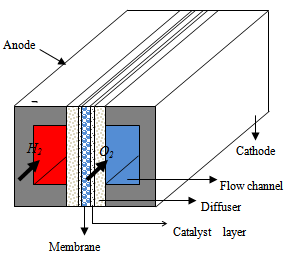 | Figure 1. Schematic diagram of the parallel micro flow channel structure |
Fig. 1 shows a schematic diagram of a PEMFC compared of two distinct current collectors with flow channels formed on to both the cathode and anode; and the MEA consists of a proton exchange membrane sandwiched between two catalyst layers. Between the current collectors and the MEA are included two GDLs on both sides. In this paper, the mathematical model considers all the parts shown in Fig. 1 with the geometrical parameters as listed in Table 1( same geometrical parameters as in[13]).
2.1. Model Assumptions
The assumptions used in developing the model are as follows:-Ideal gas law is employed for gaseous species.- The fluid flow in the fuel cell is laminar due to the low flow velocities and the small size of gas flow channels.- The porous media including membrane, catalyst layers and GDLs are considered to be isotropic.- All water produced in the electrochemical reactions is assumed to be in the gas phase, and phase change and two phase-transport are not considered.- The gas mixture flows are incompressible.Only the steady-state case is considered.
2.2. Governing Equations
The nature of deferent elements of the PEM fuel cell is not the same. The source terms changes from one element to the other. So, each element has its own equations.The general form of transport equations in the flow channels and porous media are as follow
2.2.1. Mass Conservation Equations
The equations of continuity are: | (1) |
Where ε is the porosity of the porous media, which is equal to unity for the gas channels, S denotes source terms corresponding to the consumption of hydrogen and oxygen in the anode and cathode, and the production of water in the cathode. These terms are nil in the flow channels.
2.2.2. Momentum Conservation Equations
The steady state momentum equations in the porous media using the physical velocity formulation can be written as: | (2) |
The source terms  in flow channels are nil, and they become darcean term source in porous media:
 | (3) |
Where: K is hydraulic permeability, μ is effective viscosity
2.2.3. Species Conservation Equations
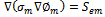
In porous media (GDLs, catalyst layers and membrane), the species conservation equations are: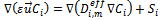 | (4) |
The source terms are nil in all parts of the cell except in catalyst layers which represents the hydrogen and oxygen consumptions and water production.
  | (5) |
The anode and cathode local current densities per unit volume,  and
and , are expressed in terms of the Butler–Volmer equations for the anode as follows:
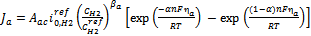 | (6) |
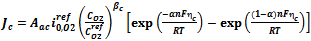 | (7) |
2.2.4. Conservation of Energy
In this model, the energy balance in terms of temperature change was also considered, and is given by: | (8) |
The source terms of energy change from one region to another. For the collectors, flow channels and diffusers, these terms are nil. In the membrane, only ohmic loss occur which result from Joule heating. while in the catalyst layers there are three terms, heat of reactions  , ohmic
  and activation over potential
  .
.
2.2.5. Conservation of Charges
The current transport of electrons through the solid phase and ions through the membrane phase is represented by the following equations | (9) |
 | (10) |
While equation (9) models the electronic charge in all solid regions, equation (10) describes the protonic charges in membrane phase. The source terms  and
and  exist only in catalyst layers which represent the volumetric currents transfer described by equations of Butler–Volmer (6) and (7).
3. Model Validation
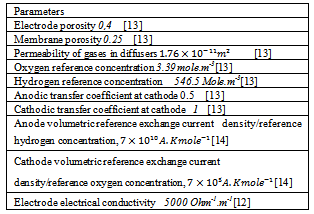
The current model is validated against experimental data measured with an in-house developed PEM fuel cell[13]. Figure.2 compares the computed and measured polarization curves. In the activation and the ohmic regions (low and mid-range current densities) of the polarization curve, the results derived by using the proposed model are in a good agreement with those experimental, with deviations less than 5.0%. As expected, the model is unable to reproduce the experimental data at high current densities. The discrepancy in this region is attributed in part to the assumption of single phase transport. In practice, however, the formation of liquid is expected to limit mass transport at higher current densities[11]. Another effect that may lead to a drop in the cell voltage at higher current densities is the shift of the reaction zone in the catalyst layer away from the membrane interface at higher currents[11]. The protons need to be transported further out in the catalyst layer due to depletion of oxygen in the catalyst, and this leads to increased ohmic losses.Table 2. Employed Parameters
 |
| |
|
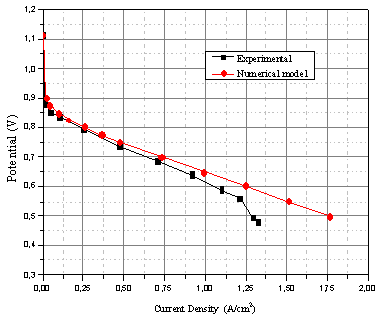 | Figure 2. Polarization curve: comparison of simulations and experiments[13] |
4. Results and Discussion
In this section, are presented the polarization curves for different cases. First, the performance of the cell is predicted on the basis of identical pressure in both sides.[14] Secondly, gradients of pressure are created in the cathode to anode direction and, finally, gradients of pressure are created in the anode to cathode direction. The case of a pressure of three bars in the two sides is taken as a reference base. In figure (3.a), pressures in both sides are identical, the performance of the cell increases with the increase of pressure due to increase of concentrations of reactants. Figure (3.b) shows the effect of pressure gradients in the cathode to anode direction on cell performance. In this case, a 3-bar pressure is fixed at the anode while it is increased at the cathode. It appears that the cell performance increases with the increase of pressure gradient due to the increase of convective water flux which increases membrane hydration in the anode side, consequently increasing membrane protonic conductivity. Figure (3.c) shows the cell performance in the case of 3-bar pressure at the cathode while decreasing it at the anode. Note that in that case the performance in not significant, the decrease of pressure at the anode increases the activation over potential, but water flux resulting from the pressure gradient decreases membrane resistance. So, the power loss due to activation over potential is compensated for by a decrease in ohmic loss. In the last case (figure.3.d), the pressure gradients in the anode to cathode direction have a negative influence on the cell performance. The convective water flux in the anode to cathode direction causes membrane dry out on the anode side, so as the protonic membrane conductivity increases, causing then a decrease in the performance of the cell.
4.1. Effect of Pressure Gradient on Water Management
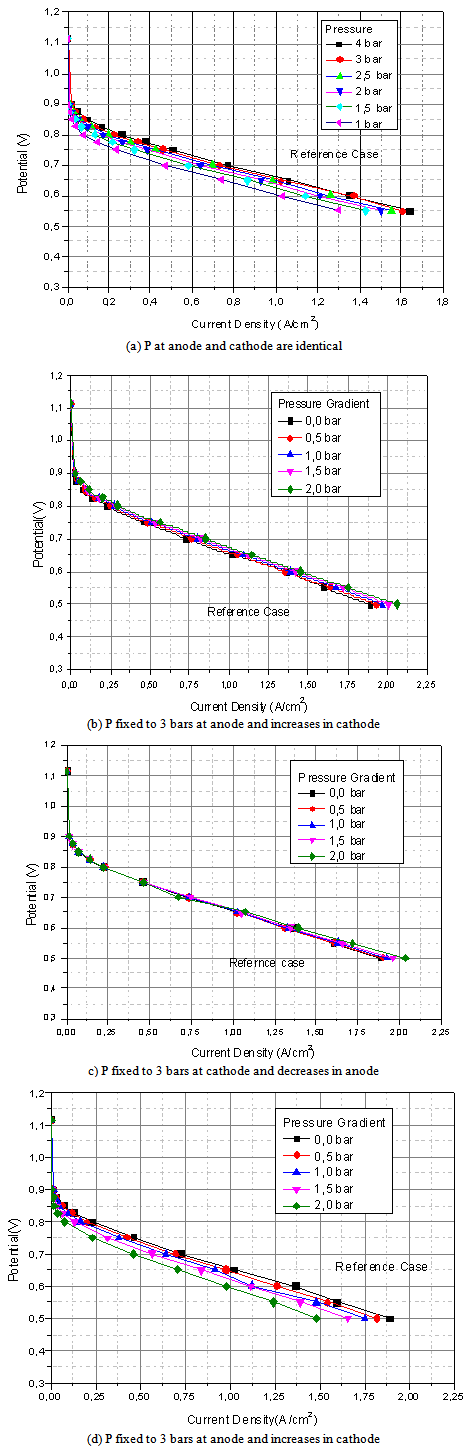 | Figure 3. Polarization curves for different cases of pressure gradients |
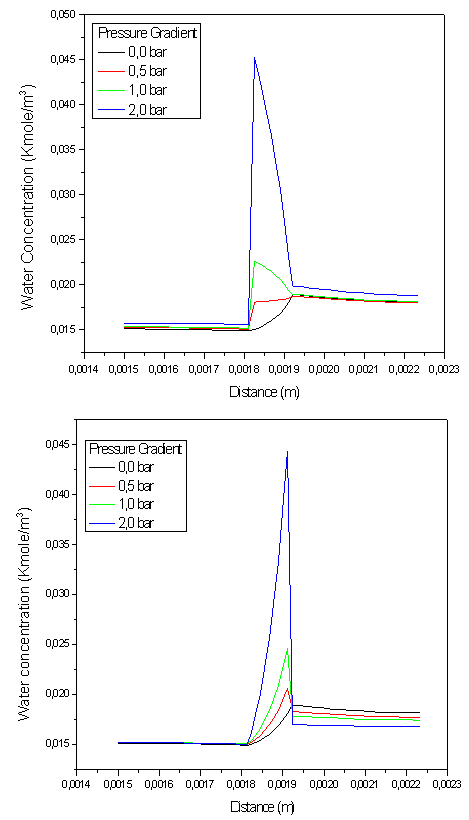 | Figure 4. water concentration profile in diffusers and EMA cross section( plane xy) at operating condition iavg=0.46 A.cm-2 |
Figure.4, show water concentration profile in diffusers and EMA cross section (plan xy) for two cases, pressure gradient applied in the cathode to anode direction (figure.4.a) and, in the second case, in the opposite direction (figure.4.b). In the first case, when the pressure gradient is zero the maximum of water flow appears at the cathodic catalyst layer, but the increase in pressure gradient causes an increase in water flow due to convection coming from the cathode to the anode, so as the maximum amount appears at membrane anodic side. Conversely, in the second case the maximum amount of water appears at membrane cathode side because the water flux direction becomes form the anode to cathode side.
4.2. Flow Field
Figure 5 and 6, show the velocity vectors and magnitude in the cross flow plane on the middle of the cell (x,z plane) at i=0.476 A/cm2 . It can be seen that the velocity exhibits parabolic profiles in both anode and cathode gas channels. In the porous medium, velocity dropped very fast from the interface with the channel in a thin layer of the order of the pore size[5]. The transport beyond this layer should be mainly due to diffusion, but convection may still be present. For an axial velocity of 36m/s at anodic channel, the velocity profile in a cross-section at the distance 0.035m from the inlet with a value of approximately 3 m/s in the channel at the interface with the porous medium, and a boundary layer of about 0.05 mm inside the porous medium. The maximum velocity is shifted from the center line, with a distance of 5% of the channel width.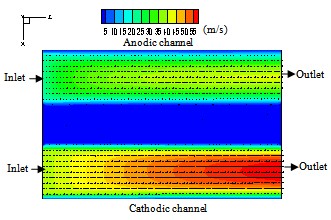 | Figure 5. Velocity distribution in the flow direction on the middle plane of the cell ( y=0.001m) |
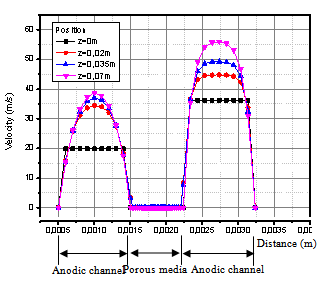 | Figure 6. Transverse velocity profile at deffirent positions in the direction of the flow on the middle plane of the cell (y=0.001m) |
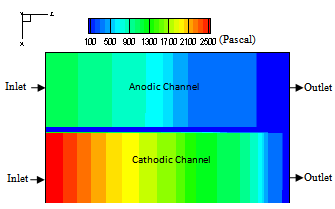 | Figure 7. Pressure distribution on the middle plane of the cell in the direction of the cell (y=0.001m) |
Figure 7, shows the distribution of pressure drop in middle plane cross section of the cell for the same conditions as previous case. The pressure drop at cathode channel is greater than anode channel. It’s about 2500 Pa at the cathode side and about 1300Pa at the anode side. This difference in pressure drop is caused by higher air mass flow rate comparing with hydrogen.
5. Conclusions
In this work is predicted the effect of pressure gradients between anode and cathode flow channels on performance of the cell. So, it is established that the pressure gradient in the cathode to anode direction has significant effect on the performance of the cell. It also significantly affects the conductivty of the membrane. Conversely, the opposite gradients cause a decrease in the performance of the cell. Consequeontly, it is preferebale to create a gradient in the cathode to anode direction rather than in the opposite direction.
References
| [1] | E.A. Ticianelli, C.R. Derouin, A. Redondo, and S. Srinivasan, Methods to advance technology of proton exchange membrane fuel cells, Journal of the Electrochemical Society, 135(9):2209-2214, 1988. |
| [2] | S. Srinivasan, E.A. Ticianelli, C.R. Derouin, and A. Redondo, Recent advances in solid polymer electrolyte fuel cell technology with low platinum loading electrodes, Journal of Power Sources, 22(3-4):359-375, 1988. |
| [3] | V. Gurau, H. Liu, S. Kakac¸, Two-dimensional model for proton exchange membrane fuel cells, AIChE J. 44 (11) (1998) 2410– 2422. |
| [4] | D. Singh, D.M. Lu, N. Djilali, A two-dimensional analysis of mass transport in proton exchange membrane fuel cells, Int. J. Eng. Sci. 37 (4) (1999) 431–452. |
| [5] | S. Dutta, S. Shimpalee, J.W. Van Zee, Three-dimensional numerical simulation of straight channel PEM fuel cells, J. Appl. Electrochem. 30 (2000) 135–146. |
| [6] | S. Um, C.Y.Wang, C.S. Chen, Computational fluid dynamics modeling of proton exchange membrane fuel cells, J. Electrochem. Soc. 147 (12) (2000) 4485–4493. |
| [7] | S. Dutta, S. Shimpalee, J.W. Van Zee, Numerical prediction of mass exchange between cathode and anode channels in a PEM fuel cell, Int. J. Heat Mass Transfer 44 (2001) 2029–2042. |
| [8] | T. Berning, D.M. Lu, N. Djilali, Three-dimensional computational analysis of transport phenomena in a PEM fuel cell, J. Power Sources 106 (2002) 284–294. |
| [9] | T. Zhou, H. Liu, A general three-dimensional model for proton exchange membrane fuel cells, Int. J. Transport Phenomena 3 (2001) 177–198. |
| [10] | T. Berning, N. Djilali, A 3D, multi-phase, multicomponent model of the cathode and anode of a pem fuel cell, J. Electrochem. Soc. 150 (12) (2003) A1589–A1598 |
| [11] | B.R. Sivertsena,1, N. Djilali,CFD-based modelling of proton exchange membrane fuel cells, Journal of Power Sources 141 (2005) 65–78. |
| [12] | Hao Wu.Mathematical Modeling of Transient Transport Phenomena in PEM Fuel Cells, PHD thesis of Mecanchal En geneering , Waterloo, Ontario, Canada, 2009 |
| [13] | L. Wang, A. Husar, T. Zhou, H. Liu, A parameteric study of PEM fuel cell performances, Int. J. Hydrogen Energy 28 (2003) 1263–1272. |
| [14] | Anh Dinh Le, Biao Zhou, A general model of proton exchange membrane fuel cell. Journal of Power Sources 182 (2008) 197–222. |
 Abstract
 Reference
 Full-Text PDF
 Full-text HTML