-
Paper Information
- Next Paper
- Previous Paper
- Paper Submission
-
Journal Information
- About This Journal
- Editorial Board
- Current Issue
- Archive
- Author Guidelines
- Contact Us
International Journal of Energy Engineering
p-ISSN: 2163-1891 e-ISSN: 2163-1905
2013; 3(3): 138-146
doi:10.5923/j.ijee.20130303.03
Application of Superposition and Fuzzy Logic Methods to Determine the Contribution of the Utility and Customer in Creation of Harmonic Distortions in PCC Bus
 Abstract
 Reference
 Full-Text PDF
 Full-text HTML
Majid Moradlou1, Farzaneh Eshaghian Dorcheh2, Mehdi Bigdeli1
1Department of Electrical Engineering, Zanjan Branch, Islamic Azad University, Zanjan, Iran
2Department of Electrical Engineering, Isfahan University of Technologhy, Isfahan, Iran
Correspondence to: Mehdi Bigdeli, Department of Electrical Engineering, Zanjan Branch, Islamic Azad University, Zanjan, Iran.
| Email: |  |
Copyright © 2012 Scientific & Academic Publishing. All Rights Reserved.
This paper presents a new method for determination of the relative contribution of utility and customer in creation of voltage and current harmonic distortions in PCC (Point of Common Coupling) bus. In proposed method, accurate information of harmonic impedance of customers is not needed. At first, using superposition method and definition of harmonic contribution, new indices are defined and an algorithm is proposed. Then, an appropriate fuzzy inference system is designed and combined with the proposed algorithm in order to determine the approximate contribution of utility and customer in creation of harmonic distortions. In contrast to the other methods, in proposed method the precise amount of harmonic impedances of customer is not needed in any case and a pretty estimation of contribution of two sides is obtained even in cases where their contribution is close to each other. The analysis is verified by simulating IEEE 13-bus industrial distribution system in DIGISILENT software.
Keywords: Power Quality, Harmonic Contribution, Fuzzy Logic, Digsilent Software
Cite this paper: Majid Moradlou, Farzaneh Eshaghian Dorcheh, Mehdi Bigdeli, Application of Superposition and Fuzzy Logic Methods to Determine the Contribution of the Utility and Customer in Creation of Harmonic Distortions in PCC Bus, International Journal of Energy Engineering, Vol. 3 No. 3, 2013, pp. 138-146. doi: 10.5923/j.ijee.20130303.03.
Article Outline
1. Introduction
- Harmonic distortions are among the most important issues related to power quality which have been increased in past years. The main reason for harmonic pollution is the use of non-linear loads[1-3]. Therefore from one aspect “customers” are the main source of these distortions. However, due to complexity and topology of networks along with existence of power factor correcting capacitors in them, these distortions spread over the whole network. Thus in today’s modern networks, by measuring the harmonics in one point, it cannot be determined whether the upstream or downstream network is the main source of distortions. So, the important question is which side is the dominant cause of harmonic pollution in one point. In order to answer this question, an accurate definition for the term “harmonic contribution” should be obtained which is the focus of the second part of this paper.The most common method for identification of main harmonic source is based on harmonic power direction at PCC bus. However, it has been shown and proved that this method does not always provide correct results[4-5]. Thunberg and Soder[6] have adopted the Norton model of harmonic source consisting of harmonic current source in parallel with harmonic impedance. Upstream and downstream networks seen from PCC bus in the form of Thevenin or Norton equivalent circuits have been modeled in[5] and[7]. Then, the current and voltage harmonic contributions of each side at the PCC bus have been defined using superposition method. This definition requires the accurate value of harmonic impedances of upstream and downstream networks that are usually unknown or difficult to obtain. Different methods have been proposed for the measurement and calculation of harmonic impedance at a specific point in a network; however they are usually expensive and difficult to implement[8-15].Using the proposed definition for harmonic contribution, it is shown that in order to identify the dominant source in the creation of current (voltage) distortion in PCC bus, it is sufficient to compare the corresponding voltage (current) sources in equivalent Norton (Thevenin) models. Accordingly, different methods have been introduced [16-19]. The most important of which is the “Critical Impedance” method[18-19]. Some studies[20] have been shown that in cases where the harmonic contribution of customers and utility is close to each other or there is not enough information about the harmonic impedance of customer, the critical impedance method may provide incorrect results. This problem has been solved in[20] by defining new indices and employing appropriate method. However, this method is not able to estimate the relative contribution of network and customers in the creation of the harmonics and it may give uncertain results in some cases.To address mentioned shortcomings, using the definition of harmonic contribution in[5],[7] and the proposed algorithm in[20], and by designing an appropriate fuzzy inference system, a new method is proposed. Some advantages of this work are listed in the following:● An intelligent method is proposed to determine the approximate relative contribution of utility and customer in creation of harmonic distortions at PCC bus. For this purpose, fuzzy logic is used, which is very popular smart method.● In proposed method, the precise amount of harmonic impedances of customer is not needed.● This method not provide incorrect results in contrast to[19].● The proposed method does not give uncertain results in some cases in contrast to[20].In this regard, definitions of harmonic contribution are presented and then the proposed method and fuzzy system are presented. The validity of the proposed method is verified by simulating IEEE 13-bus industrial distribution system[21] using Digsilent software.
2. Definition of Harmonic Contribution Based on Superposition
- The definitions of harmonic contribution of voltage and current in a specific point are presented here. Then their results are used to identify the dominant source of harmonics.
2.1. Harmonic Contribution in Creating Current Distortions
- As shown in Fig. 1, the upstream and downstream networks seen from PCC are modeled by their equivalent Thevenin circuit which consists of a voltage source in series with harmonic impedance for each specific harmonic. The subscripts “u” and “c” denote upstream (utility) and downstream (customer) networks seen from PCC bus respectively.
 ,
,  , P and Q are equal the phasors of harmonic current phasor, harmonic voltage phasor, harmonic active power and harmonic reactive power respectively as measured in PCC.
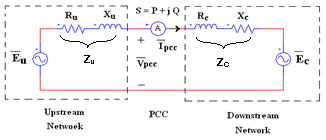 | Figure 1. Harmonic Thevenin equivalent circuit for utility and costumer seen from PCC bus |
 | (1) |
 | (2) |
 | (3) |
 is the algebraic sum of these two quantities. It should be noted that Īuf and Īcf can be both positive or one positive and the other negative. These quantities are positive if they are in the same direction as ĪPCC.Using phasor equations, Īuf and Īcf can be obtained by the following equations:
 | (4) |
 | (5) |
2.2. Harmonic Contribution in Creating Voltage Distortions
- As shown in Fig. 2, the upstream and downstream networks seen from PCC, are modeled by their equivalent Norton circuit for each specific harmonic. Actually, the circuit in Fig. 2 is dual for the circuit shown in Fig. 1 and the relationships
 and
and  held in it. According to Fig. 2 and using superposition, the equations (6) to (10) can be written for determination of voltage harmonic contribution.
 | (6) |
 | (7) |
 | (8) |
 | (9) |
 | (10) |
 and
and  are defined as utility and customer contribution in producing harmonic
  , respectively[5].
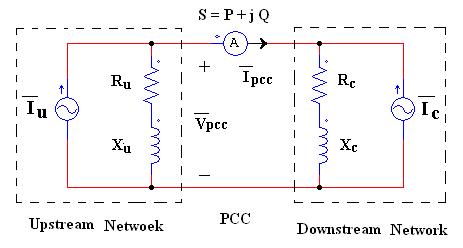 | Figure 2. Harmonic Norton equivalent circuit for utility and costumer seen from PCC bus |
2.3. Identifying the Dominant Source in the Creation of Harmonic Based on Definitions of Harmonic Contribution
- According to the equations (1) to (10), it is seen that in order to accurately determine the harmonic contribution, along with the measured values in PCC bus, precise values of harmonic impedances
 and
and  are needed. This is difficult to obtain due to numerous uncertainties in harmonic impedances of the loads. Thus, if the precise amounts of harmonic impedances are not accessible, another criterion for identification of dominant harmonic sources must be presented.By differentiating equations (4) and (5) and using (1) and (2), equation (11) can be derived as follows:
 | (11) |
 | (12) |
 , a comparison between
  and
and  will suffice. And in order to determine the dominant source in the creation of harmonic voltage
  , a comparison between
  and
and  will be sufficient. Based on this, different methods have been presented[16-20].
3. Fuzzy Set Theory and Fuzzy Inference Systems
- a) Fuzzy set theoryFuzzy set introduced by “Zadeh”[22], has no accurate boundaries as compared to the classic sets. Elements of a fuzzy set belong to it by a certain “degree of membership” which is a real value in interval[0 1]. In a classic set, On the contrary, an element either belongs or does not belong to the set i.e. the degree of membership can be 0 or 1. The membership of elements in a fuzzy set is described with the aid of a “membership function” valued in the real unit interval[0 1]. For example the classic set A can be defined as:
 | (13) |
 is the membership function (MF) of the variable x in B:
 | (14) |
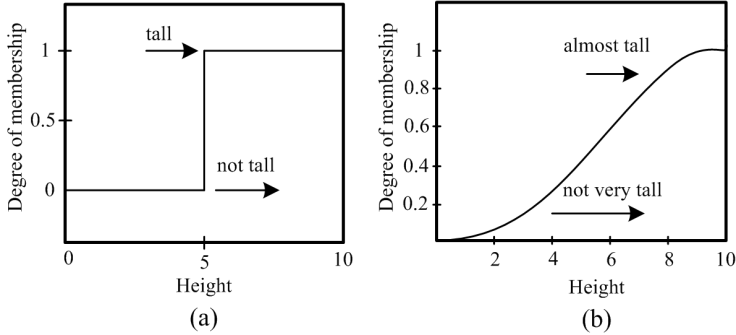 | Figure 3. Membership function rated to "being tall" a) Classic b) Fuzzy |
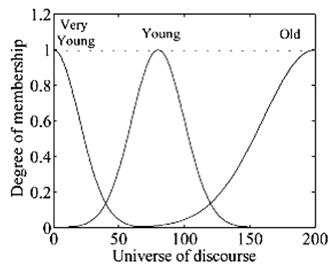 | Figure 4. Description of linguistic variable "age" |
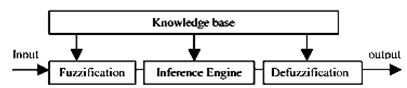 | Figure 5. Block Diagram of a Fuzzy Inference System (FIS) |
4. Proposed Method
- In the proposed method it is assumed that the upstream network harmonic impedance
 is known (similar to methods presented in[19-20]). This is because uncertainty in equivalent harmonic impedance is mostly due to uncertainties in harmonic impedances of the loads. If there is no power factor correction capacitor in the upstream network in the vicinity of PCC, it can be assumed that
  is dominated by the impedance of step down transformer[1-3]. Furthermore; it is assumed that the range of variation of downstream network harmonic impedance
  is known[19-20].To explain the proposed method, it is assumed that the goal is to identify the dominant source in the creation of harmonic current
  . According to (11), to compare
  and
and  , a comparison between
  and
and  can be made. According to Fig. 1 and circuit laws, following per-unit relationships can be expressed:
 | (15) |
 | (16) |
 | (17) |
 | (18) |
 | (19) |
 | (20) |
 | (21) |
 and
and  are defined as follows:
 | (22) |
 and vice versa. Also based on (20) and (21), IU is only a function of quantities measured in PCC bus and the phase and amplitude of
  and IC is only a function of quantities measured in PCC bus and the phase and amplitude of
  . Thus according to the assumptions made for harmonic impedances at the beginning of this section, IU is approximately known while IC is unknown. Meanwhile, having the range of variation of
  and its possible states, a maximum and minimum can be found for IC. These points are the basis for the proposed approach in this paper.Using the concept of “duality” similar expressions can be derived for the identification of the dominant source in the creation of harmonic voltage
  . Duals of (19) to (22) are as follows:
 | (23) |
 | (24) |
 | (25) |
 | (26) |
 | (27) |
4.1. Designed Algorithm
- The proposed algorithm for the estimation of relative contribution of the utility and customer in the creation of
 (in case that the amplitude and harmonic phase of
  is unknown) is as follows:● Measurement of
  ,
,  , P and Q. ● Calculation of IU using (20) and with the assumption that
  is known.● Calculation of ICmin and ICmax using (21) based on the range of variations and possible states for
  .● Entering IU, ICmin and ICmax to designed fuzzy system.● Deriving the results from the designed fuzzy system and calculation of relative contribution of network and customer.As it is seen in the proposed algorithm, in contrast to past well-known method[19], there is no need for the precise value of
  .For calculating the relative contribution of the utility and customer in the creation of
  the same algorithm can be employed. However, instead of IU and IC, VU and VC should be replaced, respectively.
4.2. Designed Fuzzy System
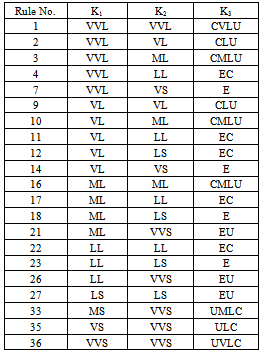
- Before describing the fuzzy system, it should be noted that the definition of indices, membership functions and “if-then” rules has been done according to experimental results in different conditions, practical values of elements used in power systems and harmonic models.In this section the fuzzy system which is used for calculating the relative contribution of the utility and customer in the creation of
 is described. As it was mentioned earlier, the inputs to these systems are the values of IU, ICmin and ICmax. Calculation of relative contribution of the utility and customer in the creation of
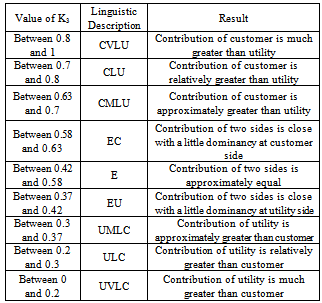
  is carried out in a similar way but in this case the inputs are values of VU, VCmin and VCmax.a) Definition of indicesThe two indices K1 and K2 as inputs to the fuzzy system are defined as follows:
 | (28) |
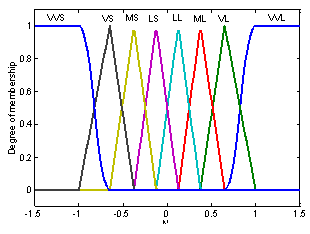 | Figure 6. Membership functions of inputs K1 and K2 |
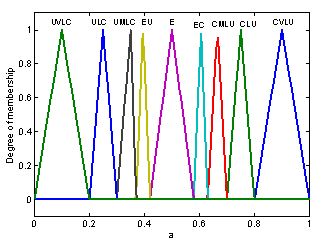 | Figure 7. Membership functions of output K3 |
|
|
5. Implementation of Proposed Method on a Sample Network
- To evaluate the proposed method, the IEEE 13-bus industrial distribution system[21] is used. The simulated network in Digsilent software is shown in Fig. 8.In order to perform better evaluation the following modifications have been made on the network:Half of the RECT load is modeled as current source with ASD harmonic spectrum mentioned in[21] and the other half is modeled as RL load with a power factor equal to that of the RECT load.The 39:T3 SEC load is also considered as harmonic load and is modeled like RECT load.The 29:T11 SEC load is also considered as harmonic load. 25% of it is modeled as a current source with ASD harmonic spectrum and the rest is modeled as RL load with the same RECT load power factor.The 5th, 7th and 11th voltage harmonics with the amplitudes of 0.015, 0.009 and 0.005 per-unit respectively and a phase of zero degree are injected in 100: UTIL-69 bus as background voltage harmonics so that the voltage THD reaches 3% in the bus.The simulation is done in two different cases for upstream and downstream networks of PCC bus.a) First caseIn this case, 03 MILL-1 is selected as PCC bus and the customer side includes the F1 feeder along with its transformers and its downstream loads. The rest of the system is considered as upstream network. So the current of F1 is the same as
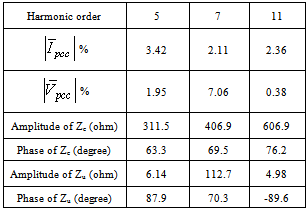
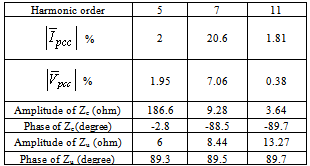
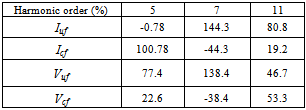
 . The results of current measurement in PCC bus for 5th, 7th and 11th harmonics are presented in Table 3. Using real data and with the aid of software, the percentage of ratio of voltage and current harmonics with respect to their fundamental component and the real values of Zu and Zc are also mentioned in Table 3. THD of voltage and current in PCC is 7.6 and 6.64 percent, respectively.Using superposition method and real data, the real values for customer and network contribution in the creation of harmonic distortions in PCC bus are given in Table 4. The negative signs in this table are due to harmonic cancellation in two sides.Now let’s assume that the values for harmonic impedances of the loads have an error of
  and
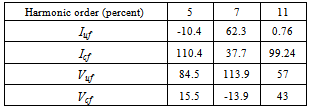
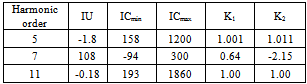
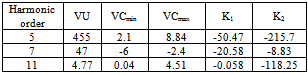
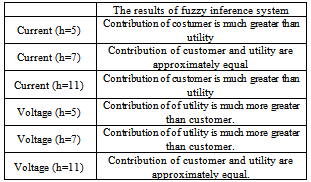
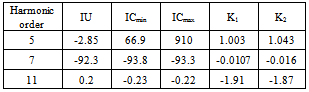
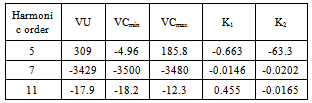
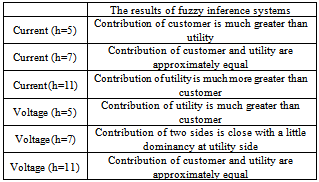
and  in their amplitude and phase, provided that their phases will stay in the interval between +90 and -90 degrees. The error in data related to the “05 FRD F” loads will result in an error in phase and amplitude of Zu. In a similar way error in information of “29 T11 SEC” loads will lead to an error in Zu This error, however, can be neglected and Zu can be assumed as fixed and known.To determine the relative harmonic contribution of the utility and customer in the creation of IPCC, quantities IU, ICmin and ICmax are calculated for the 5th, 7th and 11th harmonics and presented in Table 5 (the values related to above quantities in this table have to be multiplied with 104). In the same way, in order to estimate the relative contribution of either sides in the creation of VPCC, quantities VU, VCmin and VCmax are calculated for the 5th, 7th and 11th harmonics and presented in Table 6. Using the values of K1 and K2 in Table 5 and Table 6 and the proposed fuzzy inference system, the relative contribution of customer and the network in the creation of desired harmonics is estimated and given in Table 7.
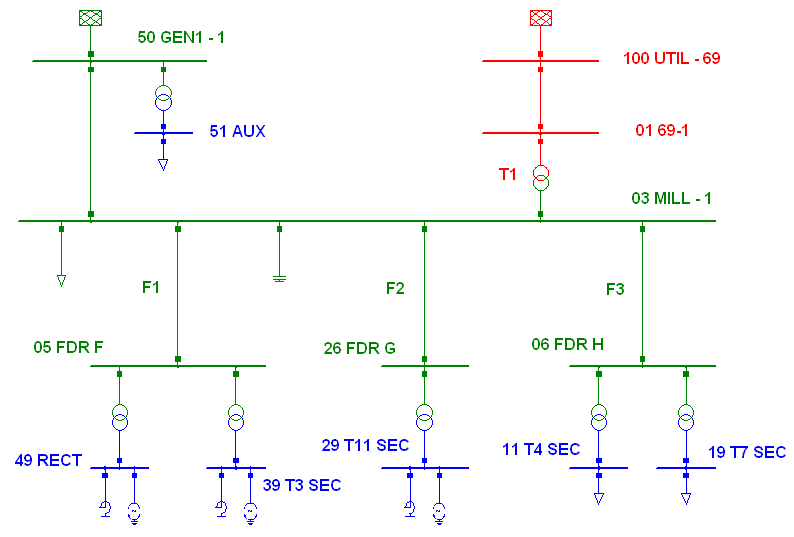 | Figure 8. IEEE 13 bus industrial distribution network simulated in Power Factory Digsilent software |
|
|
|
|
|
|
|
|
|
|
6. Conclusions
- Due to importance of determination of the relative harmonic contribution of the utility and customer in the creation of harmonic distortions in PCC bus and lack of reliable method in this field, a new method is proposed by application of superposition method and fuzzy logic technique. The required data for this purpose are the measurement results in PCC bus and approximate information about harmonic impedances of customers. The proposed method in comparison with other well-known methods, never results in an incorrect answer and offers approximately correct estimation of relative contributions of two sides in the creation of the distortions. The specifications and validation of this method have been verified by simulating the IEEE 13 bus industrial distribution system in DIGISILENT software.
ACKNOWLEDGEMENTS
- This research was undertaken in the framework of a research project supported by the Islamic Azad University, Zanjan Branch. So, the authors gratefully acknowledge Zanjan Branch of Islamic Azad University for their financial and spiritual supports.