-
Paper Information
- Next Paper
- Previous Paper
- Paper Submission
-
Journal Information
- About This Journal
- Editorial Board
- Current Issue
- Archive
- Author Guidelines
- Contact Us
International Journal of Energy Engineering
p-ISSN: 2163-1891 e-ISSN: 2163-1905
2013; 3(1): 15-20
doi:10.5923/j.ijee.20130301.03
The Influence of Artificial Light and Shading on Photovoltaic Solar Panels
 Abstract
 Reference
 Full-Text PDF
 Full-text HTML
Andrew Zulu 1, Gelasius Kashweka 2
1Department of Mechanical Engineering, Polytechnic of Namibia, Windhoek, 9000, Namibia
2Machine and Tool Maintenance Engineers, Windhoek, 9000, Namibia
Correspondence to: Andrew Zulu , Department of Mechanical Engineering, Polytechnic of Namibia, Windhoek, 9000, Namibia.
| Email: |  |
Copyright © 2012 Scientific & Academic Publishing. All Rights Reserved.
The efficiency of use of solar panels is influenced by many factors. This paper investigates, by experiment, the influence of artificial light and shading on solar panel cells. Firstly, the panel cells are exposed to artificial light of three different power levels. Secondly, the panel cells were shaded by one-quarter, half and three-quarters. Current-voltage and power-voltage characteristics were determined for both cases. Efficiency calculations were done at the maximum power point. It was observed that when the panel cells were exposed to artificial light sources, the power output and efficiency slightly increased and when exposed to shading, there was a significant reduction in power and efficiency.
Keywords: Photovoltaic, Artificial Light, Shading, Power, Maximum Power Point, Efficiency
Cite this paper: Andrew Zulu , Gelasius Kashweka , The Influence of Artificial Light and Shading on Photovoltaic Solar Panels, International Journal of Energy Engineering, Vol. 3 No. 1, 2013, pp. 15-20. doi: 10.5923/j.ijee.20130301.03.
Article Outline
1. Introduction
- Since the advent of the era of renewable energies, photovoltaic (PV) modules (or solar panels) have gained widespread use.A PV module converts the energy of the sun to electricity using the photovoltaic effect.This process of conversion is at present at most 18% efficient for mono - crystalline and polycrystalline silicon cells[1], hence a subject of research to try and get higher conversion efficiency.In addition to the above problem, the efficiency of use is affected, among other things, by shading and artificial light.Shading can be caused by trees, buildings or any obstacle directly in the line of solar radiation.It can also be attributed to clouds in the sky and other solar panels if not well arranged in an array or tilted solar panels under a ‘low’ sun!Situations where shading cannot be avoided can occur hence the need to cater for partial shading. This can be done by using bypass diodes[1] in order to bypass shaded cells. Shading on solar cells has been widely studies by researchers. It has been reported have an effect of reduction of cell power (since they are normally wired in series), changing the open-circuit voltage and the short-circuit current and reducing the efficiency[1, 2]. Shadows of irregular shape have been shown to give imprecise shadow lossresults[3], which is intuitively expected. Mathematical models and programs have been formulated to simulate shading losses on PV arrays[4-6]. For shadows that are caused by a ‘low’ sun illuminating an array of panels, reference[7] reports on a method of optimizing the module interconnections to increase energy yield.Under highly controlled conditions partial shading can improve performance as reported by reference[8].This is, however, a specialized and complicated procedure. Itsuffices to say that shading will generally reduce power output and hence is undesirable.Not much is known about the influence of artificial light on PV modules understandably because it rarely happens that solar panels are placed adjacent to artificial light sources.This investigation has widely been ignored by researchers but with modern changing home architectures, it could become significant.
2. The PV Module
- A PV cell is usually made up of layers of semi-conducting material, which is normally silicon.When the cells receive sunlight, an electric field develops across the layers resulting in the flow of electricity.PV modules come in different varieties: mono-crystalline, poly-crystalline, amorphous and thin film.The most common, currently, is the crystalline silicon panels[9], shown in Figure 1.A solar cell consists of p-doped and n-doped silicon material in a large-scale silicon diode.The electrical circuit of the cell is shown in Figure 2.The circuit parameters are as follows:I is the current at the output terminals; Iph is the light-generated current; ID is the diode current; VD is the diode voltage; V is the solar cell terminal voltage; R is the resistance of the load; RS is the internal resistance to the current flow.
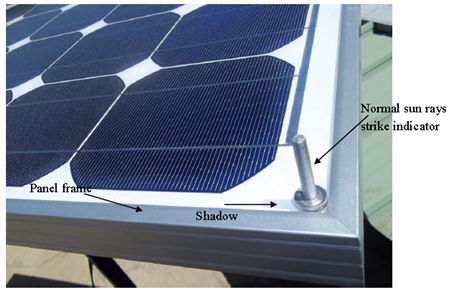 | Figure 1. Solar panel with normal sun rays indicator shown |
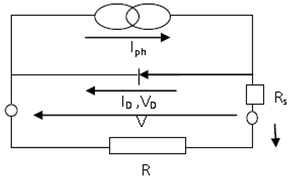 | Figure 2. The equivalent circuit of a PV solar cell |
3. Experimental Design
- The two experiments were done under the following conditions[10]:1. Experiments were done at the same temperature with a tolerance of ±2°2. Experiments were conducted quickly to avoid overheating of the panel3. The solar panel was free from dust.To measure solar irradiance, voltage and current, the pyranometer with auto-ranging multimeter functions (MT922 –Major Tech) was used. This solar power meter has the following specifications:Operating temperature and relative humidity (RH): 5℃ -40℃, below 80% RH. Display: 3½ digits LCD with maximum reading 1999.Accuracy: ±10 W/m2 or ±5%, whichever is greaterAdditional temperature-induced error: ±0.38 W/m2/℃.Range: 0-1999 W/m2.Digital Multimeter Functions:DC voltage: 1.0% rdg + 3digitsDC current: 2.0% rdg + 3digitsAC voltage (50-60 Hz): 1.0% rdg + 5 digitsAC current: 2.5% rdg + 8 digitsResistance: 1.2% rdg + 3digitsMaximum input voltage: 600 V AC/DCOperating temperature: 0℃ -40℃.At the beginning of the experiments, the MT-922 solar meter was calibrated against the Kipp& Zonen CMP 22 pyranometer and the TopTronic T48 digital multimeter. There literally no difference in readings with the MT-922 for both sunlight and digital multimeter readings. It is against this background that the authors believe the readings obtained in these experiments to be reliable.
3.1. Influence of Artificial Light
- A light bulb was shown on the center of the panel at a fixed distance of 500 mm.The circuit was set up using a 100-Ohm variable resistor as shown in Figure 3 with the panel tilted until the sun rays were normal to the panel.The solar irradiance was then measured using the pyranometer.The open-circuit voltage was obtained by measuring the panel voltage without the load by connecting the voltmeter across the panel.The short-circuit current was obtained by measuring the panel current without the load, by connecting the ammeter across the panel.The resistance was varied while observing voltage in one volt intervals until the current was zeroed, recording a pairs of voltage-current values.This procedure was then repeated for two more bulbs with different power.
 | Figure 3. Circuit setup for influence of artificial light |
 | Figure 4. Solar panel cells (75% covered) |
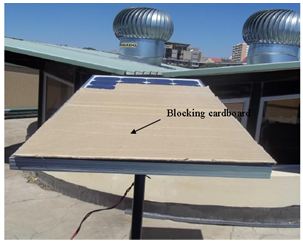
3.2. Influence of Shading
- The experiment was set up with a 1000-Ohm variable resistor with the panel tilted until the sun rays were normal to the panel. Three-quarters (75%) of the panel cells were then covered by a cardboard as shown in Figure 4.The open-circuit voltage and the short-circuit current were obtained by measuring the panel voltage without the load as before. This procedure was repeated for half (50%) and a quarter (25%) covering of the solar panel cells.
4. Results and Discussion
4.1. Influence of Artificial Light
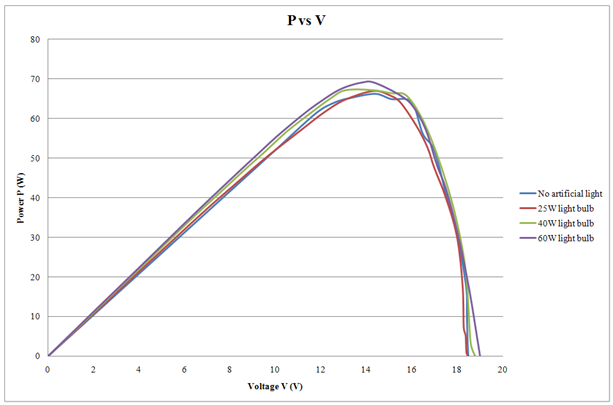
- The results were obtained as shown in Figures 5 (current-voltage) and 6 (power-voltage).Using the panel rated values, the efficiency can be calculated from the experimental results.From the current-voltage characteristic, it is observed that there is generally a slight increase in current with an increase in bulb wattage.This effect is more pronounced during with cell voltage below the maximum power point.An efficiency calculation (Pmax/Pin) shows the efficiency of the panel with no artificial light, 25-W, 40-W and 60-W light bulbs as 15%, 15.3%, 15.4% and 15.8% respectively, all measured with an instrument error of approximately ±1.2%. Clearly the efficiency, as expected, with an increase in wattage.From the power-voltage characteristic it is similarly observed that there is generally a slight increase in power with an increase in bulb wattage. This effect is more pronounced around the maximum power point region.The P-V curve parameters (Pmax, IMPP, VMPP, ISC, VOC) all show an upward trend with increase in wattage.
4.2. Influence of Shading
- The results were obtained as shown in Figures 7 (current-voltage) and 8 (power-voltage).Using the panel rated values, the efficiency can similarly be calculated from the experimental results.From the current-voltage characteristic, the current is significantly reduced for the 25% shading case, whereas the 50% and 75% cases show almost no current flow!Similarly, an efficiency calculation shows the efficiency of the panel with no shading, 25%, 50% and 75% shading as (13.3±1.1)%, (2.9±0.2)%, (0.8±0.1)% and (0.8±0.1)% respectively (uncertainty is due to instrument error). There clearly a significant decrease in efficiency with increased shading.From the power-voltage characteristic, the power is, similarly, significantly reduced for the 25% shading case, whereas the 50% and 75% cases show almost no current flow! Intuitively, one would expect a proportional decrease in power to shading i.e. 25% reduction for 25 shading.This does not happen since shaded cells use the current from other cells as they themselves become an electrical load.The PV cells do not have bypass diodes, so the current from the working cells passes through the shaded cells.In addition, the P-V curve parameters (Pmax, IMPP, VMPP, ISC, VOC) all show an downward trend with increase in shading).
 | Figure 5. Current-voltagecharacteristics of the PV module with different light bulbs |
 | Figure 6. Power-voltagecharacteristics of the PV module with different light bulbs |
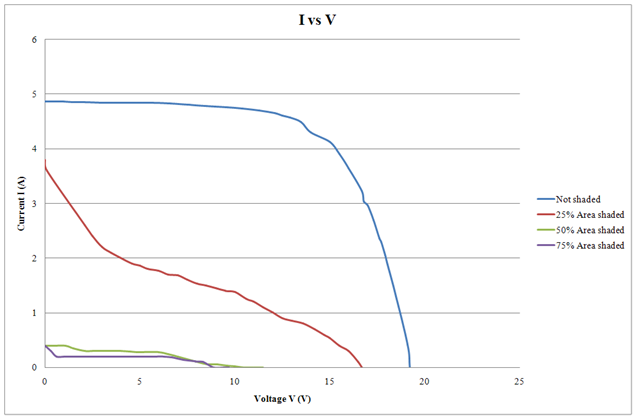 | Figure 7. Current-voltagecharacteristics of the shaded PV module |
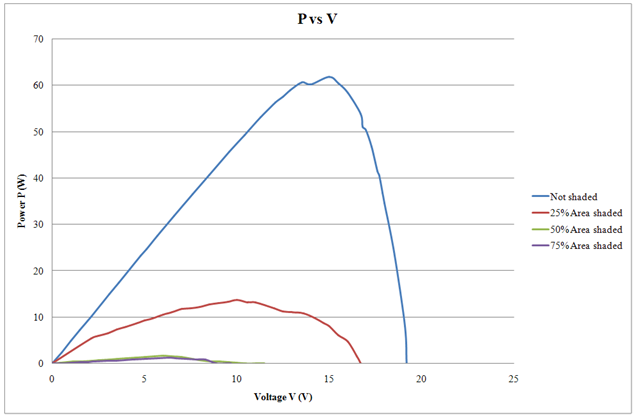 | Figure 8. Power-voltage characteristics of the shaded PV module |
5. Conclusions
- The power output, and hence efficiency, of a PV module slightly increases when exposes to artificial light and reduces significantly when exposed to shading.When installing PV modules, it is highly recommended that shading of any sort should be avoided as the power loss is very significant: decrease of about 75% for 25% shading and decrease of 90% for 50% shading. It’s self-defeating to use artificial light to power solar panels but any exposure to it, if unavoidable, will increase the power output of the panel. This increase was estimated at 0.01% per watt of artificial light exposed.