M. A. Mustafa , S. Abdelhady , A. A. Elweteedy
Mechanical Power Engineering Department, M.T.C., Cairo, Egypt
Correspondence to: M. A. Mustafa , Mechanical Power Engineering Department, M.T.C., Cairo, Egypt.
| Email: |  |
Copyright © 2012 Scientific & Academic Publishing. All Rights Reserved.
Abstract
The city of Aswan, located at the south of Egypt, is characterized by a very high level of solar density. The Solar Power Plant (SPT) technology using the Concentrated Solar Power Plant (CSP) is expected to soon enter the renewable energy field in Egypt. Fortunately, considerable amount of information about the PS10, which is a commercial SPT of power 11 MW are available for performing considerable attractive analysis. A comparative performance analysis is developed between the existing PS10 in Sanlúcar la Mayor- Spain, and a modified one of similar specifications located in Aswan. In this study, the PS10 Solar Power Tower systems (SPT) design-layout is revised to suit the solar data in Aswan. Accordingly, the location of each heliostat is reviewed, analysed and modified. The solar irradiance model and sunshine duration (solar hours) of the existing plant in Spain are compared to those in Aswan. The study includes optical and geometric analysis of both SPTs. The annual average efficiency and SPT performance values in the existing and intended power stations are compared. Suitable modifications are introduced in the SP10 to fit the conditions in Aswan according to the innovated field of the heliostats. The main objective of this study is to find the relative advantage of installation of the CSPs in Aswan compared to the other locations in the world. The innovated model of PS10 in Aswan is believed to be more promising than that of the original one in Spain.
Keywords:
Power Tower System, Heliostat Field Layout, Solar Power Tower System, CSP, Innovated PS10
Cite this paper:
M. A. Mustafa , S. Abdelhady , A. A. Elweteedy , "Analytical Study of an Innovated Solar Power Tower (PS10) in Aswan", International Journal of Energy Engineering, Vol. 2 No. 6, 2012, pp. 273-278. doi: 10.5923/j.ijee.20120206.01.
1. Introduction
A Solar Power Tower system is an attractive method to achieve massively huge power and high concentration of solar irradiance for electricity generation or thermal processes.The heliostat field layout is a key parameter in solar tower system to maximize the density of solar radiation and minimize the overall cost. For a specific location, the total solar insolation in SPT varies within each day of the year depending on latitude and state of atmosphere.For a specific configuration of SPT, the total solar density and total annual average optical efficiency vary from latitude to another on earth, leading to a change in the total output power of the system. The output power mainly depends on optical efficiency of solar field established by the heliostat field distribution and power tower receiver.The radial staggered arrangement of the heliostat field is seen as the most convenient distribution for heliostat fields and is considered the most efficient for a given land area owing to significant reduction of land usage and atmospheric losses. The optical efficiency depends mainly on heliostat field losses which consist of cosine effect, shading and blocking losses, imperfect mirror reflectivity, and atmospheric attenuation losses.The heliostat field layout is commonly optimized by FORTRAN or Matlab ® codes such as: HELIOS, ASPOC, HFLCAL, RCELL, DELSOL, MIRVAL, SOLERGY, DELSOL3, WinDELSOL1.0, SOLTRACE, MUEEN, SENSOL CIEMAT, SOLUCAR, AICIA, FIAT LUX and UHC[1-13].There are many solar power tower systems in Europe like PÉGASE (5.9 MW) in France, PS10 (11 MW) & PS20 (20MW) in Spain[14-16].In Egypt, the Concentrated Solar power (CSP) is promising in view of the high solar dense. The south of Egypt is one of the excellent locations at the world level for construction of CSP because of high solar insolation. The Aswan city, located in the south of Egypt, is virtually the second place of the most sunshine places all over the world.In this study, a comparative analysis is developed between the performance of an SPT in Sanlúcar la Mayor- Spain, PS10, and the performance of an intended one of similar specifications in Aswan- Egypt. The PS10 SPT with 11 MW installed in Spain has the best available information in concentrating solar thermal power plants [9,14,17-19]. Furthermore, it has a lower levelized cost of operation than any concentrating solar power plant that produces electricity.The study takes many steps in order to make the proposed comparison. In section 2, the calculation of sun position and average annual solar insolation are described as the input parameters to the SPT. Major aspects related to efficiency calculations are described as well. In section 3, PS10 SPT radial stagger configuration is revised. Solar insolation and solar power are calculated in the two cases. Efficiencies and output power in the two locations are calculated and compared.In section 4, the innovative new model configuration of PS10 is optimized according to the sun conditions of Aswan. The model analysis is conducted according to the new configuration. The total output power is recalculated and compared to the original one. The life cycle cost and levelized cost is estimated. Results are compared and conclusions are drawn.
2. Model Analysis Description
2.1. Solar Position
In order to determine the instantaneous heliostat field efficiency, the solar position computational model [20] will be calculated based on some defined angles. Solar declination angle, hour angle of sunrise and sunset are calculated as a function of day number and latitude angle: | (1) |
 | (2) |
The sun position relative to an observer on the ground is described by two angles, the solar altitude and azimuth [21]. | (3) |
 | (4) |
These equations are sufficiently accurate for heliostat placement for performing the required optimization.
2.2. Solar Insolation
The solar insolation is used as thermal input parameter to SPT in order to calculate the output power.The calculation of the total annual insolation, based on the hourly performance, with clear sky conditions, is done according to BIRD model. Such model is developed from a technical comparative evaluation of SOLTRAN 3, SOLTRAN 4 and the BRITE Monte Carlo global model [22]. The BIRD model mathematical equations are: | (5) |
 | (6) |
 | (7) |
2.3. Optical Efficiency
There are many important sources of energy loss in a central receiver system. These losses define the total system efficiency. The major losses are combined together to form the optical efficiency (ηfield). The optical efficiency is the ratio of the net power absorbed by the receiver to the power incident normally on the field (heliostat). It is a combination of several factors, including the cosine effect, mirror reflectivity, atmospheric attenuation and blocking & shading. The optical efficiency is calculated as follows [23]: | (8) |
 | (9) |
 | (10) |
The amount of shading and blocking in a particular field layout is a function of the heliostat spacing, tower height, and sun angle. Shading and blocking calculation for a single heliostat is accomplished by first calculating the pairwise intersection with every other heliostat in the directions of the sun and receiver, then finding the union of these intersections. Due to the computational expense, only a few codes for heliostat field optimization (e.g., Tonatiuh,) calculate exactly shading and blocking.
3. Output Power of PS10 in the Two Locations
3.1. Solar Insolation
The equations (5-7) are handled via an Excel sheet. The total global solar irradiance on a horizontal surface IT (W/m2) is calculated for the latitude of PS10 in town of Sanlúcar la Mayor in Spain (37.2º North Latitude and - 6.2º West longitude). The same procedure is conducted for the Aswan city (23.5º North Latitude and 33º West longitude). The results of global radiation incident upon a horizontal surface (W/m2) for the two locations are shown in figure 1.The total annual solar insolation for Sanlúcar la Mayor is 20.4 (GW/m2) and for Aswan is 23.6 (GW/m2). The sun hours for the two specified locations are shown in figure 2. The hourly average solar insolation for Sanlúcar la Mayor is 558 (W/m2), and for Aswan is 645 (W/m2).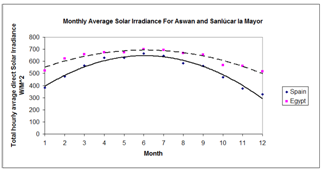 | Figure 1. Bird model hourly average global radiation incident upon a horizontal surface (W/m2) for two locations, Aswan – Egypt 23.5º and Sanlúcar la Mayor - Spain 37.2º |
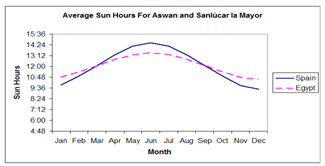 | Figure 2. Monthly average sun hours For Aswan and Sanlúcar la Mayor |
3.2. Optical Efficiency
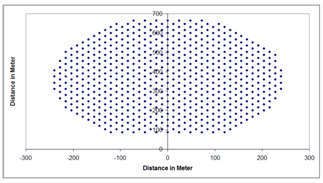
In order to calculate the yearly optical efficiency, the PS10 SPT configuration is revised for 624 heliostats. The position of each heliostat related to the receiver tower is determined. The resulting distribution of heliostat of PS10 is shown in figure 3.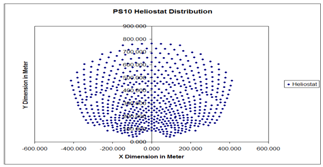 | Figure 3. Heliostat distribution positioning (meter) of PS10 around the receiver at point 0,0 |
The efficiencies of the PS10 are calculated for the two locations based on the sun conditions of the 21th day of each month (i.e., 12 reference days a year). The main differences between the two cases are the cosine, shading & blocking and atmospheric factors. All other factors are assumed to be fixed in the two cases according to the PS10 SPT real data.The average field cosine efficiency of the PS10 SPT for the whole year is calculated according to the PS10 configuration (figure 3), sun condition of the two locations and equation (3). The yearly field cosine efficiency is shown in figure 4 for both locations.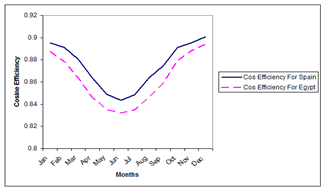 | Figure 4. Yearly field cosine efficiency |
The atmospheric transmittance efficiency shown in figure 5 indicates almost the same efficiency for the two locations.Shading and blocking efficiency is calculated according to the Tonatiuh code. The shading and blocking efficiency for Sanlúcar la Mayor is 0.9255 and for Aswan is 0.9378.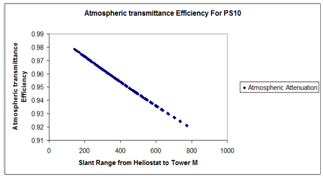 | Figure 5. PS10 SPT heliostat field Atmospheric transmittance efficiency |
The input parameters (solar insolation) are multiplied by the efficiencies in order to calculate the output power. The PS10 SPT calculated optical efficiencies and the fixed real data efficiencies like receiver and heat handling efficiency, thermal power to electric power efficiency and reflectivity of mirror efficiency are listed in table 1.| Table 1. Efficiency and power output of PS10 for the two locations |
| | | Sanlúcar la Mayor | Aswan | | Field cosine Efficiency % | 85.9 | 84.8 | | Atmospheric transmittance efficiency % | 95.4 | 95.4 | | Shadowing and blocking efficiency % | 92.55 | 94.78 | | Mirror reflectivity efficiency % | 88 | 88 | | Total optical Efficiency % | 66.74 | 67.47 | | Receiver and heat handling efficiency % | 92 | 92 | | Thermal Power to Electric Power Efficiency % | 30.7 | 30.7 | | Output Electric Power MW | 11.4 | 15.5 | | Total Efficiency at Nominal Rate % | 18.85 | 21.13 |
|
|
4. Innovated Model Validation
4.1. Tower Modification
The cosine efficiency of PS10 SPT in Aswan is lower than in Sanlúcar la Mayor by 1.1%. The cosine efficiency depends on tower height. To improve cosine efficiency of PS10 in Aswan, the field should extend far to the north. Correspondingly, the tower should be higher. One major limitation on the distance a heliostat could be placed away from the tower is the increase of the reflected beam attenuation (atmospheric transmittance). Theinterrelationship between tower height, cosine and atmospheric efficiencies for the solar conditions of PS10 in Aswan is shown in figure 6.The selected new tower height for Aswan is 160 meter. The atmospheric efficiency is reduced from 0.954 to 0.9475, whereas the cosine efficiency is raised from 0.848 to 0.8712. Consequently, the multiplied efficiency is raised by 1.65 %.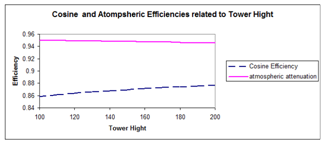 | Figure 6. Cosine and atmospheric efficiencies with variation of receiver tower height in Aswan |
4.2. Innovated Model Configuration and Recalculation
 | Figure 7. A new heliostat distribution positioning (meter) of innovated PS10 around the receiver at point (0, 0) |
| Table 2. Comparison of old and innovated PS10 configuration in Aswan |
| | | Old PS10 Aswan | Innovated PS10 Aswan | | Field cosine Efficiency % | 84.8 | 89.68 | | Atmospheric transmittance efficiency % | 95.4 | 94.9 | | Shadowing and blocking efficiency % | 94.78 | 94.12 | | Mirror reflectivity efficiency % | 88 | 88 | | Total optical Efficiency % | 67.47 | 70.4 | | Output Electric Power MW | 15.5 | 16.15 | | Total Efficiency at Nominal Rate % | 19.05 | 19.9 |
|
|
An innovated configuration of PS10 (624 heliostat) is optimized for maximizing the optical efficiency according the sun conditions of Aswan. The original PS10 radial stagger configuration optical efficiency is compared to the efficiency of the innovated one. The innovated PS10 configuration is shown in figure 7.The cosine, atmospheric transmittance and shading & blocking efficiencies are recalculated and compared to the original as listed in table 2.
5. Feasibility Study of Innovated PS10
The PS10 is built with lifetime of 25 years. It is owned by Abengoa Company. The total Cost is €35M ($47M), the specific cost is about 4200 $/kWgross. The PS10 SPT is co-funded by about $6.3M from European Commission under 5th Framework Programmed and about $2.2M from Andalusia Regional Government.PS10 - Spain produces about 24 GWh yearly. The economic feasibility of PS10 project is supported by Spanish legislation that foresee a solar tariff about 0,24 $/kWh over pool market electricity price for –CST (Concentrating Solar Thermal)– plants; this results in an approximate selling price for solar thermal electricity of about 0,28 $ per kWh [18].For the innovated PS10 in Aswan – Egypt, the total cost is assumed to be the same of the existing plant in Spain multiplied by the inflation rate of Euro. The inflation rate of the Euro according to Eurostat (the European Statistics website) [24] is illustrated in figure 8.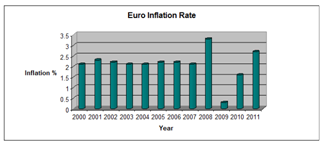 | Figure 8. Annual Euro Inflation Rates Chart (2000-2011) |
PS10 in Spain was built in December 2005 and opened in March 2007. In order to calculate the capital cost of the intended PS10 for Aswan in 2011, the inflation rates are taken from 2007 to 2011. The total calculated cost of the PS10 for Aswan in 2011 is €37.8M ($50.6M). The capital cost analysis of SPT [25] is illustrated in figure 9.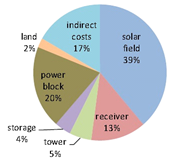 | Figure 9. Capital cost analysis for SPT systems |
The landing cost of the PS10 SPT is about 2% (about $1M). This can be ignored in Egypt due to the governmental support for national energy project on desert lands. The indirect cost also is reduced in Egypt due to the relatively low cost of labor and transportation. The indirect cost is 17% (about $8.6M). It is mainly the labor cost. In Egypt, the Egyptian labor cost is lower than in Europe by about 75%. The capital indirect cost of the innovated PS10 Aswan is about $2.1M. The total capital cost is reduced to $43M, the specific cost will be about 2660 $/kWgross. This is expected to reduce the costing of produced electricity.Another important factor is the operating and maintenance (O&M) cost, it is about 7.5% yearly of capital cost for SPT systems. O&M costs are expected to be reduced in Egypt compared to the operated plant in Europe. For a common scenario in Europe, about 4.5% of the total SPT capital cost yearly goes for operating and labors (about $2.2 M). Another 3% of capital cost yearly goes to replacement of the old parts in SPT system (about $1.4M). In Egypt, the yearly SPT operating and labor cost is reduced by 75% (equal about 0.5M $/year), while the yearly replacement cost still at 3% ($1.3M). The life cycle cost of operating and maintenance for PS10 SPT in Spain is $82.3M. In Egypt, the life cycle cost for operating and maintenance will be $43.2M. This is another factor affecting the cost of produced KWh.The total life cycle cost of PS10 SPT in Spain is about $138M. The total life cycle cost of the innovated one in Aswan will be about $88M. The life cycle cost for the two cases is presented in figure 10. SP10- Spain is producing yearly about 24 GWh. The innovated one in Egypt is expected to produce yearly 35.5 GWh. The Electricity Generation Cost of PS10 in Spain is equal to 0.23 $/kWh [25]. In Egypt, the produced electricity cost is expected to be 0.103 $/KWh.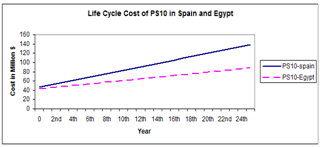 | Figure 10. Life cycle cost of PS10 in Spain and Egypt |
6. Conclusions
According to the previous analysis, the following conclusions could be drawn:2. The calculated total direct solar insolation in Aswan is higher than in Sanlúcar la Mayor by 16%. 3. The cosine efficiency of the PS10 SPT in Sanlúcar la Mayor is higher than in Aswan by 1.1%, while the output power in Aswan is 35.96% higher4. Increasing the receiver tower height by 45 meters for Aswan, the cosine efficiency is raised by 2.32% and atmospheric transmittance efficiency is decreased by 0.65%. 5. An innovated model is developed to fit the sun condition of Aswan. The innovated model is proven to yield an optical efficiency higher by 2.93% and an output power higher by 4.2% than the basic PS10 model of Aswan.6. The innovated SPT total net output power in Aswan is higher than the PS10 total net output power in Sanlúcar la Mayor by 41.6%.7. Finally, the feasibility study shows that the specific cost of energy of the innovated SPT in Aswan is lower by 36.66% than the PS10 in Spain, while the cost of energy production of the intended SPT in Aswan is 55.2% less than in PS10 in Spain.
Nomenclature
A:Sun Azimuth angle (degree)Ba: Ratio of the forward-scattered irradiance to the total scattered irradiance due to aerosolsIas: Solar irradiance on a horizontal surface from atmospheric scattering (W/m2)Id: Direct solar irradiance on a horizontal surface (W/m2)Io: Extraterrestrial solar irradiance ( 1353 W/m2)IT: Total global solar irradiance on a horizontal surface (W/m2)M: Air mass: Day Numberrg: Ground albedors : Sky, or atmospheric albedoS: slant distance from heliostat to receiver (kilometer)TA : Transmittance of aerosol absorptance and scatteringTAA: Transmittance of aerosol absorptanceTAS: Transmittance of dry air absorptance and scattering per WattTo: Transmittance of ozone absorptanceTR : Transmittance of Rayleigh scatteringTUM: Transmittance of absorptance of uniformly mixed gases (carbon dioxide and oxygen)Tw : Transmittance of water vapor absorptancexi Longitudinal coordinate of the heliostat center point relative to the receiver centeryi Transverse coordinate of the heliostat center point relative to the receiver centerZ : Angle between a line to the sun and the local zenith (degree)zi : Height coordinate of the heliostat center point relative to the receiver centerzo : Tower heightα : Sun Altitude angle : Sun Declination angle : latitude angle : Hour angleτα: atmospheric transmittanceηcos : The field cosine efficiencyηsh&bl : The shading & blocking efficiencyηref : The mirror reflectivityηatt : The atmospheric transmittance efficiency
References
| [1] | Pettit, R.B., Vittitoe, C.N., Biggs, F., 1983. Simplified calculation procedure for determining the amount of intercepted sunlight in an imaging solar concentrator. Journal of Solar Energy Engineering 105, 101-107. |
| [2] | Xiudong Wei et al. A new method for the design of the heliostat field layout for solar tower power plant. Renewable Energy an institutional journal. 35 (2010) 1970-1975 |
| [3] | Abatut JL, Achaibou A. Analysis and design of a field of heliostats for a solar power plant. Solar Energy 1978;21:453-63. |
| [4] | Siala FMF, Elayeb ME. Mathematical formulation of a graphical method for a no-blocking heliostat field layout. Renewable Energy 2001;23:77-92. |
| [5] | Xiudong Wei et al. A new code for the design and analysis of the heliostat field layout for power tower system. Solar Energy 84 (2010) 685-690 |
| [6] | Dellin, T.A., Fish, M.J., Yang, C.L., 1986. A user's manual for DELSOL3: a computer code for calculating the optical performance and optimal system design for solar thermal central receiver plants. Sandia National Labs Report SAND86-8018. |
| [7] | Garcia, P., Ferriere, A., Bezian, J.J., 2008. Codes for solar flux calculation dedicated to central receiver system applications: a comparative review. Solar Energy 82, 189-197. |
| [8] | Igel, E.A., Hughes, R.L., 1979. Optical analysis of solar facility heliostats. Solar Energy 22, 283-295. |
| [9] | PS10: a 11.0 MW Solar Tower Power Plant with Saturated Steam Receiver, 2005.Availablefrom :. |
| [10] | Marcelino Sa´nchez and Manuel Romero. Methodology for generation of heliostat field layout in central receiver systems based on yearly normalized energy surfaces. Solar Energy 80 (2006) 861-874 |
| [11] | Francisco J. Collado. Preliminary design of surrounding heliostat fields. Renewable Energy 34 (2009) 1359-1363 |
| [12] | Xiudong WEI et al. Optimization Procedure for Design of Heliostat Field Layout of a 1MWe Solar Tower Thermal Power Plant. |
| [13] | 10MWSolar Thermal Power Plant for Southern Spain, 2006. Available from:. |
| [14] | Annual Report 2001 of PSA, 2001. Available from: . |
| [15] | Annual Report 2003 of PSA, 2003. Available from: . |
| [16] | Bergeron, K. D., and C. J. Chiang (1980), "SCRAM: A Fast Computational Model for the Optical Performance of Point Focus Solar Central Receiver Systems," Sandia National Labs Report SAND80-0433, April. |
| [17] | Jim Hinkley et al, Concentrating solar power - drivers and opportunities for cost-competitive electricity, available at |
| [18] | Final Technical progress report availableat |
| [19] | Battleson, K.W.(1981), "Solar Power Tower Design Guide: Solar Thermal Central Receiver Power Systems, A Source of Electricity and/or Process Heat," Sandia National Labs Report SAND81-8005, April. |
| [20] | Duffe J. A., Beckman, W. A., Solar Engineering of Thermal Processes. Wiley 2006. |
| [21] | Noone, C. J., Ghobeity, A., Slocum, A. H., Tzamtzis, G., Mitsos, A., Site Selection for Hillside Central Receiver Solar Thermal Plants. Solar Energy 85 (5), 839-848. May 2011 |
| [22] | Richard E. Bird and Roland L. Hulstorm. A simplified clear sky model for direct and diffuse insolation on horizontal surface. Solar energy research institute. 1981. |
| [23] | William B. Stine and Michael Geyer, Power from the sun handbook, availableat |
| [24] | EuroStat Website availablefrom |
| [25] | Wen Zhang, Concentrating Solar Power - State of the Art, Cost Analysis and Pre-Feasibility Study for the Implementation in China, Universit?t Stuttgart, Institut für Energiewirtschaft und Rationelle Energieanwendung |
 Abstract
 Reference
 Full-Text PDF
 Full-Text HTML