-
Paper Information
- Next Paper
- Previous Paper
- Paper Submission
-
Journal Information
- About This Journal
- Editorial Board
- Current Issue
- Archive
- Author Guidelines
- Contact Us
International Journal of Energy Engineering
p-ISSN: 2163-1891 e-ISSN: 2163-1905
2012; 2(5): 232-241
doi: 10.5923/j.ijee.20120205.07
Effect of Load Shedding in Chinhoyi Urban Residential Areas, Zimbabwe
 Abstract
 Reference
 Full-Text PDF
 Full-Text HTML
Downmore Musademba 1, Martin Kanyepe 1, Luxmore Madiye 2, Tawanda Hove 2
1Department of Fuels and Energy, Chinhoyi University of Technology, P. Bag 7724, Chinhoyi, Zimbabwe
2Department of Mechanical Engineering, University of Zimbabwe, P.O.Box MP167, Mt Pleasant , Harare, Zimbabwe
Correspondence to: Downmore Musademba , Department of Fuels and Energy, Chinhoyi University of Technology, P. Bag 7724, Chinhoyi, Zimbabwe.
| Email: |  |
Copyright © 2012 Scientific & Academic Publishing. All Rights Reserved.
This paper presents the findings of the investigation carried out to establish the effects of load shedding in Chinhoyi Residential Urban areas, Zimbabwe. A questionnaire survey to assess the effects and establish the energy pattern and usage of alternative fuels during load shedding was conducted. The survey established that 60% of residence experienced losses in perishable food stuffs due refrigeration failure, 15% reported production downtime in their home industries with 10%having their electrical appliances such as television sets being damaged as a result of the power surges fashioned by the power outage. This has accordingly contributed in thinning the living standards of the residents. The survey also established a peculiar energy pattern and usage of alternative fuels for cooking and lighting during load shedding. Households in the low density areas of Chinhoyi displayed a wide energy matrix of relatively high quality fuels for both cooking and lighting. When compared to households in the high density areas, 55% of the households in low density cook mainly with LPG whereas 93% of households in high density areas cook exclusively with firewood. Use of candles was common for lighting in both residential sectors. Income for the residents was disproportionately eroded as a result of load shedding. The fraction of energy cost to income was found to increase from 16% without load shedding up to 64% for those in the low density and up to 49% for those in the high density areas. This has consequently impoverished the residents. Load shedding was also found to have coined household thieves with 65% of these being women who harvest wood illegally from farms and forests. This form of harvesting is uncontrolled and therefore unsustainable. The survey therefore concludes that women are unduly burdened by the power outage exercise and people in general have been reduced to poverty levels as they are left with dwindled income.
Keywords: Load Shedding, Generation Capacity, Fuel Wood, Energy Poverty
Article Outline
1. Introduction
- Zimbabwe has two large facilities for the generation of electrical power, the Kariba South Hydropower Station and the Hwange Thermal power Station. The latter is not capable of using its full capacity due to old age and maintenance problems[1]. The generation is undertaken by the Zimbabwe Power Company (ZPC) and the distribution and retail of electricity to the final end user is the business of the Zimbabwe Electricity Transmission and Distribution Company (ZETDC). These companies fall under the Zimbabwe Electricity Supply Authority (ZESA) which is the holding company for both enterprises. The ZETDC is also mandated to assure the nation with security of supplies. In this regard it is the sole buyer of power produced within or outside Zimbabwe. Table1 shows the installed generation capacity of the country. Of the installed capacity, Zimbabwe has the potential to generate 1870MW against a backdrop of 2500MW peak demand; this gives a deficit of 630MW which it has to meet through imports. There is certainly inadequate power generation capacity in Zimbabwe. Consequently the country imports 35% of its power generation from South Africa’s Eskom, Mozambique’s Hydroelectrica Cahora Bassa and the Democratic Republic of Congo’s Snel[3].
2. Methodology
2.1. Description of the Study Area
- Chinhoyi city is the provincial capital of Mashonaland West Province in Zimbabwe. The town is approximately 120 kilometers north-west of Harare along the main road to Kariba and Chirundu border with Zambia. The town is situated in a farming area. The population of Chinhoyi according to the 2002 national census was 56 794[8]. Municipality of Chinhoyi services the town which boosts of 8061 residential housing units of which 1195 housing units are located in the low density areas and 6866 in high density areas[9]. The town is electrified and all residential houses are connected to the grid with the exception of the newly acquired housing stands which are still under construction. The town suffers from excessive loadsheding which is negatively affecting energy dependent activities in the town. Chinhoyi experiences the following monthly average weather conditions; highest temperature in October at 31℃, minimum temperature in July at less than 5℃ and average wind speed at 3m/s. January is the wettest month recording 225mm rainfall and July is the driest month with the least precipitation of less than 10mm. Generally the climate is good for Agriculture.
2.2. Survey Design
- The Household Energy Survey was carried out in the city of Chinhoyi between February and April 2010 using stratified sampling. The methodology consisted of a household survey in which a questionnaire was distributed to respondents. The household was used as the enumeration unit because it is the basic consumption unit from which meaningful inferences on the energy matrix and use can be made. The survey was designed to investigate energy types and usage by Chinhoyi urban dwellers as alternatives to electricity during loadsheding, and to determine the effects of loadsheding on the urban dwellers. The study surveyed the pattern in the consumption of firewood, LPG, kerosene, diesel/petrol, candles and other fuel sources as alternatives to electricity use. The households were asked how much of each were consumed on a monthly basis and the financial implications of it deduced. The demographics of the survey concentrated on the high density and low density residential areas of Chinhoyi urban.
2.3. Data Collection
- Samples of 5% of the total housing units were used in both the low and high density residential areas. Homogeneous geographical clusters were randomly selected within each location of the high and low density neighborhood. Within each cluster, the housing units were selected at random, through a clustering point and a sampling interval designed to exhaust the sample. Undergraduate students in the department of Fuels and Energy at Chinhoyi University assisted as enumerators in this study. The students were appraised in administering the questionnaires. Each student undertook to survey twenty households (20 students and 403 households).
2.4. Data Analysis
- The findings of the household energy survey were analyzed with reference to the following aspects:-(a) the salient features of household energy consumption patterns in the selected areas(b) fuel-specific consumption patterns cross-referenced to geographical areas by status of linkage to income;(c) Energy management practices vis-a-vis the types of stoves used; and(d) Specific conditions relating to the social effects of load shedding
3. Results and Discussions
3.1. Bio-data and Demographic Information
- 70 % of the respondents found in the homes were female adults and 30 % were male adults. Of the respondents in the high density suburbs 33 % of them were gainfully employed with an average monthly income of less than US $150.00, 21 % were self employed barely making an income of $200.00 per month and 46 % were not employed but occasionally getting income from casual labour.For the low density suburbs, 70 % of the respondents were gainfully employed with an average income above $250.00 per month. 20 % were self employed also barely making an income of US$200.00 per month and 7% were unemployed but relied on income from children or relative in the diasporas with 3% unemployed and sporadically getting income through casual work.In the high density suburbs, the median number of people per household was a little over 6, with nearly 30 % of the households having 8 or more inhabitants and 5 % had 10 or more and the maximum recorded was 13 members in a single household. Whereas in the low density suburbs, the median number of people per household was 4, with nearly 20 % of the households having 6 or more inhabitants and the maximum recorded were 8 members.
3.2. Profile of Load Shedding in the High Density and Low Density Suburbs of Chinhoyi Urban Community
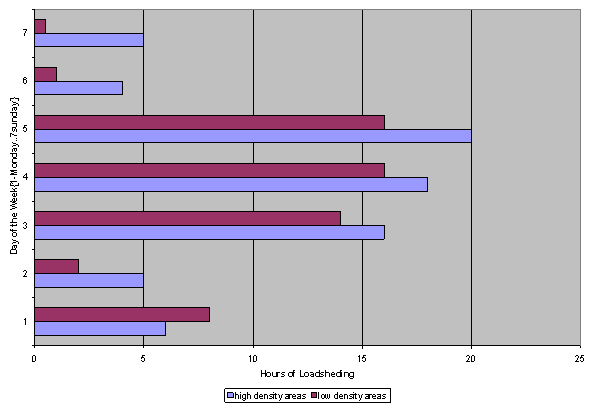 | Figure 1. Load shedding profile for Chinhoyi residential areas |
3.3. Direct Observable Effects of Load Shedding to Chinhoyi Urban Dwellers
- Residents of Chinhoyi urban, in both the low and high density areas indicated that the load shedding is random; the power provider seemed not to follow a fixed time. When the electricity is switched off there are some on and off fluctuations of power surges experienced and the same fluctuations are experienced during switching on of residents. These fluctuations together with the excessive long hours of power outages have caused undesirable effects to the residents. Table 2 shows a summary of the responses to the losses incurred by households in Chinhoyi as a result of the intermittent load shedding programme.
|
3.4. Fuel Substitution for Cooking
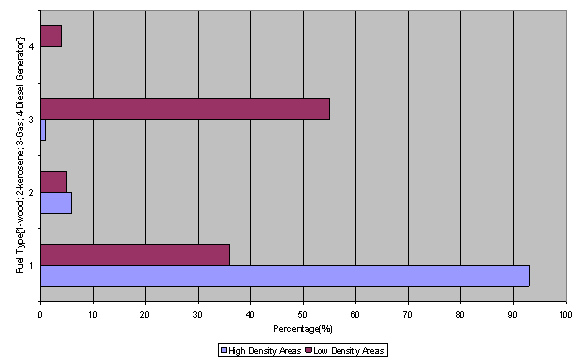 | Figure 2. Comparison of fuels used in substitution of electricity for cooking |
3.5. Fuel Substitution for Lighting
- Figure 3 shows a comparison of the households employing various fuel types for lighting in the low and high density areas of Chinhoyi Urban community.In the high density suburbs; it ca be noted that 72.8 % of the residents use candles only for lighting; 18 % use kerosene lamps only; 3% use rechargeable lamps only; 4% use a combination of rechargeable lamps and candles; with only 0.9% using diesel generator sets for lighting and powering of other electric appliances such as TV and radios. It was surprising to note that 1.3% of the respondents do not use any form of lighting during load shedding; they remain in darkness until the load shedding is lifted. The reason for not using any form of lighting was cited as being lack of money to buy the fuels for lighting.In the low density suburbs; 30% of the residents use diesel generator sets for lighting and powering of other electric appliances such as TV and radios. 60% use candles for lighting only; and 10% use a combination of candles and rechargeable lampsThe average consumption of candles on monthly basis was found to be 4 packets, each of 6 candles (i.e. 24 candle sticks) for the high density suburbs and for the low density suburbs the average candle consumption was 6 packets per month. This discrepancy can be explained by the lighting requirements of the households, also, the size of the rooms differ for different localities. In low density areas, the rooms are much bigger compared to those in the high density areas, this therefore means more light needed hence more candles consumed.Households using a combination of both candles and rechargeable lamps required on average 2 packets of candles per month.Households using single phase power diesel generators tended to use on average 40 liters of diesel per month for both lighting and powering of other electrical appliances, and households using kerosene for lighting only used 3 liters per month. A major concern is the effect of diesel exhaust which have been linked in numerous scientific studies to cancer, the exacerbation of asthma and other respiratory diseases15. Diesel exhaust has been found to contain nanoparticles which have been associated with damage to the cardiovascular system[11]. A draft report released by the EPA in February 1998 indicated that exposure to even low levels of diesel exhaust is likely to pose a risk of lung cancer and respiratory impairment[12]. The health risks from diesel exposure are greatest for children, the elderly, and people with respiratory problems and people who work or live near diesel exhaust sources. This implies that people who use diesel generators in their homes are at very high risk. Whereas people in the high density areas are at risk of smoke from burning firewood, those in the low density areas are at risk from diesel engine fumes.
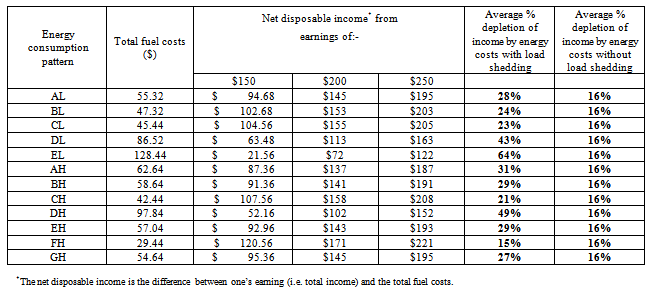
3.6. Financial Implications
- Table 3 shows the spread sheets for the average energy matrix expenses incurred by residence in the high and low density areas respectively. The different categories are compared. However, it must be noted that the average billing estimates used by ZESA for household use of electricity is 450kWh at a unit price of US$0.07/kWh. This quantity is equivalent to US$31.50 which must be paid to ZESA by each household. Table 3 must therefore be read with this baseline in mind.The following categories as shown in table 3 are herein defined:• Category AL & AH denotes households in low and high density areas respectively who cook exclusively with wood and use candles only for lighting.• BL & BH- households in low and high density areas respectively that cook almost exclusively with wood and use a combination of candles and rechargeable lamps for lighting.• CL & CH- households in low and high density areas respectively that use LPG for cooking and candles only for lighting.• DL & DH- households in low and high density areas respectively that cook exclusively with wood and use diesel generators for lighting.• EL & EH- households that use exclusively diesel generators for both cooking and lighting.• FL & FH- households that use kerosene exclusively for both cooking and lighting.The quantity (2 - 6) for candles in the table3; for example denotes that the least quantity of candles used per month was 2 packets and the maximum number used was 6 packets @ a price of $2.00 per packet. The fuel cost is thus calculated from (Unit price X Quantity of fuel consumed per month). The category AL which shows the costs incurred by the residence that cook exclusively with wood and use candles only for lighting in the low density areas, when compared with their counterparts AH in the high density areas, shows that those in category AL pay less for their energy provisions by 13.2%.
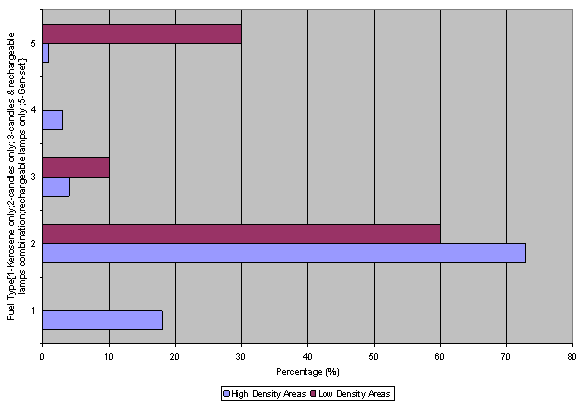 | Figure 3. Comparison of fuel type used in substitution of electricity for lighting |
| |||||||||||||||||||||||||||||||||||||||||||||||||||||||||||||||||||||||||||||||||||||||||||||||||||||||||||||||||||||||||||||||||||||||||||||||||||||||||||||||||||||||||||||||||||||||||||||||||
3.7. Energy Consumption Pattern Vs Disposable Income
- Demographic information revealed that the average monthly income levels for residents in the high density suburbs of Chinhoyi was below US$150.00 for 33 % of the residents who were gainfully employed, and 21 % who were self employed barely got US$200.00 per month, and 46 % indicated that they were not employed and hence relied mostly on casual labor opportunities. For the low density suburbs the income levels were found to be above US$250.00 for 70% of the respondents, with 20 % being self employed and getting a monthly income of US$200.00.
|
3.8. Procurement of Wood
- People in the low density areas of Chinhoyi and 55% of those from high density areas professed that they buy all their fuel wood requirements from fuel wood vendors who move door-to-door selling the commodity and at illegal selling points. However, 45 % of the respondents in high density areas indicated that they collect their own fuel wood from the near-by farms and forests. Collection of the fuel wood is usually done early in the morning around 0300 hours, for fear of the law enforcing agents. In other words the fuel wood is stolen and distances covered in transporting the fuel wood from these sites was found to be in the range of 5km to 15km depending on the location. 65 % of those who collect their own fuel wood for household consumption were women and only 35% were man. Male fuel wood gatherers indicated that they use men drawn push carts in ferrying the fuel wood, while women carry their bundles of fuel wood by head. Load shedding has thus coined household thieves who poach fuel wood from nearby farms and forests. This form of fuel wood harvesting is uncontrolled and therefore unsustainable, and if allowed to continue then satisfying future demand in urban settings might pose major environmental problems. Also, it has led to a massive harvesting of fuel wood by fuel wood traders and urban residents who have found a market in the energy starved residence of Chinhoyi. This is a threat to the extinction of flora and fauna leading consequently to environmental degradation. Women are unduly burdened by the power outage exercise. More women in Chinhoyi urban are involved in fuel wood collection than man. They spend hours gathering fuel wood in nearby farms and forests facing possible threats of sexual harassment in these isolated areas. They also suffer from the physical drudgery of carrying the rough heavy fuel wood bundles on their heads.
3.9. Energy and Fuel Management
- Households in both the low and high density residential areas of Chinhoyi tended to use several types of inefficient stoves particularly with fuel wood. 60% of the residents, who used fuel wood in Chinhoyi as fuel substitute to electricity, employed the use of three-stone stove when cooking. 30 % of the residents used unshielded four-legged metal grates which were more of stands for cooking pots than energy saving technologies and 10% used braai stands as stoves for cooking purposes. For the households cooking with fuel wood, 90 % did outdoor cooking; of this fraction 60 % of them do their cooking on open air adjacent to the wall of a building and 40 % had some form of roofed shelters which provided some wind break on the sides. 10 % did in-door cooking with fuel wood using the in-built fire hearth in kitchens.The results indicate that there is a lot of energy wastage from the types of stoves used. The stoves used are inefficient, and they are open to the air which carries away useful energy, hence resulting in consumption of more fuel. The setup is not fuel conservative. More so, use of fuel wood on the other hand was found to compromise the health of household members, especially when it is burned indoors without either a proper stove to help control the generation of smoke or a chimney to draw the smoke outside. Thus in addition to its relatively high cost, the use of fuel wood may promote higher medical care expenditures and diminish the poor’s ability to work productively. This is a clear indication that there is need for energy management and efficient utilization of energy education for people in Chinhoyi urban.
3.10. Poverty- loadsheding Nexus
- The energy dimension of poverty; energy poverty may be defined as the inability to cook with modern cooking fuels and the lack of a bare minimum of electric lighting to read or for other household and productive activities at sunset[13]. Load shedding in a way denies people of the reliable high quality energy services. Urban dwellers are left with very limited choice of affordable alternative fuels. This lack of adequate energy inputs can be a severe constraint on the economic and social development of people. People have been unable to carry-on with the activities of their backyard industries which depend solely on electricity; this has deprived many of their livelihoods. Some have been deprived of an opportunity to embark on adult evening education classes. This has a consequent effect of impoverishing people through the perpetuation of illiteracy. Analysis of the energy consumption patterns revealed the discrepancies associated with energy consumption costs for residence in the low and high density areas. The poor pay more money, or spend more time for energy services, than those who are better off[13]. This has a powerful implication. The economic hardship endured by poor households is inconspicuous when their income is evaluated in terms of its command over the basket of goods and services purchased by households with average income or consumption expenditures. When a greater portion of this income goes towards securing alternative energy and fuels, this implies that the vicious cycle of poverty is being catalyzed by load shedding management strategy of the utility company.
4. Conclusions
- In light of the findings from this survey, it can be concluded that load shedding has extended the dimension of energy poverty into the urban areas. People particularly those in the high density areas have been found to rely more on the use of less efficient traditional fuels and inefficient stoves which proved to be expensive and add misery to their lives. Consequently the income for residents in the high density areas is disproportionately eroded through poor choice of fuel alternatives compared to residents in the low density areas.Load shedding has also managed to impoverish the urban residents through losses incurred in the form of decayed food stuffs as a result of fridge failures, and damages to electrical appliances due to voltage fluctuations fashioned by the power outages. Some residents have also been deprived of opportunities for continued education through evening classes which could not take off for power failure. This consequently has an effect of perpetuating the poverty cycle which can be easily driven out through education. A number of enterprising urban dwellers that generate revenue from their backyard home industries which require the service of electricity are being starved of the prospect. The end result is further thinning of the living standards of Chinhoyi urban residents.Load shedding on the other hand has coerced women in particular to poach fuel wood from nearby farms and forests. This has also led to a massive harvesting of fuel wood by wood fuel traders who have found a ready market for the commodity in urban residential areas. This form of fuel wood harvesting is uncontrolled and therefore unsustainable and, if allowed to continue, is a threat to the extinction of flora and fauna leading consequently to environmental degradation. More women than men in Chinhoyi urban are involved in fuel wood collection, thus women have been found to be unduly burdened by the power outage exercise as they spend hours gathering fuel wood in nearby farms and forests. In such secluded places, they face possible threats of sexual harassment. They also suffer from the physical drudgery of carrying the rough heavy fuel wood bundles on their heads. Load shedding has thus brought untold suffering to the residents of Chinhoyi urban.
References
| [1] | Eng. Ben R. Rafemoyo, 2006, Demand-side Management: A Case for Zimbabwe, in The Zimbabwe Engineer, Volume 70 Number3, p13-16 |
| [2] | MOEPD, (2007) Zimbabwe Energy Sector Resource Assessment: Quantity, Distribution, Quality and Policy Options |
| [3] | MBendi; Electrical Power in Zimbabwe: An Overview; Online available:http://www.mbendi.com/indy/powr/af/zi/p0005.htm |
| [4] | Shukla Amitah, 2010, Zimbabwe Energy situation set to worsen; online available:http://newzimsituation.com/zimbabwe-energy-crisis-set-to-worsen-the-zimbabwe--48141.htm. |
| [5] | CZI REPORT: Delivering Accelerated Investment in Least Cost Power Generation and Supply as a means of enhancing competitiveness of business in Zimbabwe; online available: http://www.esabmonetwork.org/fileadmin/esabmo_uploads/Zimbabwe_Position_Paper_on_Electricity_09.pdf |
| [6] | Loadsheding-Definition of loadsheding by the free-dictionary; online available:http://www.thefreedictionary.com/load-shedding |
| [7] | Rolling blackout; online available:http://en.wikipedia.org/wiki/Rolling_blackout |
| [8] | Zimbabwe-City Population: Cities, Towns and Provinces; online available:http://www.citypopulation.de/zimbabwe.html. |
| [9] | Mlauzi T. 2010, Director of Housing and Community Services: Municipality of Chinhoyi; Personal communication. |
| [10] | World Health organization. The World Health Report 2002. Geneva |
| [11] | Anuqa.net: Diesel Emissions, kerosene and Air Pollution; online available: http://anuqa.net/diesel.php |
| [12] | Michael Simmons, 1998, The Effectiveness and Efficiency of EPA’s Air Program; online available:http://www.epa.gov/oig/reports/1998/8100057.pdf |
| [13] | UNDP (2006), Energizing Poverty Reduction. A Review of Energy-Poverty Nexus in Poverty Reduction Strategy Papers. |