-
Paper Information
- Next Paper
- Previous Paper
- Paper Submission
-
Journal Information
- About This Journal
- Editorial Board
- Current Issue
- Archive
- Author Guidelines
- Contact Us
International Journal of Energy Engineering
p-ISSN: 2163-1891 e-ISSN: 2163-1905
2012; 2(5): 202-209
doi: 10.5923/j.ijee.20120205.03
Thermal Stress Analysis in Structural Elements of HRSG Casing
 Abstract
 Reference
 Full-Text PDF
 Full-Text HTML
Hyuntae Shin 1, Daehee Kim 2, Hyungjun Ahn 2, Sangmin Choi 2, Gichul Myoung 3
1Power Plant Engineering Dep., Samsung Engineering Co., Ltd.,Seoul, 135-708, South Korea
2School of Mechanical Aerospace & Systems Engineering, Korea Advanced Institute of Science and Technology, Daejeon, 305-701, South Korea
3R & D Center, SeenTec Co., Ltd., Changwon, 641-969, South Korea
Correspondence to: Sangmin Choi , School of Mechanical Aerospace & Systems Engineering, Korea Advanced Institute of Science and Technology, Daejeon, 305-701, South Korea.
| Email: |  |
Copyright © 2012 Scientific & Academic Publishing. All Rights Reserved.
Heat recovery steam generators (HRSGs) are arranged at the tail end of gas turbines in combined cycle power plants (CCPPs), and are designed to withstand the hot gas environment approaching 600℃. In addition to higher thermal to power efficiency, CCPPs show superior response characteristics compared to those of other conventional steam power plants. For that reason, frequent load changes on the system, which sometimes include daily start and stop (DSS) operation, would impose additional burden on the structural elements. The main objective of this work is to analyze the thermal stress conditions as related to the observed failure on the structural elements of HRSG casing, and to find root causes of failure of mechanical integrity. To achieve this goal, field measurements were performed to record temperatures of wall and stiffener of the casing from a real plant in operation. To consider the effect of hot gas on the casing, computational fluid dynamic (CFD) analysis of gas flow inside the HRSG with appropriate wall conditions using FLUENT V12. Thermal stress analysis on the thin wall of the casing and stiffeners of HRSG was conducted with the temperature data from the CFD results, using ANSYS Workbench V12. Summarizing the computational results, some limited ideas were presented which would be useful to prevent damages.
Keywords: Heat Recovery Steam Generator, Thermal Stress, Casing, Finite Element Analysis, Computational Fluid Dynamics
Article Outline
1. Introduction
- Combined cycle power plants (CCPPs) enhance power generating efficiency by utilizing waste heat from the gas turbines, which would dispense some 60% of fuel energy as exhaust heat[1]. Waste heat is recovered to produce steam to generate electricity though a steam turbine. As a result, net thermal to power efficiency could exceed 50% in modern CCPPs[2](see Table 1). Heat recovery steam generator (HRSG) is a kind of a heat exchanger (or a boiler), which is connected to exit side of gas turbine(s). In general, exhaust gas from the gas turbine is cooled from 600℃ to 100℃, while water is superheated to 540℃ (at 12 MPa), in one of the typical plants (see Figure 1). Gas to water-steam heat exchangers are typically of finned tube type, and multiple layers of heat exchanger tube banks are stacked in a container, whose integral part is called HRSG. Because pressure of the gas is almost atmospheric and temperature of the gas is not high enough to require radiative furnacesurface,walls of the HRSGs are simply a casing with moder atethermal insulation. Selection of casing material andinsulation must accommodate the service requirements in the hot gas environment.
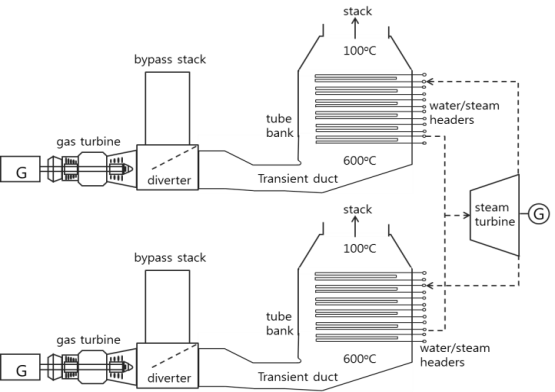 | Figure 1. A schematic of a HRSG in a typical CCPP |
2. HRSG Plant: Observation and Measurements
2.1. Plant Description
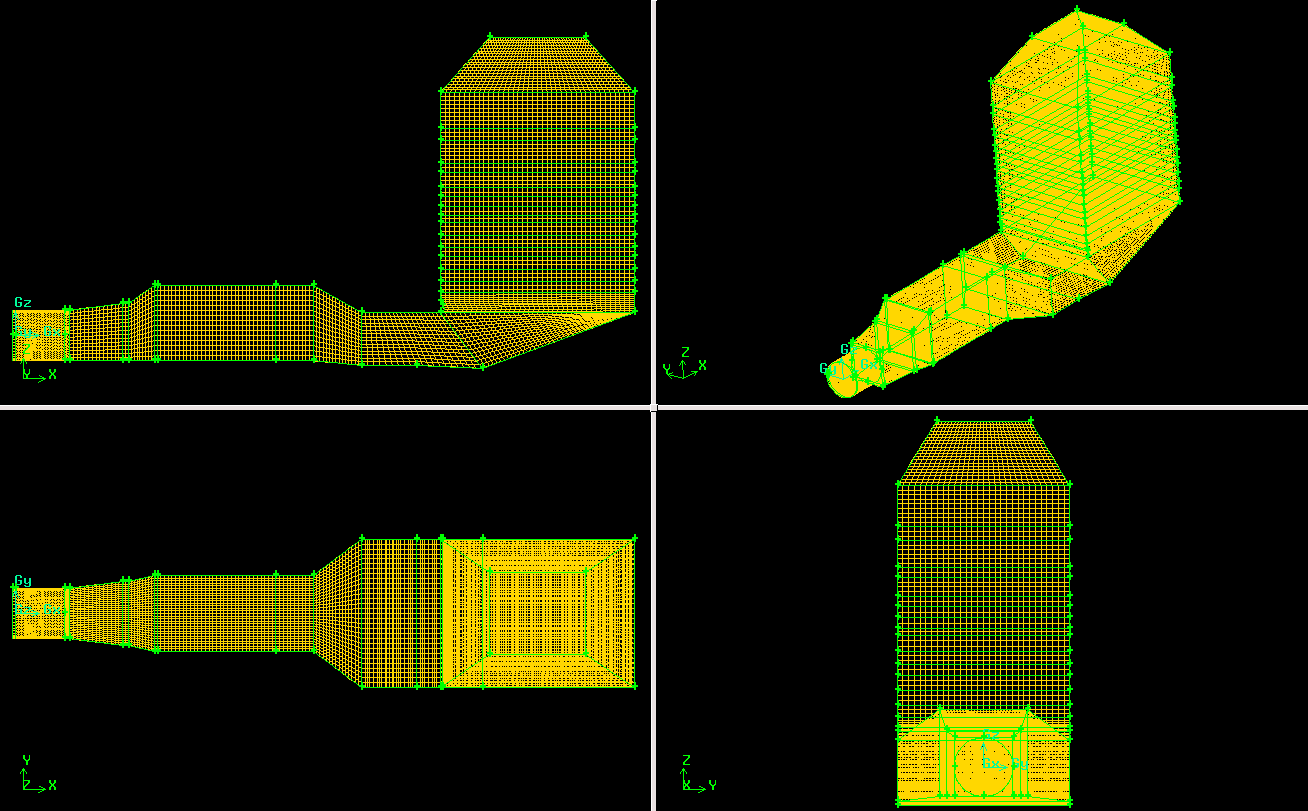
- Figure 1 shows the general arrangement of the HRSG of the plant considered in the case, which has 2x150MWe gas turbines and one 190MWe steam turbine. Each of the gas turbine is connected to its corresponding HRSG, and steam lines from two HRSGs are connected to a single steam turbine. Inside of HRSG, gas side temperature and pressure would drop as the gas flows across the tube banks. Tube banks of the HRSG are covered by a casing and stiffeners to support a thin-wall casing as shown in Figure 2. The entire HRSG is roughly divided into 3 parts as upper, middle and bottom, whose division is also roughly corresponding to the gas temperature and the mean temperature of the heat exchanger tube banks. Because of this temperature difference, different type of casing material and insulation are used in each part. Table 2 shows the selected casing material and insulation conditions of the designated casing wall. Inner insulation is only used in the bottom section to protect the duct plate from the relatively high gas temperature. Detailed view of the arrangement of the casing and insulation in the bottom section is shown in Figure 3. 6mm casing plate (duct plate) is covered by insulation blankets (inside 100mm, outside 300mm). The casing is also supported by outside stiffeners, type 1 and type 2.
 | Figure 2. HRSG casing wall and stiffener arrangement |
 | Figure 3. HRSG casing wall and stiffener arrangement |
| ||||||||||||||||||||||||||
2.2. Observed Failure in Structural Elements
- There have been several reports of damage on casing and tubes in the HRSG, which include broken casing, snapped stiffeners and elongated fin tubes. Some example photographs, which were taken after 7 years of commercial operation, are shown in Figure 4, (a) snapped stiffener and (b) broken casing.
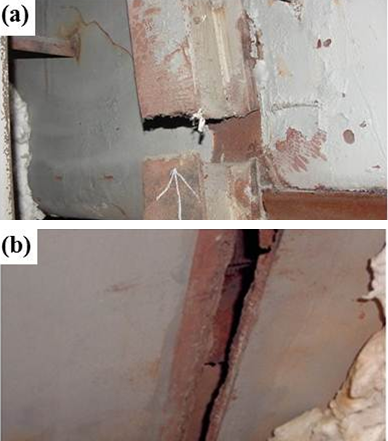 | Figure 4. Photographs of damaged part on HRSG: (a) Snapped stiffeners, (b) Broken casing |
2.3. Field Measurements
- In an attempt to quantitatively determine the thermal response of the HRSG casing, temperatures at selected positions on the casing and stiffeners were measured. K-type thermocouples were welded on the casing wall plates and stiffener beams, and data were collected by Yokogawa MV2048 multi-recorder. Total 14 points on the bottom casing and stiffeners were selected; 3 points on the side wall and 4 points on the rear wall as shown in Figure 5. Collected measurement data were compiled along with the necessary information from the existing data logging system of the plant.Gas-side temperature would be changing depending on the gas turbine load conditions among others, and temperature of HRSG casing walls would also be affected by heat transfer from the gas flow as well as heat loss to the environment. The questions related with temperature would include the absolute value of (for example, highest) temperature and time response of temperature at the selected positions. Two sets of measurement campaign were designed to derive information; time-wise recording of the temperature measurements at the selected positions during a cold start-up and a hot start-up. During the cold start-up, wall temperatures will rise from atmospheric, while the whole plant is being warmed-up through a relatively long transient process. The hot start-up case will provide information of the steady state value after passing through a short transient period.
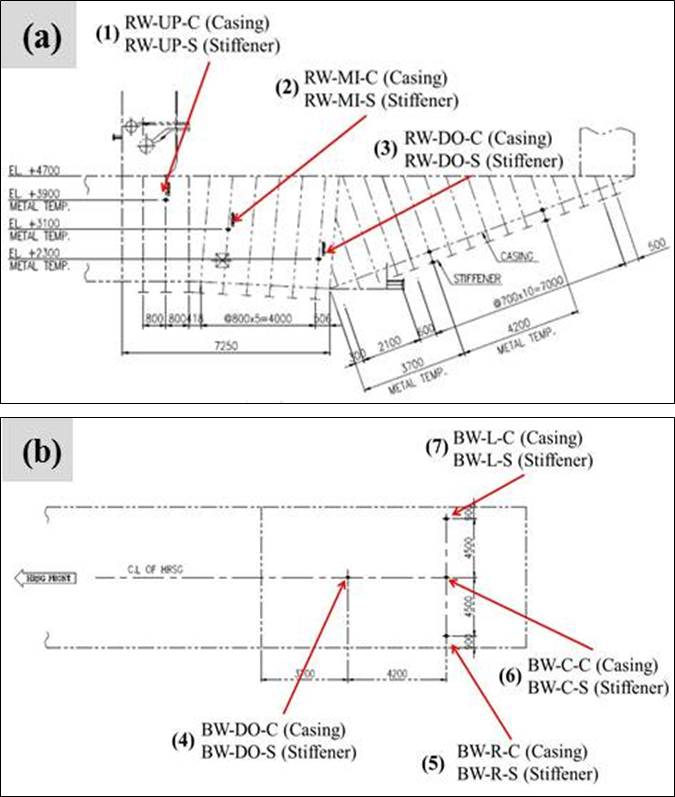 | Figure 5. Temperature measurement points for wall and stiffener: (a) Side wall, (b) Rear wall |
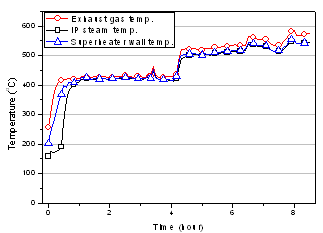
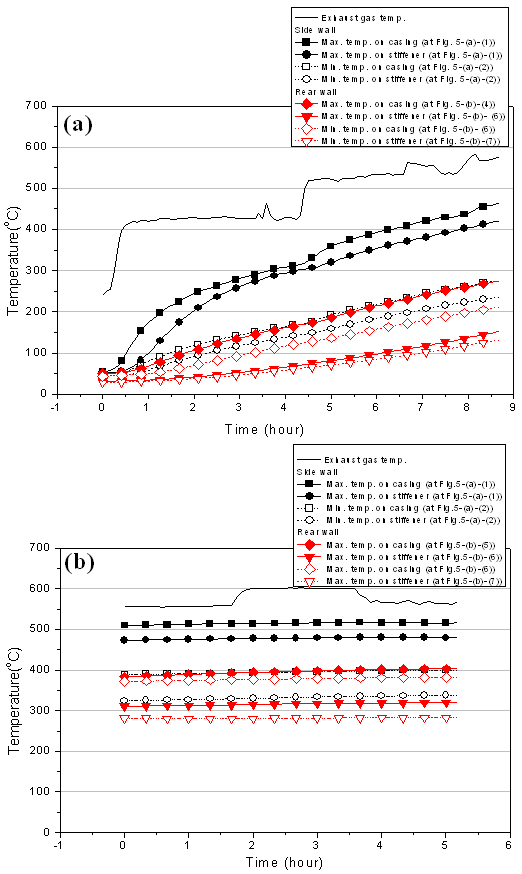 | Figure 6. Temperature measurement data: (a) Cold start and load following, (b) Hot start and load following |
3. Computational Analysis of Gas-side Flow, Heat Transfer and Thermal Stress in Casing Structure
3.1. Approach
- Hot gas flow from the gas turbine is introduced into the HRSG through a transition duct. It is of our interest to understand thermal stress in the structural elements of HRSG casing. Analysis of thermal stress would require comprehensive information of local temperature of structural elements. Field measurements of temperature on the selected positions could not provide adequate data for stress analysis, so combined simulation of gas-side flow and heat transfer and thermal stress in casing structure was performed. Geometric information is based on the unit considered in this case, and operating conditions information which is based on 100% full load operation are summarized in Table 3. Input values to express the pressure and temperature drop at the tube zone were decided based on data of the pressure and temperature in the Ulsan combined cycle power plant unit 2 as shown in Table 4. Both of the fluid dynamics and stress analysis are based on the steady state operation. Wall temperature data calculated from the CFD simulation was used for input condition in stress analysis.
 | Figure 7. Measured temperature profile of exhaust gas, superheater tube wall and steam |
| |||||||||||||||||||||||
|
3.2. CFD Model
- The computation domain starts from the tail end of gas turbine and extends to the exit of the HRSG connected to the stack (see Figure 7), to investigate the effect of geometry of the duct. One can notice that the main and by-pass stacks of HRSG were excluded from the domain. The grid pattern was selected in such a manner that the grid spacing was sufficiently fine for the region near the entrance of the tube zone. The total volume was divided into approximately 3 million elements. Fluent V12 was used for the numerical simulation with the RNG k-ε turbulence model[17]. Simulation of the tube zone was made possible by adopting a porous media assumption.Pressure drop across the tube banks was calculated as a source term added in momentum equation[18]. Number of Transfer Unit (NTU) model was used to calculate the heat transfer in the tube zone. Fan swirl velocity modelling was employed to express the swirl flow from the gas turbine[19]. Heat transfer from the hot gas to the wall is described by convective heat transfer. The convective heat transfer coefficient was calculated from the equation of turbulent duct heat transfer (Eg. (1))[20], which is different from the common correlation for turbulent flow, underthe assumption that the thermal-flow in the boiler is like a duct flow.
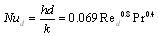 | (1) |
 | Figure 8. Measured temperature profile of exhaust gas, superheater tube wall and steam |
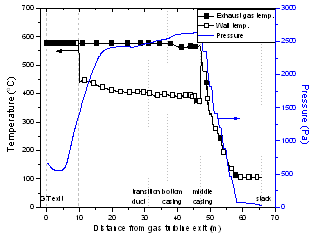 | Figure 9. Computed mean free stream temperature, wall temperature, and static pressure along the gas flow path(GT exit to stack) |
3.3. CFD Result
- Figure 9 shows exhaust gas temperature, wall temperature and pressure profile along the gas flow path ranging from the gas turbine exit to the stack by CFD analysis. Gas turbine exhaust gas temperature, which is approximately 580℃, is almost constant to the middle casing section. However, wall temperature decreases to 440℃ at 9.8m from the gas turbine exit and decreases gradually to 370℃ before the middle casing section. This wall temperature decrease is because of the boundary condition setting as no inner insulation. At the middle casing part, which has inner insulation, the casing temperature increased sharply. This sharp temperature increase is because that conduction heat transfer between adjacent casings is not considered in this CFD analysis. As expected, with passing each tube zone, both wall temperature and pressure decreased from 567℃, 2.6MPa to 100℃, 26Pa as a result of gas temperature decrease by heat exchange. Each seven horizontal short line in wall temperature and pressure from the middle casing to the stack means the heat exchange between hot gas and water in the tube zone. In the tube zone section, wall temperature is the same as gas temperature as a result of our analysis setting as explained in the previous section. These CFD results match well with the wall temperature and pressure of tube zone in the operation data of Ulsan combined cycle power plant unit 2 as shown in Figure 10.
 | Figure 10. Operation data[16] |
3.4. Thermal Stress Analysis
- Finite element stress analysis was conducted using ANSYS workbench V.12[21]. General boilers are supported by a hot beam at the top of the casing to consider heat expansion during operation, and this situation is the same at HRSGs. So fixed support condition at the top of the HRSG model was used. To conduct thermal stress analysis, wall temperature data from the CFD simulation was imported into the FEM model. The stiffener temperature was set reasonably as 144°C at the maximum load of gas turbine (cold start-up case) and 300°C at the steady state (hot start-up case) from the measured data on the rear wall. Wall pressure information from the CFD simulation was also used as input data for thermal stress analysis and it is shown in Figure 9. The wall pressure was about 2.6MPa at the middle casing and kept deceasing about 26Pa until the inlet to the stack.
3.5. Results and Interpretation
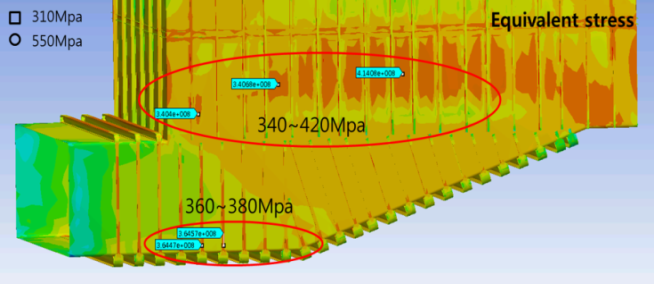
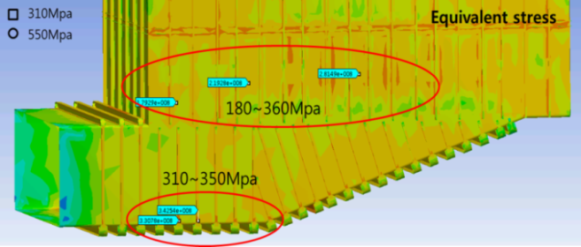
- Figure 11 and Figure 12 show the results of stress analysis at full load of gas turbine (cold start-up case) and at steady state (hot start-up case). In figures, the stress over the minimum yield stress suggested by ASME Boiler & Pressure Vessel Code was presented as a square box and the stresses over the yield stress suggested by Ahn et al. was presented as a circle box. Those values are 310MPa and 550MPa[22,23].At the full load of gas turbine in cold start-up case, maximum stress appeared in the middle casing part of side wall and in the front stiffener of bottom section as shown in Figure 11. At the steady state analysis in hot start-up case, maximum stress appeared in the same position with the full load case, but the value decreased as shown in Figure 12. The values of the maximum stress in two cases are summarized in Table 5. At the time of full load of gas turbine, on stiffener, the stress range on concentrated area was calculated as 360~380MPa and these stress values are over the minimum yield stress suggested by the Code, 310MPa. So the damage as shown in Figure 4-(a) arose at this area actually. On the side wall, the maximum stress range was calculated as 340~420MPa and the casing failure could be expected on this area, where is the boundary area between the inner insulation and none the inner insulation zone. According to the previous temperature measurement, much higher casing temperature compared to the others appeared near this concentrated stress area. So it might be that the leaked hot exhaust gas from this broken casing increased the casing temperature.
|
 | Figure 11. Result of thermal stress analysis at full load of gas turbine (cold start-up case) (a square box: the stress over the minimum yield stress suggested by ASME Boiler & Pressure Vessel Code, a circle box: the stresses over the yield stress suggested by Ahn et al.) |
 | Figure 12. Result of thermal stress analysis at steady state (hot start-up case) (a square box: the stress over the minimum yield stress suggested by ASME Boiler & Pressure Vessel Code, a circle box: the stresses over the yield stress suggested by Ahn et al.) |
4. Conclusions
- In this study, field measurements and combined fluid flow and thermal stress analysis were carried out to understand repeated thermal loading and its behavior on the HRSG casing during the start up. Analysis were conducted at two moments, when gas turbine reached to full load and wall temperature increased to its corresponding peak and steady state. From the present study, following conclusions can be drawn:1. During the start-up, stress concentration occurred at boundary between the wall with inner insulation and the other one without inner insulation. The values were over the minimum yield stress suggested. Also, high stress concentration appeared on the stiffener, where physical destruction was observed. 2. When the wall temperature reached to the peak and steady state, high temperature gradient on the side wall decreased and stress was mitigated as well. However, stresses on the stiffeners were still high. Repeated thermal loading on that area might be a main reason of casing failure.3. To prevent damage on HRSG casing and stiffener, the insulation configuration and its location on casing should be carefully selected to prevent arising large temperature difference and thus large thermal stress. Moreover, the constraint between wall and stiffener, such as sliding must be considered to solve the thermal expansion problem presented in this fixed constraint.
ACKNOWLEDGEMENTS
- The present work was supported by SeenTec Co. Ltd. and Brain Korea 21.
References
| [1] | J. H. Horlock, Combined Power Plants including Combined Cycle Gas Turbine (CCGT), Pergamon Press, Oxford, 1992 |
| [2] | Technology Status Report: Heat Recovery Steam Generator Technologies, Cleaner Coal Technology Programme, 2003 |
| [3] | K. G. Choi, A Study on the Variations of Duct Inside Turbulent Flow Structure and Heat Transfer Characteristics by Transition Duct Configuration, Ph. D. Thesis, Changwon University, Changwon, Republic of Korea, 2008 |
| [4] | Kim, T. S., Lee, D. K., and Ro, S. T., 1999, Analysis of thermal stress evolution in the steam drum during start-up of a heat recovery steam generator, Applied Thermal Engineering, 20, 977~992 |
| [5] | Tenbusch, A. F., 2003, CFD modeling of cogeneration burner applications and the significance of thermal radiative heat transfer effects, Proceeding of International Joint Power Generation Conference, 731-742 |
| [6] | Shin, H. T., Kim, D. H., Ahn, H. J., Choi, S. M., and Myoung, G. C., 2012, Investigation of the flow pattern in a complex inlet duct of a heat recovery steam generator, Energy and Power, 2(1), 1-8 |
| [7] | Matsumoto, H.,Takahasi, S., Akiyama, T., and Ishiguro, O., 1996,An expert system for startup optimization of combined cycle power plants under NOxemission regulation and machine life management, IEEE Transactions on Energy Conversion, 11(2), 414~422 |
| [8] | Kim, T. S., Lee, D. K., and Ro, S. T., 2000, Dynamic behavior analysis of a heat recovery steam generator during start-up, International Journal of Energy Research, 24(2), 137~149 |
| [9] | Shin, J. Y.,Jeon, Y. J., Maeng, D. J., Kim, J. S., and Ro, S. T.,2002, Analysis of dynamic characteristics of a combined-cycle power plant, Energy, 27 (12), 1085~1098 |
| [10] | Shirakawa, M.,Nakamoto, M., and Hosaka, S.,2005, Dynamic simulation and optimization of start-up processes in combined cycle power plants, Japan Society of Mechanical Engineering International Journal, 48(1), 122~128 |
| [11] | Alobaid, F.,Postler, R.,Strohle, J.,Epple, B., and Kim, H. G., 2008, Modeling and investigation start-up procedures of a combined cycle power plant, Applied Energy, 85(12),1173~1189 |
| [12] | Mustaga,A. H.,Hashmi,M. S.,Yilbas,B. S.,and Sunar, M., 2008, Investigation into thermal stresses in gas turbine transition-piece: Influence of material properties on stress levels, Journal of Materials Processing Technology, 201(1-3),369~373 |
| [13] | Kang, M. S., Yun, W. N., and Kim, J. S.,2009, Investigation of the thermo-mechanical crack initiation of the gas turbine casing using finite element analysis, The Korean Society for Power System Engineering, 13(5), 52~58 |
| [14] | Lee, B. Y., and Cho, J. R., 1998, Structural analysis of high pressure steam turbine casings for power plants using the BEM and the FEM, The Korea Society of Marine Engineering, 22(5), 609~616 |
| [15] | Choi, W.,and Hyun, J.,2008, A life assessment for steam turbine casing using inelastic analysis, Modern Physics Letters B, 22(11), 1141~1146 |
| [16] | Data Book of Ulsan Combined Cycle Power Plant Unit 2, Korea Power Engineering Company Inc.,1997 |
| [17] | Fluent 6.3 User's Guide, FLUENT Inc., 2006 |
| [18] | Cho, J. M., Choi, J. W., Hong, S. H., Kim, K. C., Na, J. H.,and Lee, J. Y., 2006, Application of computational fluid dynamics analysis for improving performance of commercial scale selective catalytic reduction, Korean Journal of Chemical Engineering, 23(1), 43~56 |
| [19] | Yoo, G. J., Choi, H. K., Choi, K. L., and Shin, B. J.,2009, A numerical study of the turbulent flow characteristics in the inlet transition square duct based on roof configuration, Transaction of Korea Society of Mechanical Engineers(B), 33(7), 541~551 |
| [20] | F. R. Steward, Mathematical Simulation of Industrial Boiler by the Zone Method of Analysis, Heat transfer in Flames, Scripta Book Company, 1974 |
| [21] | S. Moaveni, Finite Element Analysis – Theory an Application with ANSYS, Pearson Education, 2008 |
| [22] | ASME Bolier& Pressure Vessel Code Sec. II, ASME, 2007 |
| [23] | Ahn, S. G., Huh, Y. H., and Park, J. H., 2000, Measurement and application of J-R curves of Cr-Mo steel and Cr steel, Transaction of Korea Society of Mechanical Engineers(A),328~332 |