-
Paper Information
- Next Paper
- Previous Paper
- Paper Submission
-
Journal Information
- About This Journal
- Editorial Board
- Current Issue
- Archive
- Author Guidelines
- Contact Us
International Journal of Energy Engineering
p-ISSN: 2163-1891 e-ISSN: 2163-1905
2012; 2(4): 171-176
doi: 10.5923/j.ijee.20120204.09
Detection of Arc in the Transmission Power Lines
 Abstract
 Reference
 Full-Text PDF
 Full-Text HTML
Paweł Kostyła
Department of Electrical Engineering, Wroclaw University of Technology, 50-370 Wroclaw, Poland
Correspondence to: Paweł Kostyła , Department of Electrical Engineering, Wroclaw University of Technology, 50-370 Wroclaw, Poland.
| Email: |  |
Copyright © 2012 Scientific & Academic Publishing. All Rights Reserved.
One- and three-phase automatic reclosing of power lines, after short circuit shutdown, is a very effective way to improve the reliability of power delivery. Re-closing while the fault is not cleared can be dangerous for some electrical appliances. This paper provides a description of two optimization methods concerning the detection of arc in the transmission power lines. The first method is based on least squares approach (LS) and second on total least squares approach (TLS). In order to identify a short-circuit arc, it is proposed to use the degree of distortion of the voltage curve at the beginning of the line, therefore the both methods are based on the estimation of parameters in real-time voltage signals and an analysis of error estimation. An artificial neural network has been proposed to solve the problem in real time. The problems are formulated as optimization tasks and solved using the steepest descent continuous-time optimization algorithm. The network based on the TLS criterion realizes the optimization process under the assumption that the signal model can also be deteriorated (frequency or sampling interval fluctuation and so forth). In comparison to LS estimation, the TLS estimation effect is more reliable when higher sampling frequency and a wider sampling window is applied. The benefit of this research is the innovative possibility of fast detection of arcing faults in real time.
Keywords: Neural Network, Signal Processing, Optimization Problem, Arc Voltage, Parallel Algorithms
Article Outline
1. Introduction
- Occurrence of a short circuit in the electric power system can become dangerous for electrical equipment. When an arcing fault occurs in the transmission power line, a primary arc is formed and is presented during fault duration until the moment when the breakers open[13-15], so one- and three-phase automatic re-closing of power lines, after short circuit shutdown, is a very effective way to improve the reliability of power system. Most of the faults in overhead lines to arc. After switching off of the fault, the arc zone is deionizated. This makes the reclosing possible.During a short circuit, arc voltage at the beginning of the line is the sum of the voltage drop across the line impedances and arc voltage. Arc voltage is distorted due to its nonlinear nature. Arc has very little influence on the current waveform, because the value of the arc voltage is much smaller in relation to the phase voltages. It can, therefore, be assumed that a current waveform is sinusoidal[4, 6]. In order to identify a short-circuit arc, it is proposed to use the degree of distortion of the voltage curve at the beginning of the line. The type of distortion changes within the time of the arc’s appearance. The voltage of the arc grows along with the distortion level of the current. To determine the degree of voltage distortion, the parameters of the fundamentalcomponent in voltage are necessary. In addition to theestimated parameters, the estimation errors can appear, which are good indictors for computing the degree of distortion of the curve of the test voltage. This paper provides a description of two optimization methods concerning the detection of arc in the transmission power lines. The first method is based on least squares approach (LS) and second on total least squares approach (TLS). In order to identify a short-circuit arc, it is proposed to use the degree of distortion of the voltage curve at the beginning of the line, so the both methods are based on the estimation of parameters in real-time voltage signals and an analysis of error estimation. To solve this problem, the artificial recursive neural network was employed[2-5]. Methods, accessible in the literature[8-9], for solving systems of linear equations are modified and adapted for signal processing problems. The problems are formulated as optimization problems and solved by using the steepest descent continuous-time optimization algorithm[10-12]. Lengthening of the arc increases the value of the estimation error. This increase is proposed to be used as a criterion for distinguishing between short-circuits with and without arc. It should be noted that after the opening of the short-circuited phase, the occurrence of secondary arc is observed[1]. Over time, this arc is extended, and its length can reach a value of up to ten times greater than its initial value. Thus the increase in the error estimation of the fundamental component of secondary arc voltage can also be used to detect an arc fault.In comparison to the LS estimation, the TLS estimation effect is more reliable when higher sampling frequency and a wider sampling window is applied. Results will be useful in arcing fault detection.
2. Presentation Methods
- During an arc fault line, the initial value of arc voltage can be determined from the fact that the voltage gradient is constant and independent of the current. The minimum length of arc for single phase fault can be determined from the length of the chain of insulators.During the arc fault length in the atmosphere is changing[6]. Lengthening is caused mainly by: - magnetic forces depending on the fault current, also: - plasma convection and the ambient air, and - wind.Lengthening of the duration of the disturbance, increases the degree of distortion voltage curve, which is proposed to be used for detecting short-circuit arc. The increase in deformation of voltage curve during the fault indicates arc fault. If the original curve is not extended, the secondary arc can be used. Arc faults are not always transient. If during an arc fault the arc is not extended, there is little chance of a successful line reclosing.In order to determine the degree of voltage distortion, the parameters of the fundamental harmonic of this tension must be determined. For determining the parameters of the primary components of the signal, adaptive neural networks can be applied recursively,[2, 4]. The problem is formulated as an optimization problem that can be solved by the method of steepest descent and total least squares method.
3. Algorithms of Network Operation
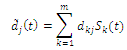
- The fundamental component of the voltage in the power system is given by:
 | (1) |
 - amplitudes orthogonal of signal components,
 - known pulsation of signal component (50 Hz).The measured signal contains noise and various distortion, so that:
 | (2) |
 (T -sampling period). The number of samples exceeds the number of components of measured voltage.
 3.1. Least Squares Approach
- Fast estimation of parameters of the basic components of voltages from measured data is very important for measurement, control and protection tasks in electrical power systems. It is difficult to filter out frequency components close to the fundamental frequency without delaying the filter response.In this section an adaptive neural network has been proposed for estimation of the amplitudes
 and
and  of distorted sinusoidal signals[5].To find
  and
and  in eq. (2) the standard least-squares optimization criterion has been chosen. The energy function E(U) can be minimized by implementing the steepest descent optimization algorithm:
 | (3) |
 | (4) |
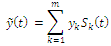
 | (5) |
 . For each value of the test samples the input signal supplied to the network obtained the corresponding estimation error em. Sum of squared estimation errors over one period is a measure of the degree of distortion and voltage curve expressed by the formula:
 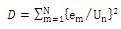 | (6) |
 - nominal voltage.After completion of the procedures for the degree of distortion D for the voltage of the first period, the sampling window NT was shifted by one-half of that period, and the entire procedure was repeated again.The optimization neural networks can be designed on the basis of various criteria of estimation. The network projected on the basis of the least square error criterion is the simplest in its structure and is distinguished by the shortest computation time. Unfortunately, such network is sensitive to the level of noise interference of normal distribution and to the level of signal interference by higher harmonics, particularly in the situation when the signal frequency is changeable during the measurements.
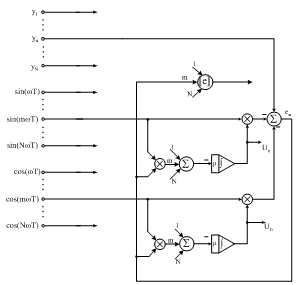 | Figure 1. A fragment of artificial neural network for detection of arc, which realises the algorithm according to the set of eqns (4) and (5) |
3.2. Total Least Squares Approach
- In order to eliminate the inconvenience, the networks, as already mentioned, based on the TLS and RTLS criteria were proposed. From a practical point of view, it has been assumed that the voltage y(t) has been measured in a closed time period as a result of N samples acquisition process. Sampled measured signals have been received as

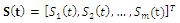
 (T -sampling period). The number of samples exceeds the number of components of measured voltage. The problem of estimation may be formulated in the following way: Find the vector:
 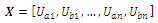 , which minimizes adequately selected energy function E(X). In order to solve such defined task, the total least-squares (TLS) and the robust total least-squares (RTLS) criteria has been adopted[6]. On the basis of values y(t) it is necessary to find or to estimate in real time the amplitudes Uai, Ubi of its representation referring to:
 | (7) |
 | (8) |
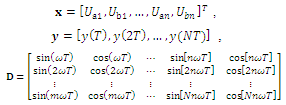 y(T), y(2T),…, y(NT)- sampled values of noisy signal y(t),x – vector of estimated voltage components parameters.Whereas the method of least squares minimizes the prediction errors, the technique of total least squares minimizes the error normal to the graph of the linear predictor. The least squares technique (LS)[2, 9] is relatively simple, however the approach is optimal only if matrix D is exactly known and the vector y is contaminated by a Gaussian noise.In practice, the matrix D is also distorted by error. In fact, the frequency ω is not exactly known. Moreover, it can slightly fluctuate during the measurement, and these fluctuations are unknown. Furthermore, the sampling period is sometimes not fixed but also fluctuates (i.e. the sampling of the signal is not ideally regular). For these reasons, to obtain more reliable and robust solution, the total least squares (TLS) approach is applied. The TLS criterion assumes errors both in the matrix D and in the vector y.The TLS problem can be formulated as minimization of the following instantaneous energy function[6]:
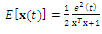 | (9) |
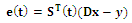 ,
, - is the vector of zero-mean noise sources.Applying the gradient descent approach, the system of differential equations, after linearization, is obtained:
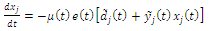 | (10) |
 μ(t)>0 learning rate.Since the TLS algorithm is rather sensitive to noise and kind of distributed errors, especially in the presence of outliers, this implies that we need to modify or generalize the TLS algorithm to eliminate, as far as possible, outlying points or large spiky noise. This fact was the main motivation for development and investigation of a new generalized algorithm called Robust Total Least Squares (RTLS) algorithm.The learning algorithm (10) can be extended as follows:
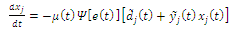 | (11) |
 functions and learning rate μ(t) which is stored in the memory. The network structure includes 2n integrators and N parallel calculating channels. At their inputs, the signal samples and the values of signal parameters estimated by the sets at a given moment are delivered. Feedbacks are recognized and that is why such networks are categorised as recurrent type. All the N samples of signal are provided to the system at the same time, which requires adopting a suitable sampling and memory system.
 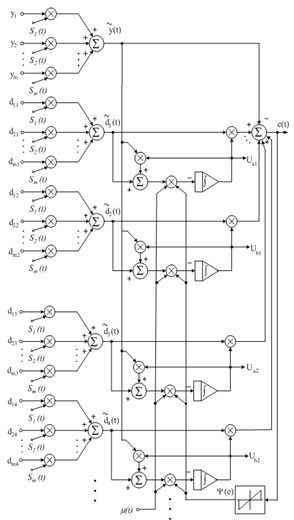 | Figure 2. A fragment of artificial neural network for detection of arc, which realises the algorithm according to the set of equation (11) |
 is nonlinear activation function enabling suppression or neglect of large error, e.g.:
  The network determines amplitudes respectively:
4. Results
- The system of artificial neural network described in the previous chapter has been implemented and using Matlab Simulink environment[13]. Extensive computer simulation experiments have confirmed the validity and performance of the proposed algorithms.
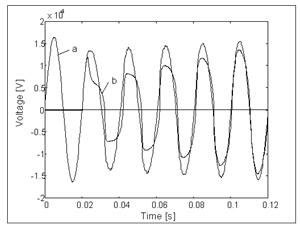 | Figure 3. The course of the simulated arc voltage (a) and voltage at the beginning of the line (b) |
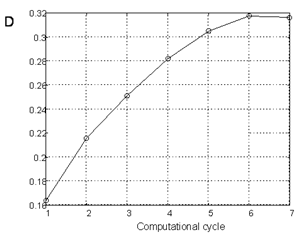 | Figure 4. Voltage distortion for the course (Fig. 3) |
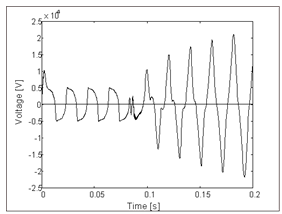 | Figure 5. Secondary arc voltage |
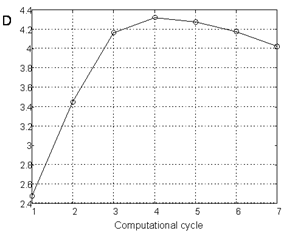 | Figure 6. Distortion of the secondary arc voltage (Fig. 5) |
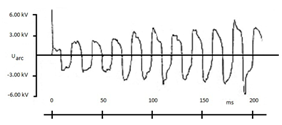 | Figure 7. The waveforms of the arc voltage of 110 kV insulators system |
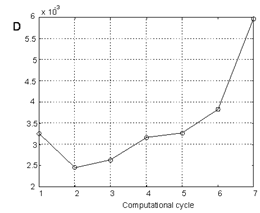 | Figure 8. Distortion of the arc voltage (Fig. 7) |
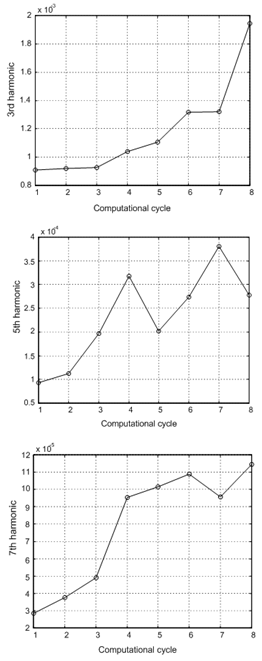 | Figure 9. The higher harmonics of voltage for the short circuit in the line 110 kV |
5. Conclusions
- Adaptive analogue neural networks represent a very promising approach for high-speed estimation of parameters of signals. In this paper algorithms and architectures of neuron-like adaptive circuits have been proposed. The algorithms for steady-state conditions enable us to estimate the amplitudes and the frequency of the fundamental component of voltages. During a short circuit arc power line arc length can be changed. Lengthening of the arc during a short circuit causes the arc voltage increases and thus the degree of distortion of line voltage. Simple recursive neural network allows it to set parameters of the fundamental component of voltage and simultaneously creates the possibility of reading errors of estimation of these parameters. With the lengthening of the arc increases estimation errors of the basic component of voltage, which voltage difference between the samples and the values determined the fundamental component. The increase in the value of line voltage distortion during the accident points to short-circuit arc. If you do not lengthen the arc of the original should be considered a secondary arc. The networks constructed according to the new algorithm based on the TLS and RTLS criteria:a) demonstrated greater resistance to the level of noise interference of normal distribution and the level of signal interference by higher harmonics in comparison with the networks designed on the basis of the standard LS criterion;b) provide more accurate results of amplitude estimation in case of frequency fluctuations in the studied signal – the errors do not exceed 1%;c) the time of the convergence of trajectory of the assigned parameters is shorter than in case of application of LS criterion; d) the network based on the TLS criterion is sensitive to impulse interferencee) the network based on the RTLS criterion is characterized by better resistance to impulse interference in comparison with the TLS criterion.Extensive computer simulation experiments confirmed the validity and performance of the proposed algorithms.