-
Paper Information
- Paper Submission
-
Journal Information
- About This Journal
- Editorial Board
- Current Issue
- Archive
- Author Guidelines
- Contact Us
International Journal of Energy Engineering
p-ISSN: 2163-1891 e-ISSN: 2163-1905
2012; 2(4): 151-164
doi:10.5923/j.ijee.20120204.07
Energy Optimization at Datacenters in Two Different Locations of Nigeria
 Abstract
 Reference
 Full-Text PDF
 Full-text HTML
Vincent Anayochukwu Ani1, Anthony Ndubueze Nzeako1, Jonathan Chigbo Obianuko2
1Department of Electronic Engineering, University of Nigeria, Nsukka, Nigeria
2Department of Agricultural Engineering, Kaduna Polytechnic, Kaduna, Nigeria
Correspondence to: Vincent Anayochukwu Ani, Department of Electronic Engineering, University of Nigeria, Nsukka, Nigeria.
| Email: |  |
Copyright © 2012 Scientific & Academic Publishing. All Rights Reserved.
Two areas within the nation (Nigeria) were chosen for the energy optimization of their Datacenters. The evaluations of combinations of different specific energy options were used to determine the least-cost energy pathway for the optimization of each Datacenter’s power. The optimization approach conducted was a sequential search for a possible option and combinations of grid supply, diesel generator, wind turbine and solar photovoltaic cell power generation. The results show that, grid is the best choice economically, because it attracts the least cost but the problem is that, the grid is not reliable and not efficient within the nation. From an environmental perspective there were significant benefits in using Hybrid Solar-Grid power. It was observed that the diesel generator is out of place looking at the huge amount involved. From the results, Datacenter could save (9,731kg; 8,536kg) of CO2 emissions annually in Abuja (FCT) and Nkanu-West (Enugu State), respectively by removing backup Diesel Generators and by using Solar-Grid as a power source .
Keywords: Mathematical Model, Energy Optimization, Environmental Cost, Datacenter, Grid, Diesel Generator, Renewable Energy, Simulation, Nigeria
Cite this paper: Vincent Anayochukwu Ani, Anthony Ndubueze Nzeako, Jonathan Chigbo Obianuko, Energy Optimization at Datacenters in Two Different Locations of Nigeria, International Journal of Energy Engineering, Vol. 2 No. 4, 2012, pp. 151-164. doi: 10.5923/j.ijee.20120204.07.
Article Outline
1. Introduction
- A datacenter contains primarily electronic equipment used for data processing (servers, switches, routers, data storage devices and related equipment used to operate the digital economy, data storage (storage equipment), and communications (network equipment)[1]. Collectively, this equipment processes, stores, and transmits digital information which is known as “information technology” (IT) equipment. Data centers also specialized power conversion and backup equipment (as to maintain reliable, high-quality power) as well as environmental control equipment which (maintain the proper temperature and humidity for the IT equipment). Datacenters are found in nearly every sector of the economy: financial services, media, high-tech, universities, government institutions, and many others use and operate datacenters to aid business processes, information management, and communications functions[2].Datacenters house the computers, servers and within the datacenter are racks of electronic equipment wired together and connected to fibre-optic cable networks. For the operation of these equipments, the centers require electric power. Obtaining reliable and cost effective power solutions for the operation and expansion of Datacenters to the rural andremote areas presents challenging problems in developing economy like ours. It is either that the grids are not available or their extensions can be extremely costly in remote areas. However, reliable and economical power is prerequisite for such centres to be installed. It should be noted that the growing cost of sustenance is also a challenge to cope with, as over seventy percent (70%) of running cost is expended on power alone[3]. From the aforementioned, it can be seen that energy is a prerequisite in running the centres and therefore key to the success of the service.Nigeria is characterized by severe energy deficit. Electricity in Nigeria, both in urban and rural areas is epileptic[4]. Lack of power infrastructure (no or unreliable power supplies) in urban and rural areas has created a challenge on the running of datacenters. The nation’s electricity grid, where it exists, is always the energy solution of choice for powering datacenters. Energy supplies to power Datacenters are erratic and have become a major hurdle to the expanding of this sector. Thus most of the installed Datacenters in the country are being powered by grid and backup by generators, using prohibitively costly diesel fuel.Unfortunately, the grid is not always reliable and as a result of these drawbacks diesel generators are readily used as power backup or as the primary source of power. In the datacenters this always escalates the energy expenditure in a number of ways and also affects the environment negatively.Sustainable alternative to power Datacenters is to use renewable energy sources. Renewable energy sources have shown that the development of renewable energy source as an excellent potential and a form of contribution to conventional power generation systems[4]. In order to meet sustained load demands of Datacenters during varying natural conditions, different energy sources and converters need to be integrated with each other for extended usage of alternative energy for remote location, which is one of the most alternative solutions of renewable energy sources for Datacenter[27]. There is great promise for alternative renewable energy for the datacenters in Nigeria, if the operators of the datacenters will explore and exploit these available resources.
1.1. Datacenter Equipment / Energy Requirement
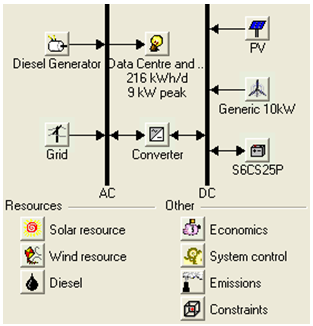
- Datacenter rooms are filled with rows of IT equipment racks that contain servers, storage devices, and network equipment. Datacenters include power delivery systems that provide backup power, regulate voltage, and make necessary alternating current/direct current (AC/DC) conversions as shown in figure 1. Data centers use significant amount of energy to supply three key components: IT equipment, cooling, and power delivery[2]. Figure 1 shows the block diagram of a typical datacenter.
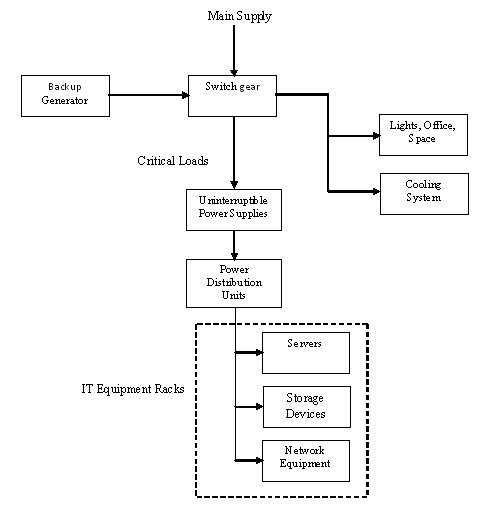 | Figure 1. Typical Electrical Components in a Datacenter Source: derived from[7],[6] |
1.2. Climate Equipment
- Datacenters use a lot of cooling capacity because all the electricity used to power the electronic and other equipment is converted to heat and need to be removed[8]. The datacenter air conditioners run all year, day and night. The air conditioning systems are typically air-cooled, distributed throughout the datacenter to ventilate and cool the servers and other equipment. The cooling capacity of an air-conditioning unit is the ability to remove heat from a room and is usually measured in Watt. The higher the Wattage rating, the more heat will be removed [9].
1.3. Calculating the Size of Air Conditioner Btu Capacity for Datacenters
- The cooling architecture is designed to address heat generation from the servers and other heat equipment.List of air-conditioner converted Wattage rating:2,637 Watts3,516 Watts4,375 Watts5,274 Watts6,153 Watts7,032 WattsAnd so on… (Btu Definition & Calculate Btu).From table 1. Ideal power rating on datacenter equipment load requirement is 5,478W/h.Consumption for 24hrs=5,478x24 =131,472W/dCooling requirement for the datacenter equipment as shown in table 1. is 5,478W/hCooling requirement for 24hrs=5,478x24=131,472W/dFrom the list of air-conditioner BTU rating stated above, we choose 3,567 WattsThe air conditioning system size required to serve these purpose is calculated as
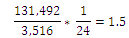 Unit air conditioner required.
1.4. Energy Required To Remove Heat From The Datacenter.
- Cooling takes bulk of the energy generated. The air condition required for the project is DC 12.The consumption of DC 12 in Wattage= 3,576W/hConsumption for 24hrs in Wattage=3,516x24=84,384W/dThe electric power needed for the datacenter equipment in and the energy required to remove heat from the datacenter are stated below. Datacenter Equipment power requirement =5 ,478W/hClimate Equipment power requirement = 3,516W/hTherefore, the Total power requirement for Datacenter = 8.994W/h (to be modeled)Total power consumption for 24hrs=8,994x24= 215,856W/d= 216kW/d
1.5. Energy Optimization
- Energy Optimization is a major issue in today’s Data communication provisioning. Energy Optimization at Datacenters can be describe as the alternative options of power that are readily available to produce the optimum or desired result while minimizing the over dependence on generators and grid at the Datacenter. It is the provision of data communication services using a Datacenter energy solution which, against other solutions, allows the least financial expenditure on energy and has the least impact on man and his environment. Energy Optimization models are employed as a supporting tool to develop energy strategies, outlining the likely future structure of the system under particular conditions and, thus, providing insights into the technological paths, structural evolution and policies that should be followed[10].Generally the main objectives of the optimization design are power reliability and cost. The goal of energy optimization is choosing the right energy solution for a Datacenter. In order to keep as low as possible both the expenditure on energy and the effect of energy generation on the environment renewable energy solutions such as solar energy, wind energy, Pico hydro energy, fuel cells, and bio diesel are being researched and developed around the globe. All the factors being proposed for evaluating the suitability of energy solution for any Datacenter and location is presented here as model in the figure below.
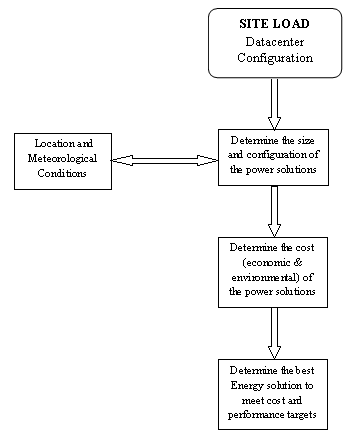 | Figure 2. Model for Choosing Power Solution for Datacenter[11] |
1.6. Renewable Energy Sources
- One reason for the popularity of solar energy is the perception that it is free. Perhaps a better choice of words would be to say that it is unmetered and renewable. The development of high efficiency and affordable solar power has progressed to the point that domestic solutions are feasible in areas of high sunlight. New solar cell technologies are moving the price point steadily down at a time when fossil fuels are increasing in cost. There are, as with any energy source, costs involved in the equipment (Photovoltaic) used to collect the energy. The amount of solar energy available varies according to the time of day, the time of the year, the whims of the weather and the region of the country. Solar power is a system that makes use of the sun energy to generate electric power for home and industrial (Datacenters) use. Solar power favors no single region and is a clean source of energy, and we are convinced that solar power would soon become a vital worldwide source of energy. Solar energy is not only pollution free it is of viable economic importance, has a long life span and low or no maintenance cost. The solar cell (solar energy converter) needs energy from the sun to function and the lowest temperature is not 0℃ but -273.16℃ hence all higher temperatures can be traced to solar energy[11].
1.7. Wind Power
- Wind is a natural phenomenon that is related to the movement of air masses caused primarily by the differential solar heating of the earth's surface. Seasonal and locational variations in the energy received from the sun affect the strength and direction of the wind. Power from the wind depends upon the swept area of the turbine blades and the cube of the wind speed. Wind energy has been considered as promising toward meeting the continually increasing demand for energy. The wind sources of energy are inexhaustible, the conversion processes are pollution-free, and it is freely available.For isolated systems such as Datacenters in remote areas, the wind energy has been considered as attractive and preferred alternative sources. Wind and solar power are inextricably linked, as somewhere between 1 and 3 percent of the sun’s energy striking the Earth is converted to wind through a global convection system. The wind turbine and its conversion equipment are a complex product but are adaptable to mass production, leading to improvements in quality, reliability and cost-effectiveness. Wind power is known as ‘Green Power’, because of its technical and commercial viability and its environment-friendly nature. The special features of wind energy that makes it attractive are zero cost fuels, low gestation period, quicker benefits and usefulness for sustainable economic development[12]. Wind has strong potential as a fuel-free renewable source of energy, which can contribute to the deployment of off shore datacenters power needs.
1.8. Environmental Benefits
- Environmental pollution and the emission of CO2 (carbon dioxide) from the use of fossil fuels constitute a threat to health, the environment and sustainable economic growth. Other major pollutants from conventional electricity, which are avoided through wind power may include SOx, NOx and PM10. Wind turbines cause virtually no emissions during their operation and very little during their manufacture, installation, maintenance and removal. Because the fuel is free, wind generated kilowatts should be used as often as possible in the electricity system to replace intermediate power loads, from coal and gas.
1.9. Hybridization and Energy Source
- Stand-alone hybrid power system is used primarily in remote areas where utility lines are uneconomical to install due to the terrains right-of-way difficulties, or environmental concerns. Building new transmission lines is expensive even without these constraints. A 230-kV line costs more than $1 million per mile[13]. A stand-alone system would be more economical for remote villages that are farther than a couple of miles from the nearest transmission line. The use of the stand-alone solar-wind with diesel backup system for the power supply of remote areas may give an economically attractive alternative[14] for Datacenter over the use of conventional diesel generators in near future. Solar and wind power outputs can fluctuate on an hourly or daily basis. The standalone system, therefore, must have some means of storing excess energy on a sunny day or a windy day for use on a rainy day or without wind. Alternatively, wind turbines and PV modules can be used in a hybrid configuration with a fuel cell in urban and remote areas.
1.9.1. Hybrid Energy System
- Naturally it is hard to design an energy system where wind power is the only energy source, primarily because of the fluctuations of the wind speed and the fluctuations of the solar radiation. A single source renewable usually tends to bring the problem of “intermittence”. A combination of one or more renewable energy resource such as solar, wind, hydropower and biomass with other technologies such as batteries and generator (defined as hybrid renewable) is a better option[15]. Hybrid system can complement each other and component. Therefore a combination of wind and solar energy will serve as the source of electric energy for powering Datacenters. This will improve the load factors and help to reduce maintenance and replacement costs as each renewables will complement each other[16],[13].A hybrid system has the advantage of balance and stability. A balanced system provides stable outputs from sources such as these and minimises the dependence of the output upon seasonal changes; furthermore, it optimises utilisation of the different renewable sources of energy available.
1.10. Cost Reduction
- Despite advances by hybrid power systems in improving reliability and reducing the overall size of the power system, initial costs remain relatively high. It heaves the potential user to reduce demand as much as possible to keep costs down. Advances in energy efficiency permits users to meet their energy needs from smaller, less expensive power systems than once was possible. The development of compact fluorescent lights and energy efficient appliances now makes this possible with little sacrifice in lifestyle[17].[18] were of the view that the combination of wind and PV power generation and an energy storage system may be an interesting solution for the more rural and remote applications – particularly those where an electrical supply is not available or practical.Based on the energy consumption of Datacenter and the availability of renewable energy sources, we decided to implement and optimize an innovative Hybrid Energy System combining wind turbine-generator, solar photo-voltaic panels, battery storage, advance power electronic equipment and existing grid with diesel generators as backup.
1.11. Economic and Environmental Cost Model
- As datacenter operators look forward to a cost effective and environmental friendly way of running the centre the application of renewable energy systems in Datacenters has become an important alternative. However, the evaluation of the correct type of renewable energy system needs to be done so that the system can be optimized. Studies have been carried out to demonstrate the ability of some configurations of renewable energy systems to maximize performance while minimizing costs. The optimization of energy systems in the context of minimizing excess energy and cost of energy has been addressed by[19]. Also[23],[22] used the annualized cost of a component to derive the calculation of the total Net Present Cost (NPC) of energy systems.[21],[14] used the Hybrid Optimization Model for Electric Renewables (HOMER) software[23] to find optimum sizing and minimizing cost for hybrid power system with specific load demand in stand-alone applications.[4] developed a reliable system operation model based on Hybrid Optimization Model for Electric Renewable (HOMER) to find an optimal hybrid system among different renewable energy combinations while minimizing the total life cycle cost.According to[22], the annualized total cost of a component is calculated thus:
 | (1) |
 = Annualized capital cost of a component
 = Annualized replacement cost of a component
 = Annualized operating cost of a componentFrom equation (1), we derived the Economic and Environmental cost model through Annualized Total Cost of the Configurations of Power System as follows:Annualized Total Cost of running Grid + Hybrid (Wind & Solar) + Diesel Generator + Batteries is calculated as[11].
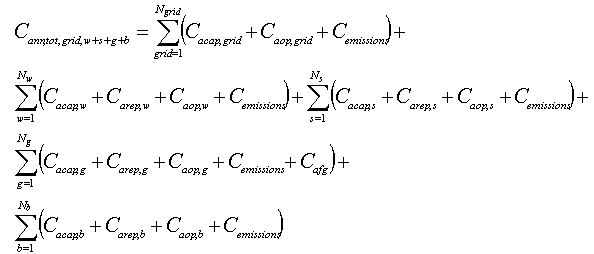 | (2) |
 = Annualized Capital Cost of Grid Power
 = Annualized Operating Cost of Grid Power
 = Cost of Emissions
 = Annualized Capital Cost of Wind Power
 = Annualized Replacement Cost of Wind Power
 = Annualized Operating Cost of Wind Power
 = Annualized Capital Cost of Solar Power
 = Annualized Replacement Cost of Solar Power
 = Annualized Operating Cost of Solar Power
 = Annualized Capital Cost of Diesel Generator
 = Annualized Replacement Cost of Diesel Generator
 = Annualized Operating Cost of Diesel Generator
 = Annualized Fuel Cost for Diesel Generator
 = Annualized Capital Cost of Batteries Power
 = Annualized Replacement Cost of Batteries Power
 = Annualized Operating Cost of Batteries PowerThe output of the above derived mathematical models is the optimal configuration of a hybrid energy system that takes into account technical and economic performance of supply options (rated power characteristics for solar Photovoltaic (PV), power curve characteristics for wind turbine (WT), fuel consumption characteristics for diesel generators (DG), and minimum and maximum state of charge (SOC) of a battery bank, the 20-year life cycle cost (LCC) of equipment, locally available energy resources (hourly solar insolation data (W/m2), hourly wind speed (m/s), as well as cost of fossil fuels), demand characteristics (can be given either for each day, from Monday to Sunday, or for weekdays and weekends), environmental costs, and system reliability.
1.12. Research Area Climate
- The climatic condition in a given geographical region has a major role to play in the type of renewable energy to be deployed at that location. Although Nigeria lies wholly within the tropical zone, there are wide climatic variations in different areas of the country. The seasonal pattern of climatic conditions over Nigeria gives rise to four seasons in the south and two in the north. This is the result of annual total rainfall occurrence and distribution, which is more predominant in the south than in the north. The mean annual rainfall along the coast in the south- east is 4000mm while it is only 500mm in the north- east.Nigeria’s climate varies by region; from arid in the north, to tropical in the centre and equatorial in the south. The climate is largely controlled by prevailing winds and nearness to the Atlantic Ocean. The two dominant air masses are the dry wind from the Sahara and the wet wind from the Atlantic Ocean.
1.12.1. Southern Nigeria: The four observed seasons are:
- ● The Long Rainy Season: This starts in March and lasts to the end of July, with a peak period in June over most parts of southern Nigeria. It is a period of thick clouds and is excessively wet particularly in the Niger Delta and the coastal lowlands. It is marked by humidity with values hardly below 85 per cent in most parts of the forested south.● The Short Dry Season: This is experienced in August for 3-4 weeks. However, the real dry period known as the "August break" is generally observed in the last two weeks of August in most parts of southern “Nigeria".● The Short Rainy Season: This brief wet period follows the "August break" from early September to mid-October, with a peak period at the end of September. The rains are not usually as heavy as those in the long rainy season, although the spatial coverage over southern Nigeria is similar. The two periods of rainfall intensity give the double maxima phenomenon of the rainy season characteristic of southern Nigeria. The short dry season in August between these two rainy periods allows for harvesting and planting of fast-growing varieties of grains, such as maize.● The Long Dry Season: This period starts from late October and lasts to early March with peak dry conditions between early December and late February. The period witnesses the prevailing influences of the dry and dusty north-east winds, as well as the 'harmattan' conditions. Vegetation growth is generally hampered, grasses dry and leaves fall from deciduous trees due to reduced moisture.
1.12.2. Northern Nigeria
- The climatic conditions in the northern part of Nigeria exhibit only two different seasons, namely, a short wet season and a prolonged dry season. Temperatures during the day remain constantly high while humidity is relatively low throughout the year, with little or no cloud cover. There are, however, wide diurnal ranges in temperature (between nights and days) particularly in the very hot months. The mean monthly temperatures during the day exceed 36℃ while the mean monthly temperatures at night fall, at most times, to below 22℃.
1.13. The Long Dry Season
- This period extends from October to mid-May. With the Inter-Tropical Convergence Zone (ITCZ) in the Southern Hemisphere, the north-east winds and their associated easterlies over the Sahara prevail over the country, bringing dry conditions. The harmattan period during December- January is more intense and longer in the north than in the south. This is the period of little or no cloud cover, resulting in wide diurnal ranges of temperature.
1.14. The Wet Season
- The wet season covers a relatively short period, from June to September. Both the number of rain days and total annual rainfall decrease progressively from the south to the north. The rains are generally convectional, heavy and short in duration, often characterized by frequent storms. This results in flash floods and in some places also in sheet or gully erosion.The few high plateaus of Jos and Biu, and the Adamawa highlands, experience climatic conditions which are markedly different from the generalised dry and wet period in northern Nigeria. Temperatures are 5 - 10℃ lower due to high altitude than in the surrounding areas. Similarly, the annual rainfall figures are higher than in areas around them, particularly on the windward side.
1.14.1. Temperature
- Nigeria’s climate is characterized by relatively high temperatures throughout the year. The average annual maximum varies from 35℃ in the north to 31℃ in the south; the average annual minimum from 23℃ in the south to 18℃ in the north. On the Jos plateau and the eastern highlands altitude makes for relatively lower temperatures, with the maximum temperature of not more than 28℃ and the minimum sometimes as low as 4℃.
1.14.2. Rainfall
- The country experiences consistently high temperatures all year round. Since temperature varies only slightly, rainfall distribution, over space and time, becomes the single most important factor in differentiating the seasons and climatic regions. Rainfall occurrence and distribution are however dependent on the two air masses that prevail over the country. There is a prolonged rainy season in the far south, while the far north undergoes long dry periods annually. Nigeria, therefore, has two major seasons, the dry season and the wet season, the lengths of which vary from north to south.
1.14.3. Wind
- Two principal wind currents affect Nigeria. The south-western winds dominate the rainy season of the year while north-eastern winds dominate the dry season. Depending on the shifts in the pressure belts in the Gulf of Guinea, these winds are interspersed respectively by the south-eastern and north-western winds in different parts of the year. The wetter winds prevail for more than 70% due to the strong influence of the breeze from the Atlantic Ocean Mean annual wind speed varies between 2 to 6 m/s. Speeds in dry season (November - March) are lower. In the wet season (April–October), daily average speed could rise to 15 m/s. Values of up to 25 m/s are sometimes experienced due to inducement by convective rainfall activities and relative diffusion.
1.15. Background of the Study
- This study major goal is to explore the best alternative renewable energy solutions to progressively increase the generation of renewable and clean energy so as to migrate datacenters away from a dependence on fossil fuel energy.
2. Methodology
- This research is focus on Abuja (FCT – covering the northern part of the nation) and Nkanu-West (Enugu State – which covers the southern part of the nation). This may also be applied to other regions country. Four (4) technologies were considered for this study and these are Grid Power, Solar PV, Wind turbine, and Diesel Generator. Datacenters at locations in the following geographical areas in Nigeria were studied: Abuja (FCT) and Nkanu-West (Enugu State). Since weather data are important factor for pre- feasibility study[25] of renewable hybrid energy system for any particular site, the data for solar and wind resources were obtained from the NASA Surface Meteorology and Solar Energy web site[24]. The specific geographical locations based on solar and wind resources are as follows:
2.1. Abuja Location
- Abuja (FCT) being at a location of 9° 00' N latitude and 7° 00' E longitude has annual average solar (clearness index and daily radiation) of 5.45 kWh/m²/d and its annual average wind is 2.4m/s. Figures 3a and 3b show the solar and wind resource profile of Abuja (FCT) location tabulated in Table 3.
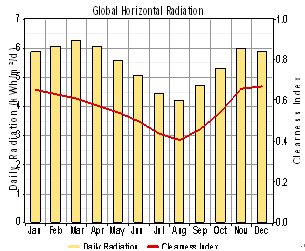 | Figure 3. HOMER output graphic for Solar (Clearness Index and Daily Radiation) Profile for Abuja |
2.2. Nkanu West Location
- Nkanu-West (Enugu State) at a location of 6° 00' N latitude and 7° 00' E longitude with annual average solar (clearness index and daily radiation) of 4.92kWh/m²/d and its annual average wind is 2.1m/s. See figure 4a and 4b for the solar resource profile; and wind the resource profile in Nkanu-West as tabulated in Table 4.
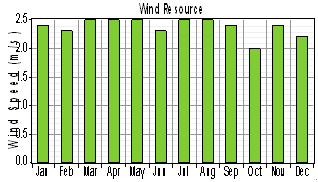 | Figure 4. HOMER Output Graphic for Wind Speed Profile for Abuja |
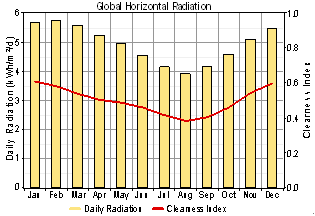 | Figure 5. HOMER output graphic for Solar (Clearness Index and Daily Radiation) Profile for Nkanu-West |
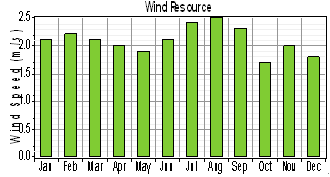 | Figure 6. HOMER output graphic for Wind Speed profile for Nkanu-West |
| ||||||||||||||||||||||||||||||||||||||||||||||||||||||||||||||
| ||||||||||||||||||||||||||||||||||||||||||||||||||||||||||||||
2.3. Simulating Datacenter Energy Design Using HOMER
- The simulation runs in this paper are based on the HOMER implementation. HOMER allows for more flexibility of research purposes in Energy. HOMER program simplifies the task of evaluating design of Energy system using optimization algorithms. In this paper the system sizing[29],[26] is carried out using HOMER-optimization and simulation software tool for parts of the mathematical modeling is driven by HOMER. The results from the optimization by the software were used as point of reference (analysis). Homer’s optimization algorithm calculates how many and what size of each components to be used for the hybrid system at the lowest cost possible. The selected data were used to derive the optimization. The life cycle costs and estimated energy supply were calculated for nearly hundred different hybrid system component combinations based on differently sized PV arrays, sized wind turbines, hydro turbines and diesel generator.
3. Optimization Result
- Applying the optimization Model equation derived, the best energy solution is determined for any given Datacenter and location. Different types of possible single-source systems and hybrid system combinations were simulated with their costing and sizing compared with a PV/wind/grid/ diesel/battery system. Some centres will be best served by mains power and others by combinations of the renewable energy solutions. The total Net Present Cost (NPC) for economic and environmental evaluation of the Hybrid (Solar & Wind) + Grid + DG, Hybrid (Solar & Wind) + Grid, Solar + Grid + DG, Wind + Grid + DG, Solar + Grid, Wind + Grid, Grid + DG, Grid system have been developed and simulated using the model which results in eight different topologies, ordered by the most effective NPC as follows: 1. Grid + Batteries + Rectifier 2. Grid + Wind only + Batteries + Rectifier3. Grid + Solar only + Batteries + Rectifier 4. Grid + Hybrid (Solar & Wind) + Batteries + Rectifier5. Grid + DG + Batteries + Rectifier6. Grid + Wind + DG + Batteries + Rectifier 7. Grid + Solar + DG + Batteries + Rectifier 8. Grid + Hybrid (Solar & Wind) + DG + Batteries + Rectifier
 | Figure 7. The Proposed Energy system for Datacenter |
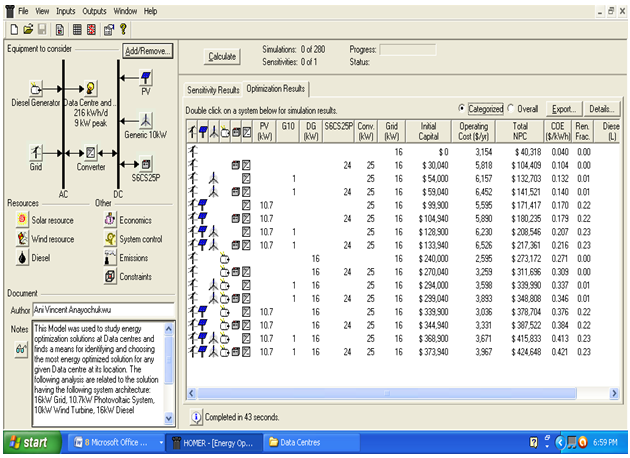 | Figure 8. Optimization Results of Energy System for Datacenter Located in Abuja, FCT |
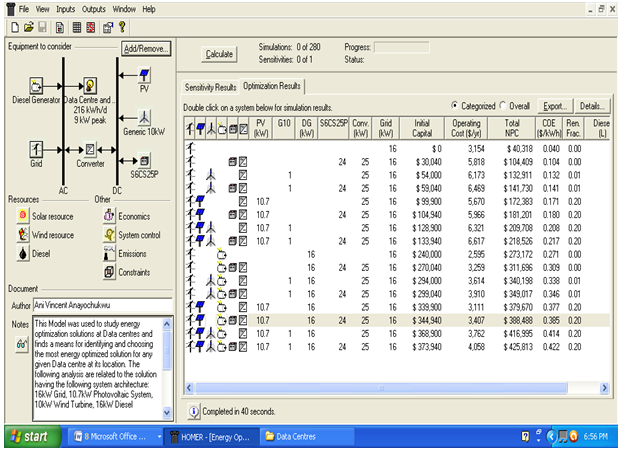 | Figure 9. Optimization results of energy system for Datacenter located in Nkanu-West, Enugu |
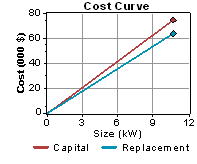
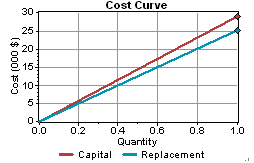 | Figure 10. A Generic 10kW cost curve |
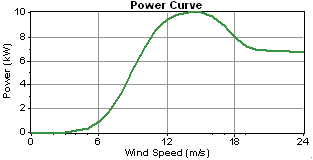 | Figure 11. A Generic 10kW power curve |
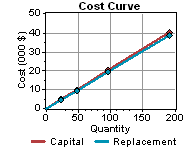
 | Figure 12. Cost curve of PV |
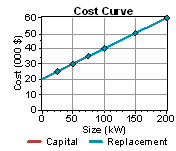
 | Figure 13. Cost curve of battery |
 | Figure 14. Cost curve of converter |
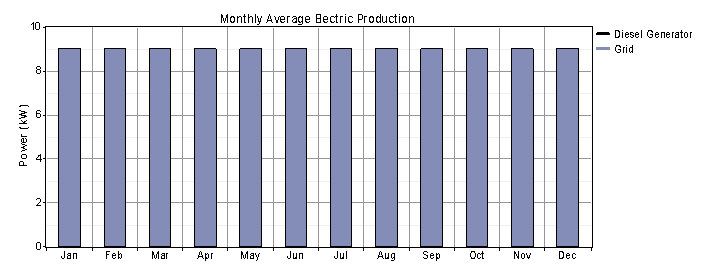
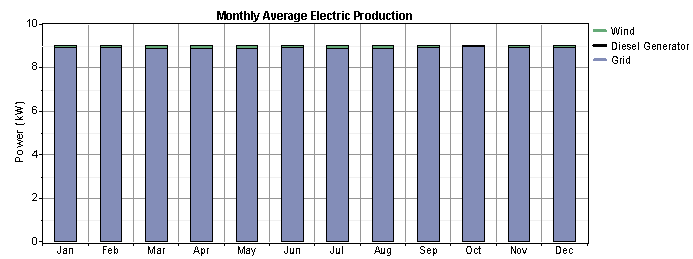
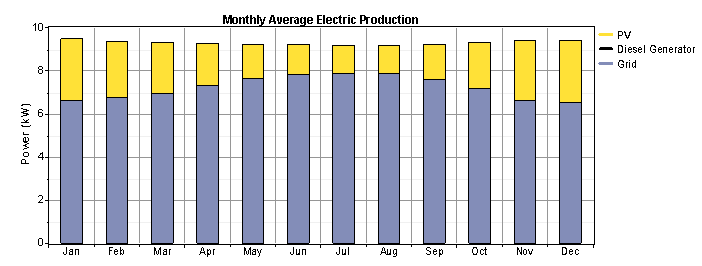
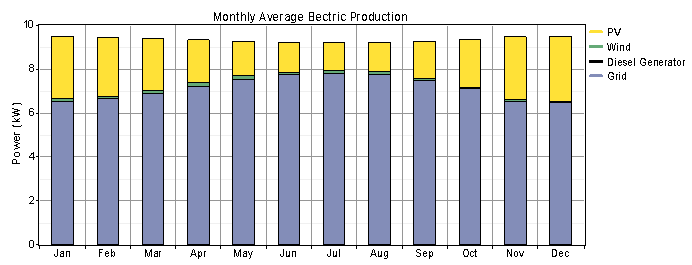
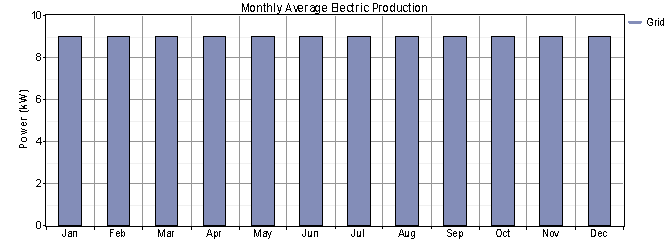
3.1. Simulation Results of Different Generator for Monthly Average Electric Production
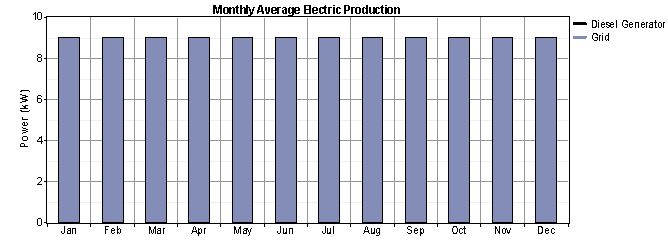
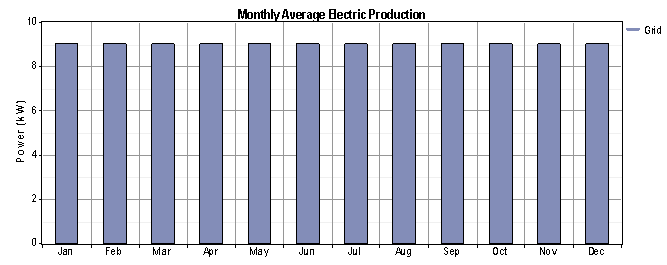 | Figure. 15. Grid Monthly Average Electric Production for Abuja Datacenter |
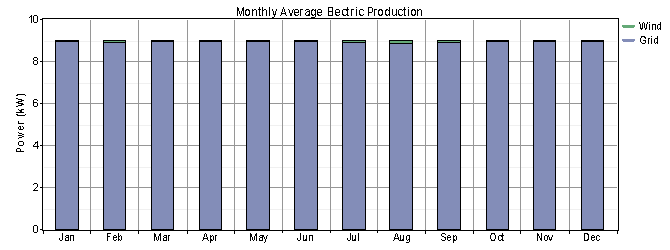
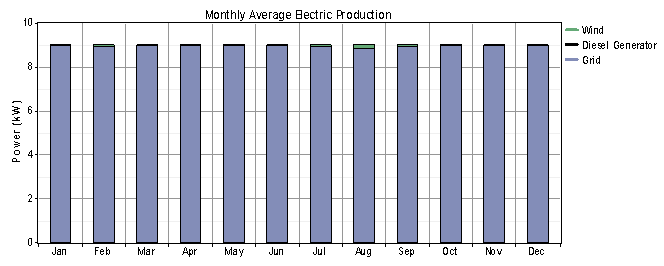
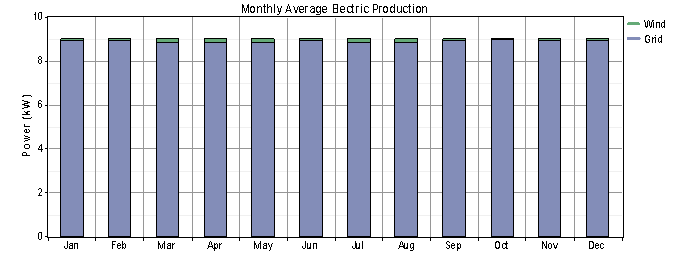 | Figure 16. Grid and wind Monthly Average Electric Production for Abuja Datacenter |
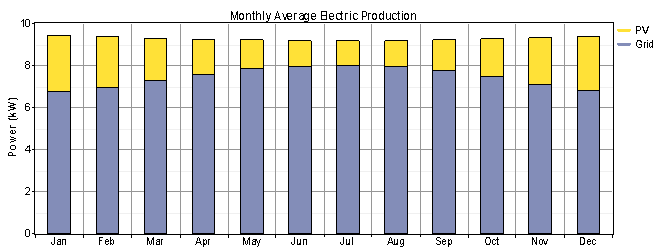
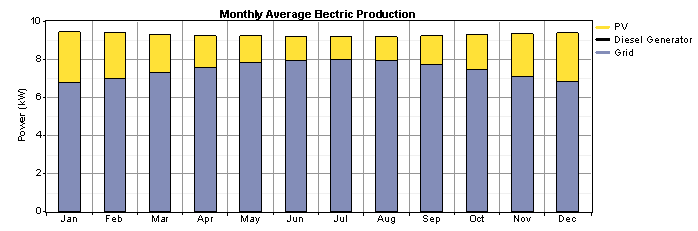
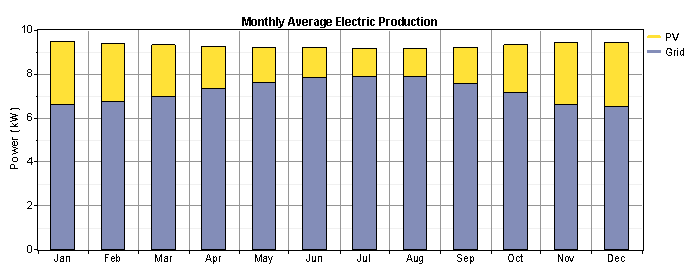 | Figure 17. Grid and PV Monthly Average Electric Production for Abuja Datacenter |
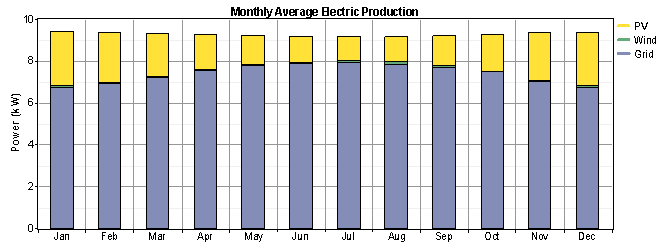
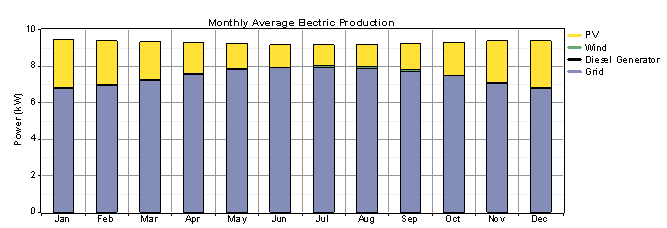
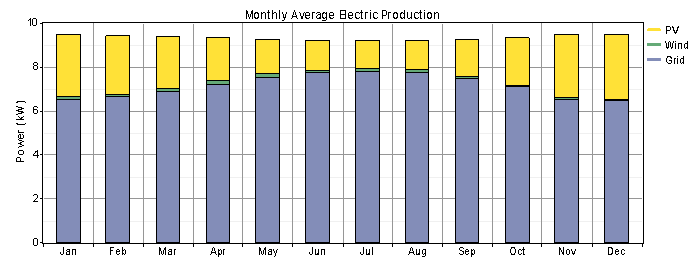 | Figure 18. Grid, PV and Wind Monthly Average Electric Production for Abuja Datacenter |
 | Figure 19. Grid and Diesel Monthly Average Electric Production for Abuja Datacenter |
 | Figure. 20. Grid, wind and Diesel Monthly Average Electric Production for Abuja Datacenter |
 | Figure 21. Grid, PV, and Diesel Monthly Average Electric Production for Abuja Datacenter |
 | Figure 22. Grid, PV, Wind and Diesel Monthly Average Electric Production for Abuja Datacenter |
 | Figure 23. Grid Monthly Average Electric Production for Nkanu-West Datacenter |
 | Figure 24. Grid and wind Monthly Average Electric Production for Nkanu-West Datacenter |
 | Figure 25. Grid and PV Monthly Average Electric Production for Nkanu-West Datacenter |
 | Figure 26. Grid, PV and Wind Monthly Average Electric Production for Nkanu-West Datacenter |
 | Figure 27. Grid and Diesel Monthly Average Electric Production for Nkanu-West Datacenter |
 | Figure 28. Grid, Wind and Diesel Monthly Average Electric Production for Nkanu-West Datacenter |
 | Figure 29. Grid, PV and Diesel Monthly Average Electric Production for Nkanu-West Datacenter |
 | Figure 30. Grid, PV, Wind and Diesel Monthly Average Electric Production for Nkanu-West Datacenter |
|
|
|
|
|
|
3.2. Simulation Results
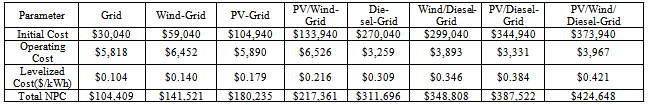
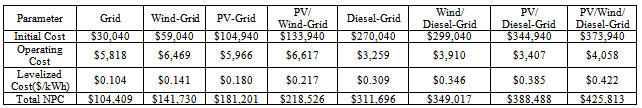
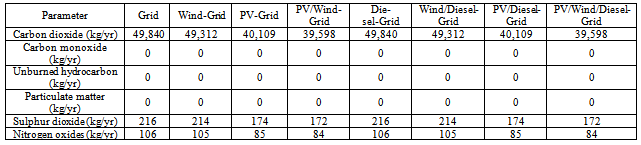
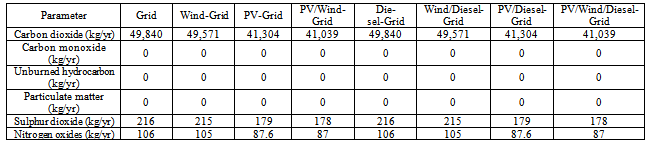
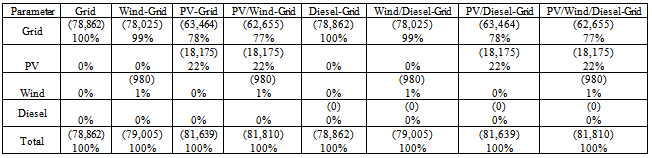
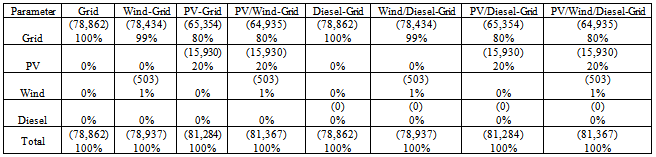
- Systems located in Abuja (FCT) and Nkanu-West (Enugu) were optimized. The Simulations provide information concerning the electricity production, economic costs and environmental characteristics of each system, such as the CO2 emissions. The obtained results are presented in tables 5.1-5.2; 6.1-6.2; and 7.1-7.2. The detailed analyses obtained at the end of the simulations are described below:
3.3 Grid Only
- Grid only system has the least initial capital cost and lowest total net present cost for the whole project as shown in tables 5.1-5.2. Furthermore, this system emits more CO2 (49,840kg; 49,840kg), Sulphur dioxide(216kg; 216kg) and NOx (106kg; 106kg) for Abuja and Nkanu-west as shown in tables 6.1-6.2, respectively.
3.4. For One Renewable-Grid Hybrid
- Wind-Grid system and Solar-Grid system give an opportunity for renewable energy to supply 1% and 22%, respectively, of the energy demand in Abuja (FCT); 1%, and 20% respectively, for Nkanu-West (Enugu State); as shown in tables 7.1-7.2, respectively. Furthermore, Wind-Grid system and Solar-Grid system reduces CO2 by[(528kg; 269kg), (9,731kg; 8,536kg)], Sulphur dioxide by[(2kg; 1kg), (42kg; 37kg)] and NOx by[(1kg; 1kg), (21kg; 18.4kg)] for Abuja (FCT) and Nkanu-west (Enugu State) as deducted from tables 6.1-6.2, respectively.
3.5. For Two Renewables-Grid Hybrid
- PV/Wind-Grid system has the ability for reducing the proportion of energy supplied by Grid to 77%, in Abuja (FCT); 80%, in Nkanu-West (Enugu State); as shown in tables 7.1-7.2, respectively. And finally, PV/wind-Grid system could save (528kg; 269kg) of CO2, (2kg; 1kg) of Sulphur dioxide and (1kg; 1kg) of NOx of emission in Abuja (FCT) and Nkanu-west (Enugu State) as deducted from Tables 6.1-6.2, respectively. These differences are due to energy resources and its geographical locations.
4. Conclusions
- The results show that, grid is the best choice economically, because it attracts the least cost but the problem is that, the grid is not reliable and not efficient within the nation. From an environmental perspective there were significant benefits in using Hybrid Solar-Grid power. It is observed that the diesel generator is out of place looking at the huge amount involved. From the results, Datacenter could save (9,731kg; 8,536kg) of CO2 emissions annually in Abuja (FCT) and Nkanu-west (Enugu State), respectively by removing backup Diesel Generators and by using Solar-Grid as a power source. In general, the hybrid Solar-Grid power system offered a better performance to provide power supply than the grid only system. The simulation results demonstrate that utilizing renewable generators such as a hybrid (PV/wind) generator reduces the greenhouse gases (CO2 and NOx) emitted to the environment. The results also demonstrate that renewable energy technologies, including solar PV and wind systems, have the potential of supplying electricity to Datacenters in a cost effective manner. Grid would have been the best option but due to its unreliability in Nigeria, coupled with its high Environmental impact, PV-Grid system is likely to be the best option which is reliable and has the least Environmental cost for the project. However, it is important to note that there is no general least-cost option for powering Datacenters at different locations. It all depends on climatic conditions and available renewable energy resources.
References
| [1] | M. Bailey, M. Eastwood, T Grieser, L. Borovick, V. Turner, and R.C. Gray, “Special Study: Data Center of the Future”, New York, NY: IDC. IDC #06C4799, April 2007. |
| [2] | Report to Congress on Server and Data Center Energy Effi-ciency Public Law 109-431. U.S. Environmental Protection Agency ENERGY STAR Program August 2, 2007 |
| [3] | Schneider Electric, “Data Centre Management Journal” An Energy Solution Technical Journal Report. www.schneider- electric.com. (2009). |
| [4] | Bioenergy Pact “Nigeria to power telecom base stations with Biofuels”, 2007 |
| [5] | S. Ashok “Optimized Model for Community Based –Hybrid Energy Systems”, Renewable Energy, 32(7), 1155-1164, 2007. |
| [6] | Fan Xiaobo, Wolf-Dietrich Weber, and Luiz André Barroso, “Power Provisioning for a Warehouse-sized Computer” in Proceedings of the 34th International Symposium on Computer Architecture in San Diego, CA. Association for Computing Machinery, ISCA, 2007, http://labs.google.com/ papers/power_provisioning. pdf |
| [7] | Turner, W. Pitt, John H. Seader, and Kenneth G. Brill. (2005). Industry Standard Tier Classifications Define Site Infra-structure Performance. Santa Fe, NM: Uptime Institute. |
| [8] | Chris Robertson & Joseph Romm, “Data Centres, Power, and Pollution Prevention: Design for Business and Environmental Advantage”. The Centre for Energy and Climate Solutions, 2002. |
| [9] | Btu Definition and Calculate Btu http://www.aircontalk.com/ BtuDefinition-CalculateBtu.html. |
| [10] | N. Mattsson, C. O. Wene, "Assessing New Energy Technologies Using an Energy System Model with Endoge-nized Experience Curves". International Journal of Energy Research. Vol. 21, pp 385-393, 1997. |
| [11] | V. A. Ani, “Energy Optimization at Telecommunication Base Station Sites”. Unpublished doctoral Dissertation, University of Nigeria, Nsukka. Nigeria, 2011. |
| [12] | Natarajan. Radha, “Alternative Energy sources: Wind Energy and Solar Energy as Alternate Energy Sources with Particular Reference to India”, VPM's, Polytechnic Thane, India Page 57. 2005. |
| [13] | M. Patel, “Wind and Solar Power Systems”, Second Edition, Taylor & Francis Group, 2006. |
| [14] | M. J. Khan, M. T. Iqbal, “Pre-feasibility Study of Stand-alone Hybrid Energy Systems for Applications in New-foundland”, Renewable Energy, 30, 835-854, 2004. |
| [15] | G. A. Adebiyi, E.C. Nsofor, W. G. Steele, and A. A Jalalzadeh- Azar,.”Optimisation of a Class of Latent Thermal Energy Storage Systems with Multiple Phase-Change Material”, ASME Journal of Solar Energy Engineering, 120(1): 14–19, 1997. |
| [16] | J. K. Kaldellis, E. Kondilin and A. Filios, “Sizing a Hybrid Wind-Diesel Stand-Alone System on the Basis of Minimum Long-Term Electricity Production Cost”, Applied Energy, Vol.83, pp. 1384-1403, 2006. |
| [17] | Gipe Paul, “Wind Power: Renewable Energy for Home, Farm, and Business”, Chelsea Green Publishing Company (2004). |
| [18] | A. N. Celik, “The System Performance of Autonomous Photovoltaic–Wind Hybrid Energy Systems Using Synthetically Generated Weather Data”. Renewable Energy 2002, 27, 107–121, 2002. |
| [19] | Juhari Ab. Razak, Kamaruzzaman Sopian and Yusoff Ali, “Optimization of Renewable Energy Hybrid System by Minimizing Excess Capacity”, International Journal of Energy, Issue 3, Vol. 1, 2007, pp. 77 – 81, 2007. |
| [20] | Kamaruzzaman Sopian, Azami Zaharim, Yusoff Ali, Zulkifli Mohd Nopiah, Juhari Ab. Razak and Nor Salim Muhammad, “Optimal Operational Strategy for Hybrid Renewable Energy System Using Genetic Algorithms”, WSEAS TRANSACTIONS on MATHEMATICS Issue 4, Volume 7, , pp130-140, April 2008. |
| [21] | S. Kamel, C. Dahl, “The Economics of Hybrid Power Systems for Sustainable Desert Agriculture in Egypt”, Energy, Vol. 30, pp 1271‐1281, 2005. |
| [22] | T. Lambert, HOMER: The Hybrid Optimization Model for Electrical, Renewables (HOMER). http://www.nrel.gov/ international/tools/HOMER/homer.html 2009. |
| [23] | National Renewable Energy Laboratory, HOMER Getting Started Guide Version 2.1, NREL, 2005. |
| [24] | NASA Atmospheric Science Data Center http://eosweb. larc.nasa.gov/sse/2010, 2010. |
| [25] | V. A. Ani, A. N. Nzeako (in press), “Energy optimization at GSM Base Station Located at Rural Areas”, International Journal of Energy Optimization and Engineering. |
| [26] | Nema, P., Nema, R.K., Rangnekar, S. (2007, March). ‘Sizing and methodology of pv-solar/wind hybrid energy systems’ Paper presented at the national conference of power electronics & intelligent control held at Malaviya National Institute of technology, Jaipur (rajasthan), India. |
| [27] | K. Katti, M. K. Khedkar, “Alternative Energy Facilities Based on Site Matching and Generation Unit Sizing For Remote Area Power Supply”, Renewable Energy, 32(2), 1346–1366, 2007. |
| [28] | P. Nema, R. K. Nema and Rangnekar, S, “Integrated Design Approach for Standalone PV-Solar and Wind Hybrid Energy System: For Rural electrifications”, Paper presented at the International Conference on Advance Energy Systems (ICAER-2007), IIT Bombay, 2007. |
| [29] | M. A. Elhadidy, Shaahid S. M, “Role of hybrid (Wind + Diesel) Power Systems in Meeting Commercial Loads”, Renewable Energy, 29 (12), 109–18, 2004. |