-
Paper Information
- Next Paper
- Previous Paper
- Paper Submission
-
Journal Information
- About This Journal
- Editorial Board
- Current Issue
- Archive
- Author Guidelines
- Contact Us
International Journal of Energy Engineering
p-ISSN: 2163-1891 e-ISSN: 2163-1905
2012; 2(4): 131-137
doi: 10.5923/j.ijee.20120204.04
Modeling and Power Quality Improvement of Grid Connected Induction Generators Driven by Turbo-Expanders
 Abstract
 Reference
 Full-Text PDF
 Full-Text HTML
Mehdi Taleshian , Hasan Rastegar , Hossein Askarian Abyaneh
Electrical Engineering Department, Amirkabir University of Technology, Iran
Correspondence to: Mehdi Taleshian , Electrical Engineering Department, Amirkabir University of Technology, Iran.
| Email: |  |
Copyright © 2012 Scientific & Academic Publishing. All Rights Reserved.
Nowadays, the energy crisis has forced the need to recover the energy which is normally wasted in industrial processes. Gas pressure reducing process in city or power plant gas stations is one of these processes in which the energy is wasted. This work is done by turbo-expanders in parallel with gas regulating valves. In electrical industry, these devices drive generators to produce electrical power from the main process. In this paper a model for turbo-expander is presented. This model which utilizes an online calculation method is more efficient and simpler than the older offline model which surmounts the need for making complicated lookup tables prior to calculation. Because of instantaneous varying of domestic consumptions, environment temperature and other effective parameters, turbo-expander inlet gas pressure and mass flow-rate vary with time and consequently the extracted power has time variant specification and causes some power quality issues such as voltage flicker, voltage sag, etc. So, this system is simulated and power quality issues are investigated for a fault occurring at the point of common coupling (PCC). Then, the flicker in electrical waveforms due to change in input pressure or mass flow rate is investigated. Since the power quality problems due to disturbances are considerable, a D-STATCOM is designed and connected at PCC and it is shown that the STATCOM has improved the power quality problems of the system.
Keywords: Turbo-Expander, Power Quality, D-STATCOM
Article Outline
1. Introduction
- In natural gas industry, in order to reduce pipelines size and, then, losses, the gas is transmitted in high pressure levels. The typical pressure of gas in transmission pipelines is in the range of 200-1500 psi so for domestic or industrial consumptions such as power plants, it is necessary to reduce this pressure to the distribution levels. Usually, the pressure reduction is accomplished by mechanical valves at regulating stations where a large amount of latent energy of high pressure gas is wasted during the pressure reduction process[1]. Turbo-expanders can be installed in parallel with these regulating stations in order to recover this energy. Besides, they can reduce the gas pressure for downstream consumptions as well as old pressure regulators (mechanical valves). Moreover, the power extracted by turbo-expanders can drive electrical generators, compressors and other loads. In short, if there is a gas transmission and distribution network, it is possible to recover huge amounts of energy to produce electricity[2, 3, 4].Since the gas consumption in domestic and industrial consumers is continuously varying, turbo-expander inlet mass flow-rate varies too. Moreover, turbo-expander inlet gas pressure and mass flow-rate can be affected by environment temperature, pressure drop in transmission pipelines, and some other parameters. Consequently, the turbo-expander output power variations are transferred by coupled generators to the power distribution network and cause voltage flicker at PCC[5, 6]. As it is known, flicker can affect the normal operation of various devices, such as lamp illumination, TV representation, as well as, intensive care unit (ICU) and critical care unit (CCU) systems in hospitals; as a result, the flicker generated by the turbo- expander driven generator should be evaluated and mitigated, especially in weak power systems[7]. Moreover, it seems that a sharp drop in the inlet mass flow-rate or in the inlet pressure of turbo-expanders can cause other power quality issues. Also, we need to study the transient stability of the generator when a fault takes place in the power network. Prior to this work, there has been some investigation on turbo-expander modelling for power system studies. In[8], turbo-expander was introduced for energy recovery in electrical form and some operational topologies of turbo- expander and electrical generators were presented. The basic rule of recoverable energy and variable efficiency of turbo- expander due to changes in inlet flow rate and pressure was studied in this paper. Then in[9,10], the same model was used for turbo-expander coupled with a synchronous generator to study mechanical oscillation of shaft and power quality issues of the generated power, but didn’t provide any solution to overcome it. In these studies, for modelling the turbo-expander, it was required to form a lookup table which relates the change in passing gas enthalpy calculated from a thermodynamic software to the input pressure, output pressure and input constant temperature. This process is shortened in this paper and the temperature change of inlet gas can be easily included.On the other hand, the generators used in installed turbo-expander systems such as Neka power plant are induction type and are not considered in previous studies. In this paper induction generator and power quality improvement equipment are studied.
2. Methodology
- To study the system, first the expander turbine is modelled. Due to the effect of mass or input pressure variation on expander turbine efficiency, this efficiency variation is included in turbo-expander modelling. The old method for expander power calculation is an offline method. A newer online method is presented for power calculation and the results are compared.Afterward a flicker meter is designed in software environment for power quality studies and voltage of PCC is investigated during system mechanical or electrical disturbances. To eliminate the voltage disturbances, a D_STATCOM is connected at PCC and it is shown that voltage flicker or voltage sags are decreased.Figure 1 shows a turbo-expander installation topology in parallel with the existing gas pressure regulating station at a city gate. The pipeline leading to the expander inlet is taken from a point of downstream of the monitoring regulator and upstream of the working regulator. The monitor regulator is, therefore, still able to provide back-up pressure control at the event of a malfunction. The turbo-expander nozzle control system is capable of holding turbine downstream pressure in an approximately constant value[10].
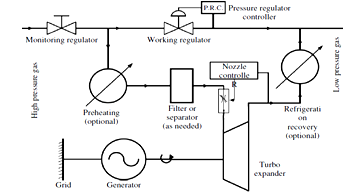 | Figure 1. Schematic representation of gas regulating station and turbo-expander installation topology[11] |
3. Modular Modelling of Turbo-Expander System
- Figure 2 shows the modular model of turbo- expander-generator system. Considering this figure, first, the extractable power of the natural gas,
 is computed, then the efficiency variation that is caused by inlet mass flow-rate and pressure deviation from their nominal values is considered and the net power delivered to the shaft,
  , is calculated. And finally,
  is the delivered torque to the generator shaft.
3.1. Fluid (Gas) Power Computation
- Turbo-expanders expand inlet compressed gas with the known pressure ratio in an isentropic process. In this type of expansion, the outlet gas temperature drops or in fact its enthalpy is reduced. With consideration of the first thermodynamic law, relation (1) gives applied power to the turbine shaft[8, 12];
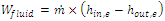 | (1) |
 is mass flow-rate in kg/s,
  and
and  are inlet and outlet specific enthalpies in kJ/kg and
  is the power of expanded fluid (gas) in kw.To calculate the enthalpies, there is a need of a thermodynamic software and then, forming some lookup tables from input pressure and temperature and enthalpies according to figure 2[9, 10, 13].
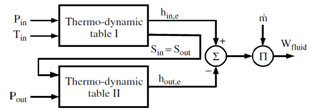 | Figure 2. Schematic diagram for enthalpies computation from inlet gas specifications |
 [2,11,14].
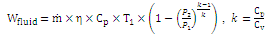 | (2) |
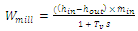
3.2. Total Efficiency Computation
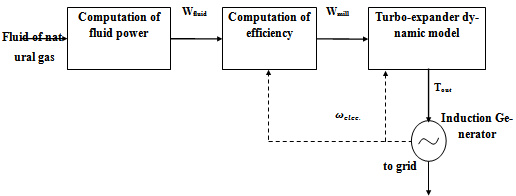 | Figure 3. The block diagram of modular model of turbo-expander-generator |
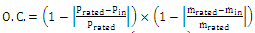 | (3) |
 | (4) |
 | (5) |
 is the nominal pressure,
  is the gas inlet pressure,
  is the turbine nominal mass flow-rate,
  is the turbine inlet mass flow-rate, and O.C. is the abbreviation of operation condition. Also,
  is the turbine lower band efficiency,
  is the turbine upper band efficiency, and finally
  is the turbine overall efficiency regarding operation condition.
  , in relation (5) is the delivered power from the turbo-expander to the turbine shaft. The block diagram of the proposed system is presented in figure 3.
3.3. Dynamic Model of Turbo-Expander
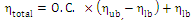
- It is necessary to consider gas interaction with vanes in the dynamic model of turbo-expander. In fact, the amount of change appearing in the output mass flow-rate should be analysed for a small change in the turbine vessel mass flow-rate.
 | Figure 4. A vessel indicated by its volume, inlet and outlet mass flow-rates |
 (m3), inlet mass flow-rate
  (kg/s) and outlet mass flow-rate
  (kg/s), it can be written [9, 10, 15]:
 | (6) |
 | (7) |
 | (8) |
3.4. Generator Model
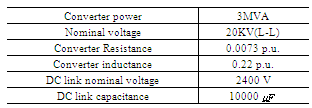
- Induction or synchronous generators are usually connected to turbo-expander systems and each one has its benefits and problems. In this study induction generator is selected to simulate turbo-expander-generator installed in Neka power plant. The induction generator is squirrel-cage machine and its electrical part is represented by a fourth-order state-space model and the mechanical part by a second-order system[16]. The electrical generator parameters are listed in table 1.
4. Power System Studies
- Figure 5 shows the study system. Specification of this system is selected according to practical data which is taken from Neka power plant. In this system, the turbo-expander reduces natural gas pressure in parallel with a mechanical valve. A unit 10KV/20KV step-up transformer connects the generator to the power distribution network.
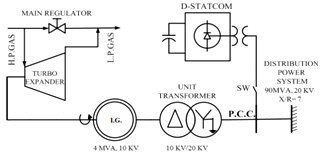 | Figure 5. Schematic representation of study system |
4.1. Turbo-Expander Power Calculation
- In this section simulation is done to compare the new method of expander power calculation from equation (2) with the old method. Results in figure 6 show a very good conformity of the two methods. The relative error between the two methods is about 0.01%.
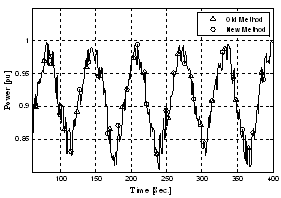 | Figure 6. Comparison of power calculating for expander in two methods |
4.2. Flicker Study
- Flicker is a phenomenon in which the power signal (50 or 60 Hz) is modulated with a 0.05 to 35 Hz envelope signal. This envelope variation is also called voltage fluctuation[17]. Because of turbo-expander generated power variations (due to gas pressure and the mass flow-rate time variant specification), it is required that the amount of flicker generation be studied and analysed. Short-term flicker-severity index
 is defined for a 10 min time interval.
  indicates irritation limit of the human eye and the
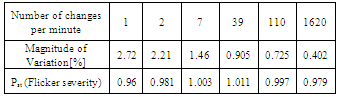
  values are eye sensible light fluctuations[17]. It should be mentioned that flicker studies is done in steady-state conditions[7]. International Electrotechnical Commission (IEC) standard flicker meter is used for the short-term flicker-severity index computation. This tool is developed in the MATLAB environment based on IEC 61000-415 standard requirements[18, 19]. On the basis of these standard recommendations, the short-term flicker severity
 , that is computed by this flicker meter should be in range (0.95-1.05) when a square wave signal modulates power signal. Block diagram of the designed flicker meter is shown in figure 7. The square wave signal variations and related results are given in table 2.
|
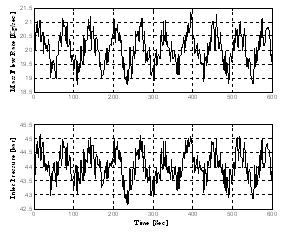 | Figure 8. The inlet mass flow-rate has 10% and inlet pressure has 5% variation with respect to their mean values |
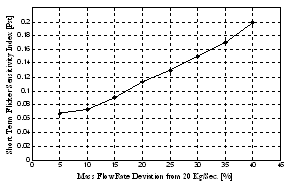
 values at the PCC with the above considerations are as figure 9. In this figure, the network parameters are constant (
 = 90MVA, X/R= 7). With increase of mass flow-rate variance from its average value, the amount of flicker at the PCC increases seriously.
 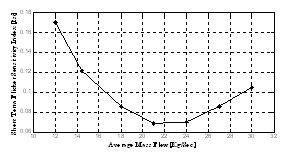 | Figure 9. Flicker at the PCC versus mass flow-rate variances from its average value of 20 kg/s |
 at PCC.
 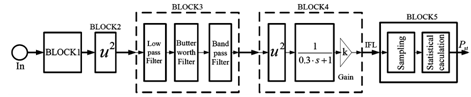 | Figure 7. Block diagram of the developed flicker meter in the MATLAB environment |
 | Figure 10. Flicker at the PCC versus various average mass flow-rate values |
4.3. Voltage Sag
- Voltage sags are short duration reductions in root mean square (RMS) voltage, caused by short circuits, overloads, and starting large motors. The interest in voltage sags is mainly due to the problems they cause on several types of equipment: adjustable-speed drives, process control equipment, and computers are notorious for their sensibility[20]. Since the simulated fault is three phase type, voltage of PCC during the fault will be around zero and induction generator starts to speed up. During the fault, the generator draws more reactive power from the network than the normal condition. After fault clearing, the generator restores its normal condition according to figure 11. This process takes about 2.2 seconds.
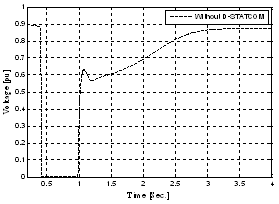 | Figure 11. Voltage of PCC during and after fault5. Power Quality Improvement Using D-STATCOM |
 and
and , an outer voltage regulation PI controller with
 ,
,  and a DC voltage controller. The overall diagram is shown in figure 12.
|
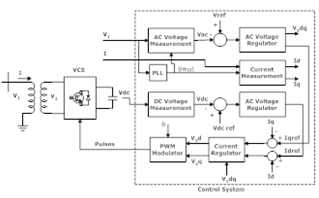 | Figure 12. Control loop of proposed D-STATCOM[23] |
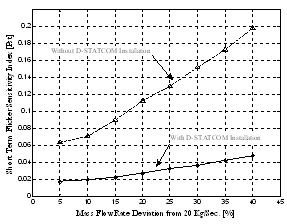
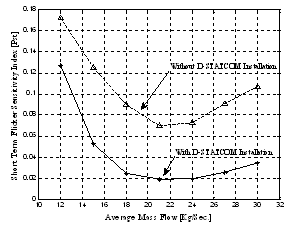 | Figure 13. Flicker level on PCC for mass flow rate varying from 5% to 40% of nominal value and 5% change in pressure |
 | Figure 14. Flicker level on PCC versus average mass flow rate |
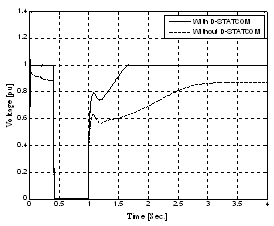 | Figure 15. Voltage restoration after a fault occurrence on PCC |
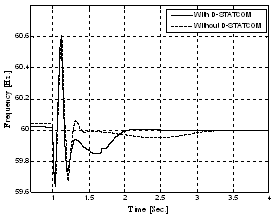 | Figure 16. Frequency restoration after a fault occurrence on PCC |
5. Conclusions
- In this study, a modular model for turbo- expander- generator system is represented with a new simple method for turbo-expander power calculation that directly calculates output power of expander from inlet and outlet gas specifications.Also this method removes the need for making lookup tables in the same way that was done in previous studies. Also in previous studies synchronous generator was coupled with the turbo-expander, but in this work, simulations are done by induction generators that are more similar to real installed turbo-expander systems such as the system installed in Neka power plant. To study power quality problems of turbo-expander coupled with induction generator, a flicker meter is developed in the MATLAB environment which measures the amount of produced flicker at the PCC. It is shown that this system can produce considerable amount of flicker on PCC due to variation of pressure and mass flow rate of inlet gas demanded by consumers. Also, because of the induction generator dynamic, voltage and frequency restoration consumes a relatively long time after a fault on PCC. In the next step, a D-STATCOM is used to improve power quality of the system and it is shown that both the flicker level and system restoration time are reduced by using the D-STATCOM.
References
| [1] | Pozivil J., “Use of expansion turbines in natural gas pressure reduction stations,” Acta Montanistica Slovakia, 2004; 9:258-260. |
| [2] | Rahman M.M, “Power generation from pressure reduction in the natural gas supply chain in Bangladesh,” Transaction of the Mech. Eng. Div., The Institution of Engineers, Bangladesh, Vol. ME 41, No. 2, December 2010. |
| [3] | Thomas R. J., Ghosh P., Kanchan Chowdhury K, “Exergy analysis of helium liquefaction systems based on modified Claude cycle with two-expanders,” Elsevier: Cryogenics, Volume 51, Issue 6, June 2011, Pages 287-294. |
| [4] | Thomas R. J., Ghosh P., Kanchan Chowdhury K, “Exergy based analysis on different expander arrangements in helium liquefiers,” Elsevier: International Journal of Refrigeration, In Press, Corrected Proof, Available online 23 November 2011. |
| [5] | Sharad W. Mohod, Mohan V. Aware, “A STATCOM-control scheme for grid connected wind energy system for power quality improvement,” IEEE systems journal, VOL. 4, NO. 3, september 2010. |
| [6] | M.J. Hossain, H.R. Pota, R.A. Ramos, “Robust STATCOM control for the stabilisation of fixed-speed wind turbines during low voltages,” Renewable Energy 36 (2011) 2897e2905. |
| [7] | Arrillaga J, Watson NR, Chen S., “Power System Quality Assessment,” Wiley: New York, 1st edition, 2000. |
| [8] | Jesse D. Maddaloni, Andrew M. Rowe, “Natural gas exergy recovery powering distributed hydrogen production,” Elsevier: International Journal of Hydrogen Energy 2007; 32(5):557–566. |
| [9] | Mehdi Babaei Turkemani, Hassan Rastegar, “Modular Modeling of Turbo-Expander Driven Generators for Power System Studies,” IEEJ Transactions on Electrical and Electronic Engineering, IEEJ Trans 2009; 4: 645–653. |
| [10] | Mehdi Babaei Turkemani, Hassan Rastegar, “Flicker Assessment of Turbo-Expander Driven Synchronous Generator in Power Distribution Network,” Journal of Iranian Association of Electrical and Electronics Engineers – Vol .7- No.1- Spring & Summer 2010. |
| [11] | Heinz P. Bloch, Claire Soares, “Turboexpanders and Process Applications,” Gulf Professional Publishing, JUN-2001. |
| [12] | R. Chacartegui, D. Sánchez, A. Muñoz, T. Sánchez, “Real time simulation of medium size gas turbines,” Elsevier: Energy Conversion and Management 52 (2011) 713–724. |
| [13] | Smith JM, Van Ness HC, Abbott MM, “Introduction to Chemical Engineering Thermodynamics,” McGraw-Hill: New York, 5th edition, 1996. |
| [14] | Ali Chaibakhsh, Ali Ghaffari, “Steam turbine model,” Elsevier: Simulation Modelling Practice and Theory 16 (2008) 1145–1162. |
| [15] | kundur P., “Power System Stability and Control,” McGraw -Hill professional: New York, repair edition, 1994. |
| [16] | Krouse PC, Wasynezuk O, Sudhoff SD, “Analysis of Electric Machinery,” IEEE press: New York, 2002. |
| [17] | Dugan RC, Mc Grangham M, “Electrical Power Systems Quality,” McGraw-Hill: New York, 2nd edition, 1996. |
| [18] | IEC 61000-4-15: Electromagnetic Compatibility (EMC) Part 4: Testing and measurement techniques Section 15: Flickermeter—functional and design specifications. |
| [19] | Bertola A, Lazaroiu GC, Roscia M, Zaninelli D. A, “Matlab-Simulink Flicker-meter model for power quality studies,” IEEE 11th International Conference on Harmonics and Quality of Power 2004, Lake Placid, Newyork, USA, 734-738. |
| [20] | Math H, Bollen J, “Understanding Power Quality Problems: Voltage Sags and Interruptions,” Wiley-IEEE press: New York, 1999. |
| [21] | H. Alasooly, “Comparison between optimal control strategies applied to a system with unified power flow controller, shunt converter and series converter,” Computers and Mathematics with Applications 60, pages 954_975, 2010. |
| [22] | A.R. Phadke, Manoj Fozdar, K.R. Niazi, “A new multi-objective fuzzy-GA formulation for optimal placement and sizing of shunt FACTS controller,” International Journal of Electrical Power & Energy Systems, In Press, Corrected Proof, Available online 13 March 2012. |
| [23] | N. G. Hingorani, L. Gyugyi, "Understanding FACTS; Concepts and Technology of Flexible AC Transmission Systems," IEEE Press book, 2000. |