-
Paper Information
- Next Paper
- Previous Paper
- Paper Submission
-
Journal Information
- About This Journal
- Editorial Board
- Current Issue
- Archive
- Author Guidelines
- Contact Us
International Journal of Energy Engineering
p-ISSN: 2163-1891 e-ISSN: 2163-1905
2012; 2(3): 67-72
doi: 10.5923/j.ijee.20120203.02
Structural and Optical Characterization of Nitrogen-doped TiO2 Thin Films Deposited by Spray Pyrolysis on Fluorine Doped Tin Oxide (FTO) Coated Glass Slides
 Abstract
 Reference
 Full-Text PDF
 Full-Text HTML
C. O. Ayieko 1, R. J. Musembi 1, S. M. Waita 1, B. O. Aduda 1, P. K. Jain 2
1Department of Physics, University of Nairobi, P.O. Box 00100, 30197, Nairobi, Kenya
2Department of Physics, University of Botswana, P/ Bag 0022, Gaborone, Botswana
Correspondence to: C. O. Ayieko , Department of Physics, University of Nairobi, P.O. Box 00100, 30197, Nairobi, Kenya.
| Email: |  |
Copyright © 2012 Scientific & Academic Publishing. All Rights Reserved.
Undoped and nitrogen-doped titanium dioxide (TiO2) thin films of 400 nm thick deposited by spray pyrolysis were structurally and optically characterized. The effect of substrate temperature on the optical properties of the films was also investigated. Structural studies of the films were undertaken by X-ray diffraction (XRD). Energy dispersive X-ray (EDX) spectrum analysis was used to confirm the presence of nitrogen atoms in the film after doping. The optical properties such as refractive index (n), energy band gap (Eg) and Urbach energy (Eu) were determined from spectrophotometric measurements of reflectance and transmittance for both undoped and doped films. The Undoped films had an energy band gap of 3.25 eV while the doped films had band gap of 2.90 eV. The Urbach energy increased from 1.00 eV for undoped films to 1.04 eV for the nitrogen-doped films. The reduction in energy band gap and increase in Urbach energy was attributed to the introduction of nitrogen impurity tail states on either the conduction band or the valence band of the titanium dioxide.
Keywords: Titanium Dioxide, Spray Pyrolysis, Doping
Article Outline
1. Introduction
- Titanium dioxide, TiO2, has gained considerable attention because of its applications as a photocatalyst[1], solar cell electrodes[2] and gas sensors[3]. The structure and optical properties of TiO2 depend to a large extend on the deposition technique. A number of techniques have been used to deposit TiO2 films: direct current reactive magnetron sputtering and thermal annealing method[4], pressing method[5] and dip coating[6]. Another method of influencing the properties of TiO2 films is by doping with elements like indium (In) and chromium (Cr)[7] cadmium (Cd), cesium (Ce) and iron (Fe)[8] on TiO2 films obtained by r.f sputtering.Apart from metallic dopants, non metallic dopant like Nitrogen (N2) gas has also been used to influence the properties of TiO2 films and an increase in visible light absorption of TiO2 after N2 doping[9]. The effect of doping TiO2 with N2 gas on the optical properties of TiO2 for dye sensitized solar cells applications has also been studied[4] where increased film transmittance and higher photoresponse in the visible spectrum was observed.Not much information is available for N2-doped spray deposited TiO2 films. This paper reports on the structural and optical properties of N2-doped TiO2 films deposited by the spray pyrolysis technique and investigates the widening the spectral limit of solar radiation through increased absorption.
2. Experimental
- Microscope glass slides (MGS) as well as fluorine doped tin oxide coated glass substrates (FTO) were used and were cleaned before deposition by keeping them in an ultrasonic bath filled with distilled water for 2 minutes. The substrates were then kept in acetone for 20 minutes and finally rinsed in distilled water. MGS were used as control to see if the nature of substrates affects the optical properties of TiO2.For the deposition TiO2 by spray pyrolysis, 120 µl of commercially available titanium (iv) isopropoxide (TiC12H28O4) (99.7% pure) and 200 ml isopropanol (C3H8O) (99.7% pure) from Fluka Ltd were mixed in a 500 ml beaker. The mixture was maintained at a temperature of 50 oC using an electric hot plate while stirring with a magnetic stirrer for about 15 minutes. This mixture formed the precursor which was atomized by the spray system using compressed nitrogen as the carrier gas. The spray nozzle-to-substrate distance was set to about 15 cm. The substrate temperature was set to 200 oC, 150 oC and 100 oC for different samples. Spraying was done in pulses. A pulse consisted of 5 seconds of spraying and 30 seconds of pause. Ten pulses were done for every sample at a precursor flow rate of 2.6 ml/min. The chemical reaction resulting in the formation of amorphous TiO2 thin film was as follows;
 | (1) |
 | (2) |
3. Results and Discussion
3.1. Structural Analysis
- Figure 1 shows the X-ray diffraction (XRD) pattern of TiO2 thin films deposited on FTO substrates at a substrate temperature of 200 oC. The films were amorphous but when annealed at 400 oC in air, distinct peaks of (101), (112) and (204) orientation formed showing crystallization. Our results are in agreement with the findings of other researchers who have obtained an amorphous-crystalline transition temperature of ~ 350 oC for TiO2[4]. The SnO2 peaks are from the FTO glass substrate.
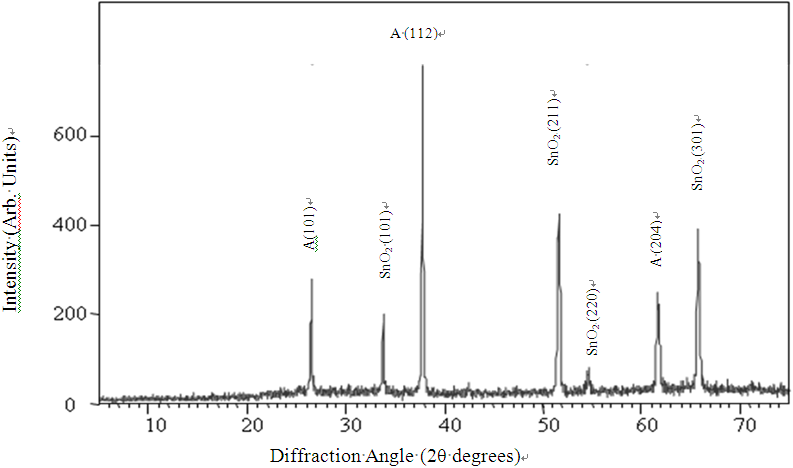 | Figure 1. XRD-pattern for TiO2 film deposited on FTO glass at a substrate temperature of 200 oC and annealed at 400 oC (A – anatase, SnO2 - tin oxide) |
3.2. Optical Characterization
3.2.1. Reflectance and Transmittance
- Figure 2 shows absorption coefficient, α, of the various samples of nitrogen doped and undoped TiO2 thin films both annealed and unannealed and it is observed that at all wavelengths the absorption coefficient, α, is higher for the nitrogen-doped films compared to the undoped films. This means that within the wavelength range of 300 – 1200 nm considered there is enhanced absorption. Figure 3 shows transmittance and reflectance properties for undoped and nitrogen-doped samples both annealed and unannealed. Absorption, reflectance and transmittance should all add up to unity. Notable from Fig.3 is that the transmittance of the undoped films is higher for the doped for all wavelengths, but reflectance is fairly constant. This implies that only transmittance and absorptance of the film vary. Therefore if transmittance is high then absorption is reduced and vice versa and therefore we can infer from both figures (Fig.2 and Fig.3) that doping increases absorptance. The graphs in Fig.2 and Fig.3 shifts towards the right, that is, from ultra violet region to visible region on doping the films whether annealed or unannealed. This is indicative of an improvement in photo-absorption. This improvement is attributed to the reduction of band gap upon nitrogen doping. Considering the graphs for the doped samples in Figure 2 it is noted that absorption coefficients are higher for the doped TiO2 thin films within the visible part of the spectrum. The enhanced absorption is due to nitrogen doping which increases the absorption coefficient of the film.
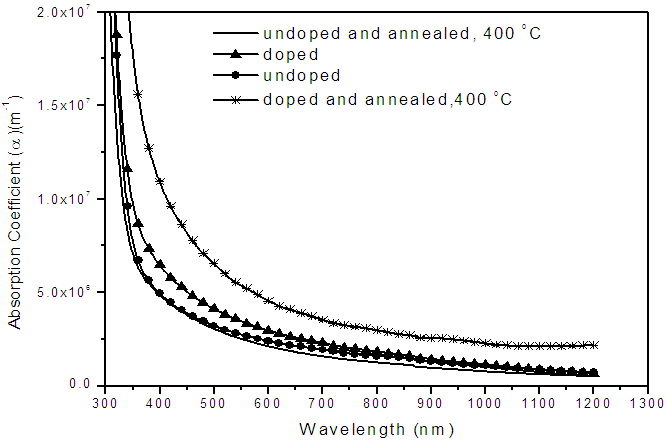 | Figure 2. Dependence of absorption co-efficient on the wavelength of nitrogen - doped and undoped TiO2 thin film of thickness of 400 nm deposited on Flourine doped tin oxide (FTO) glass slides |
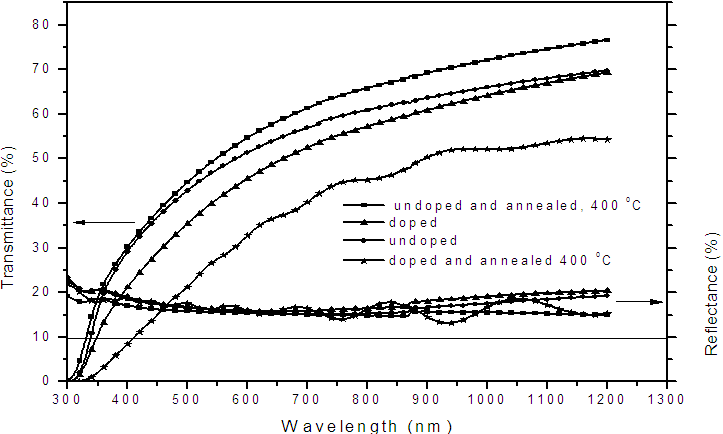 | Figure 3. Dependence of transmittance and reflectance on the wavelength of nitrogen - doped and undoped TiO2 thin film of 400 nm thickness deposited on (FTO) glass slid |
 | (3) |
3.2.2. Refractive Index
- The wavelength dependence of refractive index of the film formed at different substrate temperatures (Ts) was calculated from reflectance data using eq (4)[11]:
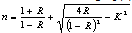 | (4) |
 | (5) |
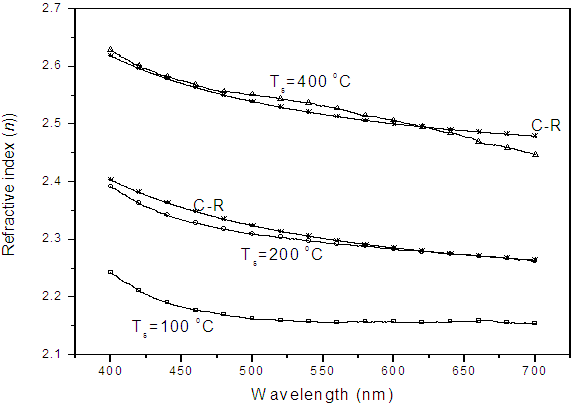 | Figure 4. Effect of substrate temperature and annealing on refractive index of TiO2 coated on MGS at 100 oC and 200 oC and Cauchy Rieman dispersion law. C-R – Cauchy Rieman’s Curve |
3.2.3. Effect of Substrate Temperature and Nature of Substrate on Band Gap
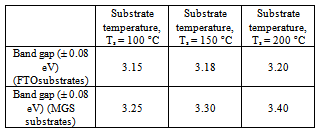
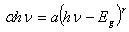
- Figure 5 shows a plot of (αhν)2 versus hν for the determination of band gap for film grown on both MGS and FTO glass substrates. The band gap values are given in Table 1. It is noted that within the experimental error (± 0.08 eV) the band gap is invariant with substrate temperature. for film grown on both MGS and FTO glass substrates as shown in Table 1.
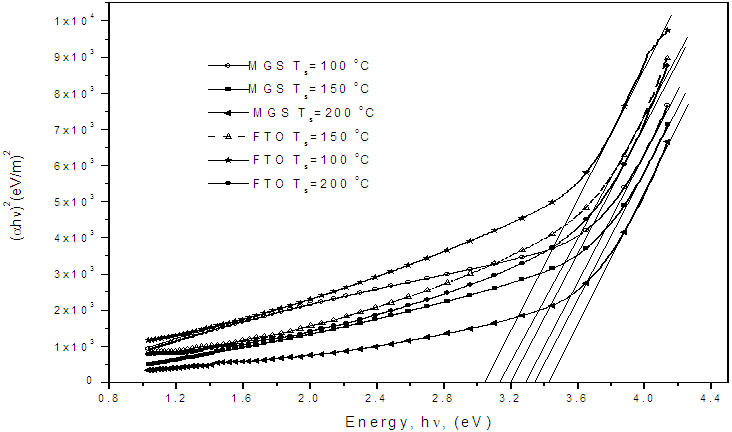 | Figure 5. A plot of (αhν)2 vs hν for determination of band gap |
|
 | (6) |
3.2.4. Effect of Nitrogen-Doping On the Band Gap of TiO2 Coated on Fluorine Doped Tin Oxide (FTO) Glass Slides
- Figure 6 presents the band gaps of films coated on fluorine doped tin oxide (FTO) substrate and annealed at 400 oC. There was a significant decrease in the band gap, the undoped film had a band gap of 3.25 eV compared to the nitrogen-doped which had 2.90 eV. This observation concurs with results earlier obtained by Baoshun[15] who also observed a significant decrease in the band gap TiO2 prepared by sputtering from 3.2 eV to 2.7 eV upon nitrogen doping. This reduction is as a result of nitrogen impurity states which introduce tail energy levels either in the conduction band or valence or both of the undoped titanium dioxide.The presence of nitrogen in the structure of TiO2 is further confirmed by EDX results shown in Fig.7. The more pronounced peak is that of oxygen which is a combination of the oxygen in fluorine-doped tin oxide (F:SnO2) back contact and TiO2. Since carbon paste was used to make the films conductive in SEM analysis, the carbon peak observed could be from the paste but not the film coating and hence not forming part of the intended film. The peaks for titanium were not seen since the appearance of an element in the micrograph depends upon its electronic configuration and the acceleration voltage which in certain ranges only elements with given atomic numbers can be detected.
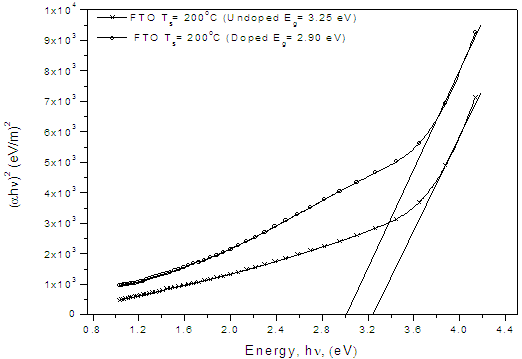 | Figure 6. Graph showing the effect of doping TiO2 thin film coated on conducting flourine doped tin oxide (FTO) glass slides with nitrogen (N2) and annealed at 400 oC |
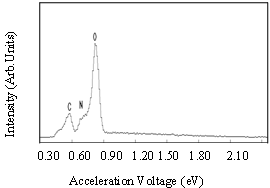 | Figure 7. EDX micrograph of the nitrogen–doped TiO2 (N: TiO2) coating on FTO glass substrates annealed at 400 oC in air |
3.3. Urbach Energy
- Modification of the band structure which may be due to introduction of defects in a material can be established by determining the materials Urbach energy before and after the defects are introduced. Urbach energy gives a measure of structural disorder in a material. The formula for determination of Urbach energy is as follows[7]:
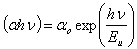 | (7) |
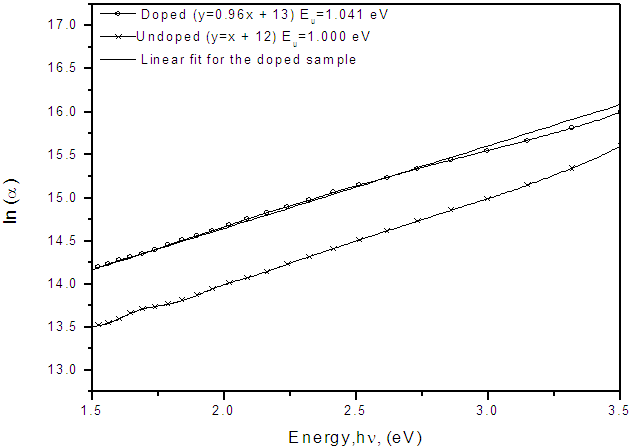 | Figure 8. Urbach energy (Eu) of nitrogen doped and undoped TiO2 coated on conducting flourine doped tin oxide (FTO) glass slides |
4. Conclusions
- TiO2 thin film deposited by spray pyrolysis at substrate temperature of 100 oC is amorphous but when annealed at 400 oC, it changes phase to anatase with sharp XRD peaks showing crystallization as temperature increases. XRD studies showed that after annealing the films were predominantly anatase with characteristic (101), (112) and (204) planes. Optical studies were carried out on the nitrogen-doped and undoped TiO2 films and reflectance, transmittance, band gap, refractive index and Urbach energy were determined. From the transmittance and reflectance spectra, nitrogen-doped films had higher absorption compared to the undoped films. The energy band gap of titanium dioxide (TiO2) was not affected by substrate temperature if coated by spray pyrolysis on same substrate material, however, if the nature of the substrate material was changed the energy band gap changed slightly. The values of the energy band gap obtained fall between 3.10 eV to 3.4 eV which was within the range of values for TiO2 phases, that is approximately 3.2 eV recorded upon annealing. Refractive index, n, of TiO2 film was established to increase with substrate temperature due to densification of the films as the temperature increases. The refractive index shows a general decrease as the wavelength increases for all the substrate temperatures.Doping the TiO2 thin film with nitrogen reduces the band gap but increases Urbach energy both is attributed to the introduction of impurity states either on the conduction band or valence or both conduction and valence bands. There was a significant decrease in the band gap upon doping, the undoped film had a band gap of 3.25 eV compared to the nitrogen-doped which had 2.90 eV. The Urbach energy increased from 1.000 eV for undoped films to 1.041 eV for nitrogen-doped films.
ACKNOWLEDGEMENTS
- This work is supported by African Materials Science and Engineering Network (AMSEN) and International Programme in the Physical Sciences (IPPS), Uppsala University (Sweden).