Marouani Ismail1, Guesmi Tawfik2, Hadj Abdallah Hsen3
1Electrical engineering Department, High institute of technological studies, Kasserine, 1200, Tunisia
2Electrical engineering Department, Biomedical institute of Tunisia, Tunisia, 1006, Tunisia
3Electrical engineering Department, National engineering school of Sfax, Sfax, 3038, Tunisia
Correspondence to: Marouani Ismail, Electrical engineering Department, High institute of technological studies, Kasserine, 1200, Tunisia.
| Email: |  |
Copyright © 2012 Scientific & Academic Publishing. All Rights Reserved.
Abstract
With the electricity market deregulation, the number of unplanned power exchanges increases. If these exchanges are not controlled, some lines may become overloaded. Network contingencies often contribute to overloading of branches, violation of voltages and also leading to problem security. This paper presents a procedure based on the contingency severity index (CSI) described by a real power flow performance index (PI) to place multi type FACTS devices (Flexible AC Transmission System) in order to eliminate or alleviate the line over loads. TCSC and UPFC are considered and modeled for steady state analysis. Once the location is determined, their type, their optimal settings and cost of installation can be obtained by solving the optimization problem using genetic algorithms (GA). The proposed approach is tested on 9-bus test system.
Keywords:
Performance Index, Contingency Severity Index, FACTS devices, GA
Cite this paper: Marouani Ismail, Guesmi Tawfik, Hadj Abdallah Hsen, Optimal Location of Multi Type FACTS Devices for Multiple Contingencies Using Genetic Algorithms, International Journal of Energy Engineering, Vol. 2 No. 2, 2012, pp. 29-35. doi: 10.5923/j.ijee.20120202.05.
1. Introduction
Concept FACTS (Flexible Alternating Current Transmission Systems) includes all the devices based on power electronics. This concept makes the improving transfert of power flow possible. The technology of these systems ensures a higher speed than the traditional electromechanical systems[1].Both the choice of the adapted FACTS devices and its site in the electrical supply network, depend on the objectives we want to reach.In stationary regime, the FACTS devices are used to control the transits of powers in order to eliminate or reduce the overloads in the lines and control the voltage at load buses. The required objectives have either technical nature or economic one [2,3]. FACTS devises include TCSC (Thyristor Controlled Seies Compensator), SVC (Static Var Compensator), UPFC (Unified Power Flow Controller), etc.A method discussed in[4], applied the optimal placement of a shunt device placed in a long line to increase the capacity of the transmissible power by improving the stability of system. Similar methods presented in[5] concerning the placement of the FACTS to increase the voltage stability, based on a nodal analysis of the equations of the load flow modified by the FACTS. A hybrid method based on the genetic algorithms and the linear programming presented in[6] to find optimal placement of multiples SVC. The objectives are first to prevent the voltage collapse and second minimize the investment cost. The method presented in[7] determines the optimal sites of devices FACTS shunt by a singular analysis of the Jacobean matrix. The FACTS are placed at the nodes having the largest sensitivity of voltage to the load variations. In the reference[8], the models of FACTS are integrated in the load flow calculation. They are used to reduce the real power losses in the network. The allocation is based on the sensitivity analysis of the losses expressions to the controllable parameters by FACTS devices.In this paper, the essential idea of multi type FACTS devices, TCSC and UPFC placement is to determine a branch which having the most sensitivity for single and double contingencies. After placing FACTS devices, their Type, optimal settings and cost of installation can be obtained by solving the optimization problem. The nonlinear optimization problem is solved by genetic algorithms (GA).
2. FACTS Devices Models
2.1. Transmission Line
The figure.1 shows a simple transmission line represented by its lumped Π equivalent parameters connected between bus-i and bus-j. The real and reactive power flow from bus-i to bus-j can be written as | (1) |
 | (2) |
Where  . Similarly, the real and reactive power flow from bus-j to bus-i
 | (3) |
 | (4) |
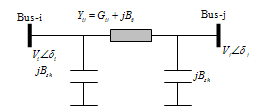 | Figure 1. Transmission line mode |
2.2. TCSC Model
Figure.2 shows the model of transmission line with TCSC connected between buses i and j. The TCSC can be considered as a static reactance  The real and reactive power flow from bus-i to bus-j, and from bus-j to bus-i of a line having series impedance and a series reactance are[9]:
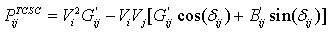 | (5) |
 | (6) |
 | (7) |
 | (8) |
Where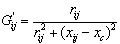 ;
;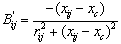 .The change in the line flow due to series capacitance can be represented as a line without series capacitance with power injected at the receiving and sending ends of the line as shown in Figure.3. The real and reactive power injections at bus-i and bus-j can be expressed as
 | (9) |
 | (10) |
 | (11) |
 | (12) |
Where 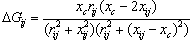 and
and 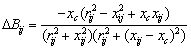
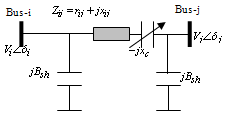 | Figure 2. Model of TCSC |
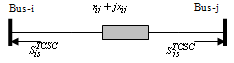 | Figure 3. Injection Model of TCSC |
2.3. UPFC Model
The model of UPFC placed in lin-k connected between bus-i and bus-j is shown in figure.4. UPFC has three controllable parameters, namely, the magnitude and the angle of inserted voltage (VT,  ) and the magnitude of the current (Iq).Based on the equivalent circuit of UPFC and the vectorial diagram (Figure.4), the basic mathematical relations can be given as
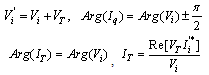 | (13) |
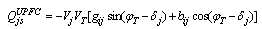
The power flow equations from bus-i to bus-j and from bus-j to bus-I can be written as 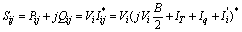 | (14) |
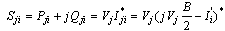 | (15) |
The active and reactive power flow in the line having UPFC can be written, with (13)-(15), as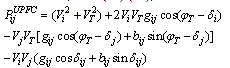 | (16) |
 | (17) |
 | (18) |
 | (19) |
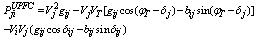
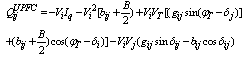
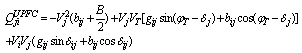
From basic circuit theory, the injected equivalent circuit of figure.5 can be obtained. The injected active and reactive power at bus-i and bus-j and reactive powers of a line having a UPFC are: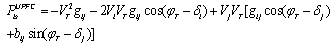 | (20) |
 | (21) |
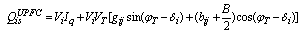 | (22) |
 | (23) |
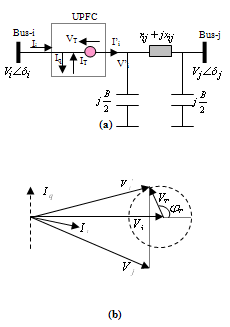 | Figure 4. Schematic diagram of UPFC, Equivalent circuit (a), Vector diagram (b) |
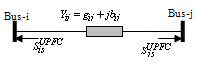 | Figure 5. Injection model of UPFC |
3. Problem Formulation
3.1. Placement of FACTS Devices
The essential idea of the proposed multi type FACTS devices, UPFC and TCSC placement approaches is to determine a branch which has more sensibility for the large list of single and double contingencies which are defined as the following: • Single Contingency is aimed at eliminating successively all the branches and transformers of the network element by element. For each elimination we make an analysis of security constraints. When an overload in the lines or there is a variation of the levels of the critical voltage appears. We look for the optimal configurations of FACTS devices for which the network turns to its normal situation.• Double contingency is aimed at eliminating two elements simultaneously, keeping the same operations done with single contingency. This section will describe the definition and calculation of the contingency severity index and the optimal placement procedure for the UPFC and TCSC.
3.1.1. Performance Index: PI
The severity of the system loading under normal and contingency cases can be described by a real power line flow performance index[10], as given in the following: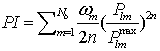 | (24) |
Where Pim is the real power flow and  is the rated capacity of the branch-m,
  a real nonnegative weighting coefficient of the branches and n is the exponent.
  is the total number of branches in the network.In this paper the value of the exponent has been taken as 2 and
  . It was found that the masking effect was removed with this value for the considered examples[11].The real power flow PI sensitivity factors with respect to the control parameters of UPFC and TCSC can be defined as
 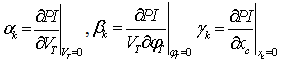 ,Using (24), the sensitivity of PI with respect to FACTS (UPFC, TCSC) parameter Xk (
 and xc) connected between bus-i and bus-j can be written as
 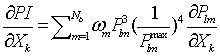 | (25) |
Using dc power flow equations[10] where s is slack bus, the real power flow in a branch-m ( can be represented by
 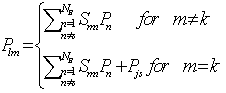 | (26) |
Where Smn is the mnth element of matrix [S] that relates line flow with power injections at the buses without FACTS, NB is the number of buses in the system.Using (25) and (26), the following relations can be derived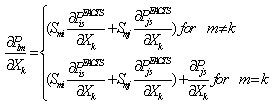 | (27) |
3.1.2. Contingency Severity Index :CSI
The CSI for branch “m” is defined as the most valuable of the sum of the sensitivities of branch “m” taking into consideration single and multiple contingency, and is expressed as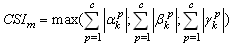 | (28) |
Where c is the number of contingenciesCSI values are calculated for every branch by using (28). The branch with the largest CSI is considered as the best location for Facts devices.
3.2. Optimal Setting of FACTS Devices
The UPFC can be considered as combination of a TCSC in series with the branch and SVC connected across the corresponding buses between which the branch is connected.After fixing the location, to determine the best possible setting of FACTS devices for all possible single and multiple contingencies, the optimization problem will have to be solved using GA approach.The objective function for this work is,Obj=minimize  and
and 
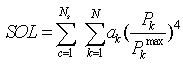 | (29) |
Where:N: Number of lines.Ns: Number of single contingency considered. : Weight factor =1.
 : Real power transfer on branch k.
 : Maximum real power transfer on branch k.SOL: represents the severity of overloading.IC: Installation cost of FACTS devices.Installation cost includes the sum of installation cost of all the devices and it can be calculated by:
  | (30) |
 | (31) |
Where, S is the operating range of FACTS in MVARQ1: MVAR flow through the branch before placing FACTS devices.Q2: MVAR flow through the branch after placing FACTS devicesThe objective function is solved with the following constraints:
3.2.1. Security Limits
Two inequality constraints are considered. The first constraint includes voltage limits at load buses as shown in (32) | (32) |
Where  and
and  are respectively lower and upper limits voltage at load buses. The second is represented by the line flow limits. It considers that the real power flow
  in each transmission line i among the
  lines of the power system must be lower than its maximum value
  . Mathematically, it can be written as :
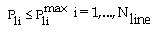 | (33) |
3.2.2. Voltage Stability Constraint
VS includes voltage stability constraints in the objective function and is given by: | (34) |
Where, Vb: voltage at bus b.
3.2.3. FACTS Devices Constraints:
The FACTS devices limit is given by: | (35) |
 | (36) |
Where: XL: Original line reactance in (pu).xc: Reactance added to the line where TCSC is placed in (pu)QUPFC: reactance power injected at UPFC placed in MVAR.
3.2.4. Power Balance Constraints
The power balance equations are given by: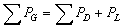 | (37) |
Where : Total power generation.
 : Total power demand.
 : Losses in the transmission network.
4. Overview of GA
In this paper, GA has been used for choice and setting parameters of the FACTS devices. The first step GA is to fix a random initial population, which is a set of candidate solutions. In general, candidate solutions are represented as coded number corresponding to each variable of the optimization problem, called chromosome. Also, for each individual, a fitness function, related to the objective function, is affected. GA operates in generations.One generation is as follows :● For each individual of the current population, a fitness function is affected.● One or more parents are chosen according to their fitness function.● GA operators, such as, crossover and mutation are applied to parents to produce children.● Theses children are inserted into the following population.This process is repeated until the population size is reached.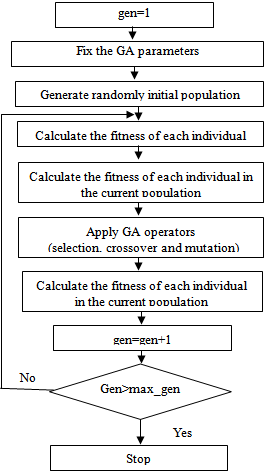 | Fgure 6. Flow chart of the GA |
The flow chart of the GA can be as in the following figure.The optimal configuration of the FACTS devices is encoded by its location and control parameters.The location is defined by the number  of branch where it is installed and the number
  of the bus where the parallel component of UPFC is connected.
  ,
,  , and
, and  are considered as the control parameters.The proposed GA has been implemented using real-coded genetic algorithm[12]. So, a chromosome X corresponding to a decision variable is represented as a string of real values
  , i.e.
  .
.  is the chromosome size and
  is a real number within its lower limit
  and upper limit
  . i.e.
  . Thus, for two individuals having as chromosomes respectively X and Y and after generating a random number
  , the crossover operator can provide two chromosomes
  and
and  with a probability
  as follows:
 | (38) |
In this study, the non-uniform mutation operator has been employed. So, at the tth generation, a parameter  of the chromosome
  will be transformed to other parameter
  with a probability
  as follows :
 | (39) |
 | (40) |
Where  is random binary number,
  is a random number
  and
and  is the maximum number of generations.
  is a positive constant chosen arbitrarily.In this work the fitness is defined as follows:
 | (41) |
Where : : Penalty factor
 : Scaling factor
5. Simulation Results
The solution for optimal location of FACTS devices to minimize the installation cost of FACTS devices and overloads for 9-bus WSCC (Western System Coordinating Council) test system were obtained in this section. Both the bus data and line data of the 9-bus test system are taken from[13].
5.1. Single Contingency
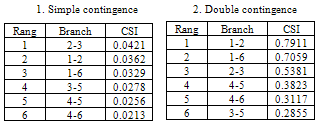
The location of FACTS devices depends upon the CSI values which are calculated for 6 branches by considering all single contingencies. Then the branches are ranked according to their values of CSI which are given in table 1.
5.2. Double Contingency
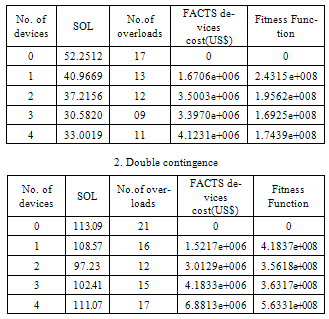
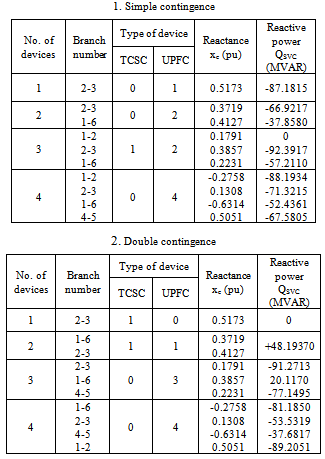
Considering two branches outaged at a time for 6 branches, 15 doubles contingency combinations are available. Considering all the double contingency combinations, the 6 branches are ranked based on their CSI values, are given in table 1.Table 1 shows that, branch number 2-3, 1-2 is chosen as the best location to place the first available multi type FACTS devices for single and double contingencies. The placement of other FACTS devices can proceed where branch 1-2, 1-6 will be the second choice, depending on the available budget. Branch 1-6, 2-3 are the third choice and so on. Once the location is determined, their optimal setting, their type and cost of installation can be obtained by solving the optimization problem using GA.The table 2 shows the overloading of branches when different numbers of FACTS devices are installed.Table 1. Ranking of branches for 9-bus test system
 |
| |
|
Table 2. 1. Simple contingence
 |
| |
|
Table 2 shows the reduction of the severity index (SOL) and the number of the overloads from 17 to 09 when three FACTS devices are installed for simple contingencies, and from 21 to 12 when two FACTS devices for double contingencies. From this situation, if there is an increase in a number of FACTS devices, SOL and cost of installation start to increase also. Hence in this case, the number 3 and 2 are considerable for the optimal system security of the network for simple and double contingencies. The optimal arrangements, the corresponding line and the type of FACTS devices are obtained in table 3 by solving the optimization problem using GA.Table 3. Optimal setting multi type FACTS devices
 |
| |
|
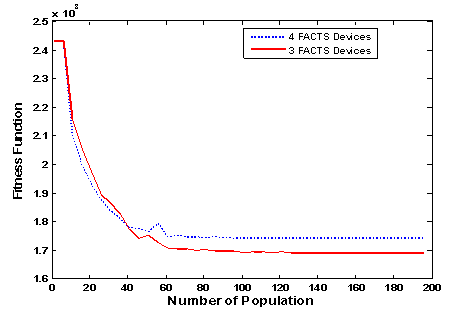 | Figure 7. Fitness convergence curve for single contingency |
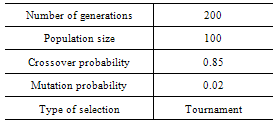
Figure.7 and figure.8 represent the fitness convergence curve for single and double contingencies. The simulation carried out with multiple runs to get the optimal results of multi type FACTS devices. GA parameters used in this work are taken in table 4. | Figure 8. Fitness convergence curve for double contingency |
Table 4. GA parameters
 |
| |
|
5.3. Effects of FACTS Devices
In order to verify the presented models of FACTS devices, the effectiveness of the approach proposed and illustrate the impacts of FACTS devices on power losses in transmission lines and voltage deviation at load buses, we study three cases for a test system 9-bus.Case 1: results without FACTS.Case 2: results with FACTS devices for simple contingencies, for the optimal system security of the network.Case 3: results with FACTS devices for double contingencies, for the optimal system security of the network.The voltage profile at load buses of the system with and without the FACTS devices are shown in Fig.9. As shown in the figure, the voltage at all buses is in the acceptable limits (0.9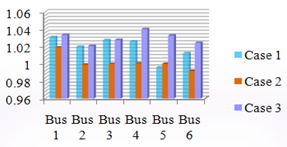 | Figure 9. Voltage profile after and before employing FACTS devices |
Figure.10 shows the effects of FACTS devices on active and reactive power losses in the transmission lines of the system, where they are installed for the optimal system security of the network, for simple and double contingencies. | Figure 10. Evolution of the active and reactive power losses with and without FACTS |
6. Conclusions
In this paper, a sensitivity-based approach has been used to find (for finding) suitable placement of FACTS devices along the system branches based on the CSI values to alleviate system overloads and to improve the system security margin, considering simple and double contingencies. The type of device to be placed. cost of installation and their settings were taken as the optimization parameters for both single and double contingencies. This optimization problem is solved using GA techniques. TCSC and UPFC are considered in this work. It is observed that the system security margin can not be improved further after placing some optimal number of multi type FACTS devices. 9-bus test system is used to evaluate the performance of these approaches.
Appendix
The 9-bus western system coordinating council (WSCC) system is shown on one-line diagram. The system contains three generators at buses 9, 8 and 7. Bus 9 is considered as the slack bus. All data of the system are marked in the one-linediagram of the system . Theses values are given in pu. Considering a base power of 100 MVA for the overall system and base voltages of 16.5 kv for bus 9, 18.1 kv for bus 8, 13.8 kv for bus 7, and 230 kv for all other buses.
References
| [1] | G. S. Eskandar, "Apport de l'UPFC à l'amélioration de la stabilité transitoire des réseaux électriques", Thèse de doctorat, Université Henri Poincaré, Nancy-I, Octobre 2003 |
| [2] | J. Griffin, D.Atanackovic, and F.D.Galiana. A Study of the Impact of FACTS on the Secure-Economic Operation of Power Systems.12 th Poqer systems computation Conference,pages 1077-1082, August 1996. |
| [3] | F.D.Galiana, K.C. de Almeida, M.Toussaint, J.Griffin, D. Atanackovic,B.T.Ooi, and D.T.McGillis.Assessment and control of the impact of FACTS Devices on power system performance. IEEE Trans.Power systems,11(4):1931-1936, November 1996. |
| [4] | M.H.Haque, Optimal Location of Shunt FACTS Devices in Long Transmission Lines IEE proc. Gener. Transm. Distrib.147(4):218-222, July 2000. |
| [5] | M.A.Pérez, A.R. Messina and C.R.Fuerte-Esquivel. Application of FACTS Devices to Improvesteady state voltage stability. Power Engineering Society Summer Meeting 2:1115-1120, 2000. |
| [6] | E.E.EI-Araby,N.Yorino, and H.Sasaki. A tow level Hybrid GA/SLP for FACTS Allocation Problem Considering Voltage security. Electrical power systems research, 25:327-335,2003 |
| [7] | Z.Gamm and I.I. Golub. Determination of locations of FACTS and energy Storage by the Singular Analysis. International Conference on power system Technology, POWERCON’98, 1:411-414,1998. |
| [8] | P.Preedavichit ans S.C.Srivastava. Optimal Reactive Power Dispatch Considering FACTS Devices. Electrical power systems research 46(3):251-257 September 1998 |
| [9] | Verma K.S., Singh S.N., Gupta H.O., 2001.FACTS devices location for enhancement of total transfer capability, Power Engineering Society Winter Meeting, IEEE, Vol.2:522-527. |
| [10] | A.J. Wood and B.F. Wollenberg, Power Generation, Operation and Control. New York:Wiley,1996 |
| [11] | Verma K.S., Singh S.N., Gupta H.O., Impact on real and reactive power pricing in open power market using unified power flow controller. Vol.21, NO.1. February 2006 |
| [12] | Herrera, F.; Lozano, M. & Verdegay, J.L. (1998). Tackling real-coded genetic algorithm: operators and tools for behavioural analysis, Artif. Intell. Rev., Vol. 12, No. 4, 1998, pp. 265-319. |
| [13] | G. Radman, R.S. Raje, “Power flow model/calculation for power system with multiple FACTS controller”, Electric power Systems Research, Vol. 77, pp. 1521-1531, 2007. |
 Abstract
 Reference
 Full-Text PDF
 Full-text HTML