-
Paper Information
- Previous Paper
- Paper Submission
-
Journal Information
- About This Journal
- Editorial Board
- Current Issue
- Archive
- Author Guidelines
- Contact Us
International Journal of Electromagnetics and Applications
p-ISSN: 2168-5037 e-ISSN: 2168-5045
2017; 7(2): 38-47
doi:10.5923/j.ijea.20170702.03

Numerical Investigation on using an Electromagnetic Wave Sensor to Detect Water Hardness in Water Cooling System Industry
 Abstract
 Reference
 Full-Text PDF
 Full-text HTML
K. H. Teng1, 2, M. Ateeq3, Shaw A.1, Al-Shamma'a A.1, S. N. Kazi2, B. T. Chew2, Kot P.1
1Department of Build Environment, Faculty of Engineering & Technology, Liverpool John Moores University, Liverpool, United Kingdom
2Department of Mechanical, Faculty of Engineering, University of Malaya, Kuala Lumpur, Malaysia
3Low Carbon Eco-Innovatory, Faculty of Engineering & Technology, Liverpool John Moores University, Liverpool, United Kingdom
Correspondence to: K. H. Teng, Department of Build Environment, Faculty of Engineering & Technology, Liverpool John Moores University, Liverpool, United Kingdom.
| Email: |  |
Copyright © 2017 Scientific & Academic Publishing. All Rights Reserved.
This work is licensed under the Creative Commons Attribution International License (CC BY).
http://creativecommons.org/licenses/by/4.0/

Numerical study of using novel electromagnetic wave technique to detect water hardness concentration has been presented in this paper. Simulation is powerful and efficient engineering methods which allows for a quick and accurate prediction of various engineering problems. The RF module is used in this research to predict and design electromagnetic wave propagation and resonance effects of a guided wave to detect water hardness concentration in term of frequency domain, eigenfrequency and mode analysis. A cylindrical cavity resonator is simulated and designed in the electric field of fundamental mode (TM010). With the finite volume method, the three-dimensional governing equations were discretized. Boundary conditions for the simulation were the cavity materials as aluminum, two ports which include transmitting and receiving port, and assumption of vacuum inside the cavity. The designed model was success to simulate a fundamental mode and extract S21 transmission signal within 2.1 GHz – 2.8 GHz regions. The signal spectrum under effects of port selection technique and dielectric properties of different water concentration were studied. It is observed that the linear reduction of magnitude in frequency domain when concentration increase. The numerical results were validated closely by the experimental available data. Hence, conclusion of the available COMSOL simulation package is capable of providing acceptable data for microwave research.
Keywords: Numerical and experimental, Electromagnetic wave technique, Water hardness concentration, Signal spectrum, Eigenfrequency, Frequency domain
Cite this paper: K. H. Teng, M. Ateeq, Shaw A., Al-Shamma'a A., S. N. Kazi, B. T. Chew, Kot P., Numerical Investigation on using an Electromagnetic Wave Sensor to Detect Water Hardness in Water Cooling System Industry, International Journal of Electromagnetics and Applications, Vol. 7 No. 2, 2017, pp. 38-47. doi: 10.5923/j.ijea.20170702.03.
Article Outline
1. Introduction
- Water is a universal solvent which is easy to handle, save to consume, widely available and inexpensive in most industrialized regions [1]. Moreover, water is an efficient heat transfer medium compared to other materials, especially air, and could dissolve most of the substances come into contact. These unique properties of water make it ideal for an application of cooling water in the industry [2]. However, it causes an unwanted side effect for industrial applications. The water hardness concentration in cooling systems due to the dissolved ions may exceed in relation to the solubility of some minerals such as calcium carbonate and calcium sulphate and deposit an insulated layer within the pipes and on the system surfaces [3]. This problem significantly reduces the overall performance of the cooling tower/ system and requires regular maintenance to restore the desired performance for the process it serves [2, 4].Cooling water system plays a vital role in the process in most of the industries. For examples, petrochemical plants, food plants, manufacturing facilities, chemical processing plant, refineries, steel mills, chemical processing plant, large building, etc. depend on the cooling water system to maintain the continuous plant production [5, 6]. It controls temperature of the overall system and carries the heat away by circulating the hot process fluids into the cooling system. The total value of the production process will be sustained only if the cooling system can maintain the appropriate process temperature and pressure [7, 8]. To maintain a robust performance of the cooling system, an efficient and reliable monitoring is essential. Real-time monitoring of the system condition will help in establishing an optimum level of preventive maintenance that is most effective with respect to the energy and maintenance costs [9]. Meeting these objectives will ensure improvement in the quality of the plant’s production, prolong lifespan of the plant equipment, reliable maintenance prediction and reduced plant’s operating costs [10]. Water quality monitoring is standard practice in the water cooling system industry [11]. The plant engineer can use this information to predict the equipment life and prevent the foulant from entering the cooling system. Monitoring also helps the engineer to identify factors responsible for various problems and assures implementation of the solution to mitigate the problem [12].Most industrial water cooling systems constantly undergo through changes because of the seasonal variations in the water quality, varying plant operating conditions such as heat transfer rate, fluid flow velocity, pressure, new environment laws and other factors [13]. The current practice in the industry is to monitor the system manually. This involves plant operators or technicians conducting chemical tests and comparing the results to specified control limits. The testing frequency varies from once a day to once an hour, depending on the resources available. The tests conducted may include hardness, pH and conductivity to name a few. Using the test results, the plant operators manually adjust a chemical feed pump or blowdown valve, making an estimate of the degree of change necessary [14, 15]. Manual monitoring is satisfactory, however, it is possible to accidently switch details and end up with an inconsistent data entry. In addition, it requires a budget to be set aside for regular staff training, the methods being time consuming and it becomes costly to produce regular reports due to the amount of time invested in these testing methods [16, 17]. Recently, electromagnetic wave sensing technology have been developing rapidly and successfully used as a sensing method for various industrial applications including solution concentrations [18, 19], fluid level measurements , material moisture content [20], for continuous process monitoring of biogas plants [21], for the determination of moisture content in soil [22], in the food industry for the verification of the vegetable oil types [22, 23] and in the healthcare industry, for example for real-time monitoring of glucose in diabetic patients [24, 25] and for non-invasive monitoring of bodily fluids [26, 27]. Therefore, product designs of suitable sensor such as dimension, materials, etc. for specific application become a challenge for engineers and researchers. Simulation is a very useful and powerful tool to analyze, design, and operate complex systems [28]. By making use of software prototypes before committing to any actual design or experimental resources can significantly reduce the project costs saving thousands, even hundreds of thousands of dollars. The simulated models enable validation of the experiment hypotheses and can describe how the systems will perform in a real-world application without substantially investing on an experimental trial whose outputs is unknown [29, 30]. In addition, it is a cost-effective mean of exploring new processes, without having to resort to pilot programs. It could reduce project timescales as well because of the ease with which specific parameters can be varied for different sets of experiments depending on the desired outputs [31]. Simulation provides a way of better understanding the system and helps to produce high quality results faster. Moreover, it is an efficient communication tool, showing how an operation works while stimulating creative thinking about how it can be improved [32].Modeling of the system through the use of available Radio Frequency (RF) modeling software package is a useful design tool for electromagnetic wave simulation. It can systematically describe how the system will perform [33]. The available interface can solve frequency dependent, time-harmonic and other electromagnetic-field distributions which are very useful to determine the performance of a system in the context of its application[34]. Such a modeling tool can support various study types such as frequency domain, eigenfrequency, mode analysis and boundary mode analysis to solve wave equation for the applied electric field [35]. A simulation program is an important tool that you can use to:Ÿ Predict the course and results of certain actions.Ÿ Understand why observed events occur.Ÿ Identify problem areas before physical design and implementation.Ÿ Explore the effects of modifications and various factors.Ÿ Confirm that all variables are known.Ÿ Evaluate ideas and identify inefficiencies.Ÿ Gain insight and stimulate creative thinking.Ÿ Communicate the integrity and feasibility of your plans.Electromagnetic wave sensing technology is an innovative, novel, non-invasive and on-line monitoring technique with a high potential to monitor water quality and subsequently performance of the cooling system [36]. In a laboratory environment, it uses a vector network analyzer to measure scattering parameter (S-parameter) to determine concentration of target chemicals. A simulation is conducted in this paper to assist the design of a suitable microwave cavity resonator and to examine the feasibility of it for an industrial application.
2. Water Hardness Properties for Electromagnetic Waves Sensing
2.1. Water Hardness Properties
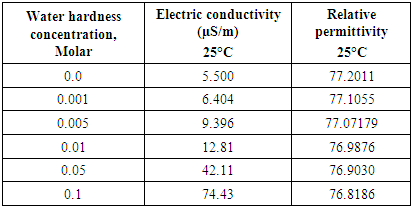
- In this experimental investigation, the relative permittivity of water with varying hardness was determined experimentally. A cylindrical microwave cavity resonator designed work along with the experimental setup. It was fabricated from aluminum and has 4 parts (the top, body and two ports to launch microwave inside the cavity). Sample solution was prepared in low-loss quartz tube (outer diameter of 15mm) with thin wall and inserted in the middle of cavity as in Figure 1. Electric conductivity of water with varying hardness was measure by using AB200 pH/conductivity meter (Fisher Scientific) and tabulated in Table 1. Simulation model was constructed similar to experimental cavity design by assign aluminum as the cavity material and polyvinyl chloride as tube material. The aluminum and polyvinyl chloride properties were tabulated in Table 2. Material properties are investigated at a constant temperature, i.e. 25 ± 1°C. All the experiments results were assigned as user define input into simulation package to achieve reliable results.
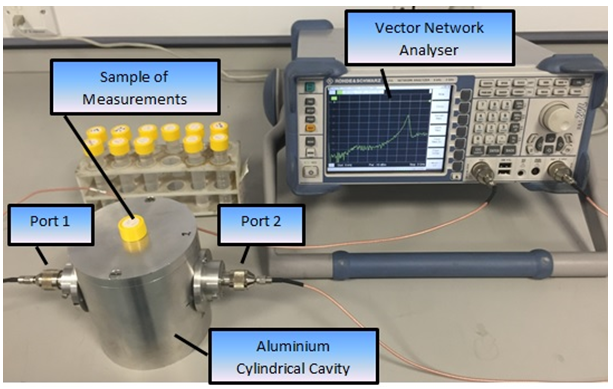 | Figure 1. Microwave cavity resonator measurement system used in experiment |
|
|
3. Numerical Simulation
3.1. Model Geometry
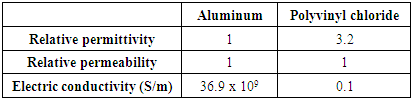
- RF module in COMSOL Multipyhsics 5.1 has been used to investigate the eigenfrequency inside a cylindrical cavity and response signal spectrum in a frequency domain to simulate the effect of hardness concentration. Figure 2 shows the model of the cavity used in this study. The cylindrical cavity has a radius of 4.5cm and a height of 10cm.
 | Figure 2. Model schematic of the cylindrical cavity |
3.2. Meshing Validation
3.2.1. Meshing
- Modeling geometries with a high aspect ratio can be one of the challenging tasks for the finite element analysis. The appropriate mesh will improve the accuracy of the geometry and the resultant solution. In order to avoid excessive computation resources and time when solving models, meshing validation must be conducted to generate an efficient and accurate finite element meshed model for accurate simulation results. Figure 3 shows different meshes used in this study simulation.
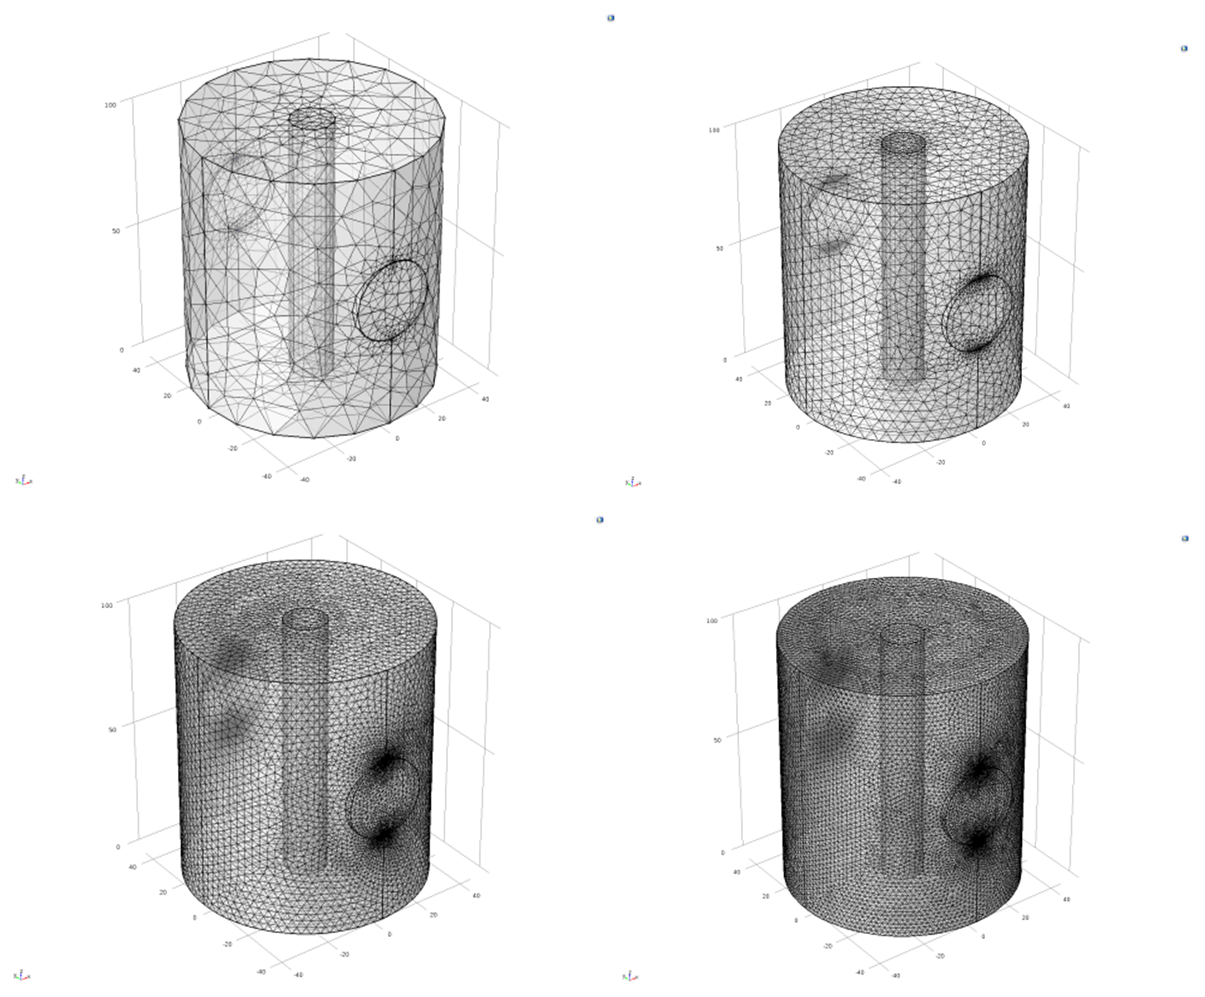 | Figure 3. Different meshes used in this simulation, (a) coarse mesh, (b) normal mesh, (c) fine mesh, and (d) extra fine mesh |
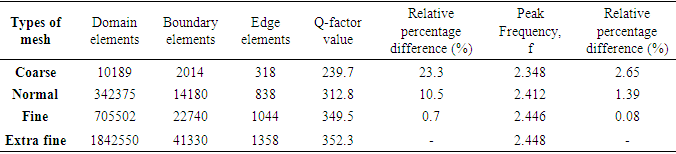
3.2.2. Grid Independence
- The study of grid independence was done by using few grid densities on the model with an empty cavity. The main purpose of conducting grid independence is to optimize the model mesh and total simulation time for a reliable result. The Q-factor for empty cavity was monitored to find the grid independence as shown in Table 3. It can be seen that there was no significant difference in the fine mesh and extra fine mesh with a relative percentage different of 0.07 % for the peak frequency and 0.7% for the Q-factor value. Hence, the fine mesh was used for the simulations.
|
3.3. Material Assignment and Boundary Condition
- The wall was assigned an aluminum material and two ports were placed opposite to each other on both sides of the cavity (for transmission and reception of a signal). Impedance wall boundary was assigned as a perfect conductor to the aluminum wall as resistance to electromagnetic wave and has a perfect reflection within the cavity. The working cooling fluid temperature ranges in industrial was around 25°C. Therefore, the temperature of 298 K (25°C) was maintained within the cavity and measuring samples for this experiments. The samples used in this study were pure water and different concentrations of water hardness. Boundary conditions of the simulation setup are illustrated in Figure 4.
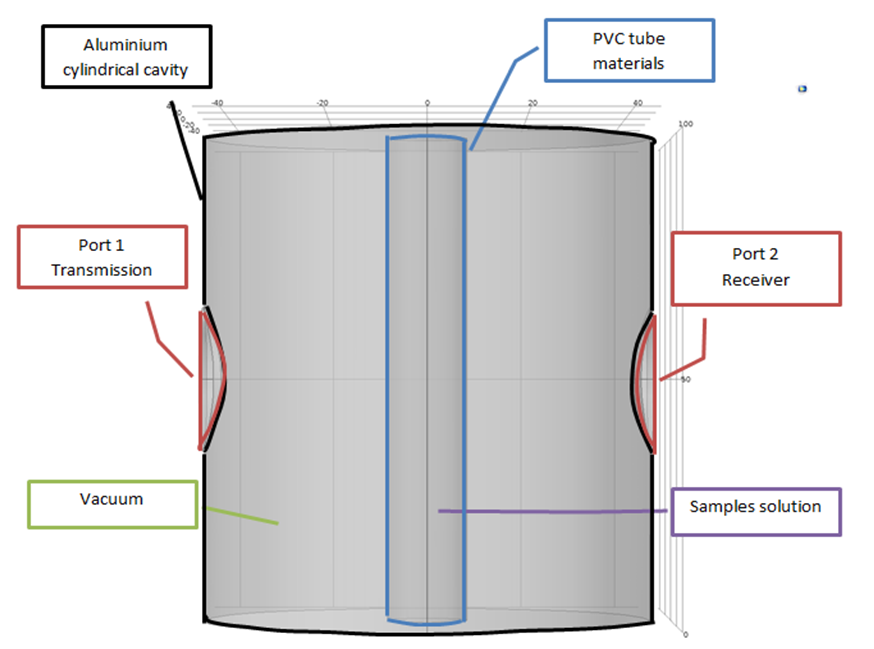 | Figure 4. Boundary conditions for the analysed model |
4. Numerical Procedure
- In order to solve the partial differential equations governing the propagation of electromagnetic field inside a cavity resonator, an RF simulation module in COMSOL Multiphysics was used with user defined properties physical properties of samples. These included properties such as relative permeability, relative permittivity, electric conductivity and temperature. Figure 5 shows the difference of the frequency spectrum between the experimental and simulation measurements. It is clearly demonstrated that the simulated S21 magnitude in empty cavity was relatively larger than the experimental S21 magnitude. This difference could be explained by the way the ports are modelled and the ideal simulation environments in comparison to the experimental measurements where there is a possibility of instrumentation errors during the experiment such as power dissipation in the coaxial cables, vacuum inside the cavity, etc. Based on the amount of difference in the results it can be concluded that the simulated and experimental measurements are comparable in terms of their accuracy when an electromagnetic wave is propagated inside the designed cavity.
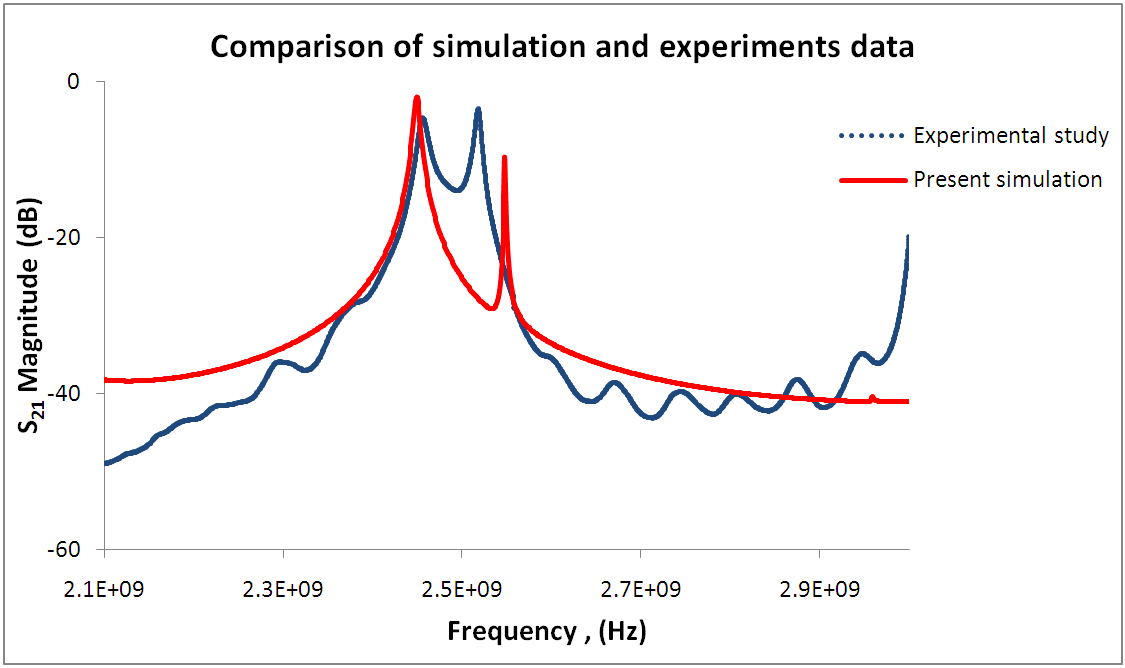 | Figure 5. Comparison of simulated frequency spectrum data with experimental frequency spectrum data |
5. Results and Discussion
5.1. Eigenfrequency Analysis of Cylindrical Cavity Resonator
- COMSOL simulation package was used to analyze the eigenfrequency inside the cavity resonator and its associated mode for the input frequency. The microwave cavity resonator was designed such that its fundamental mode of operation (i.e. TM010) occurs at approximately 2.5GHz. Fundamental mode enables the propagation of the wave strongly across the sample and yields a sensitive measurement of samples. This mode will generate a resonant peak with a quality factor (Q). A high Q indicates a sharp resonant peak that will be more readily analysed and improve the accuracy of the sensor. Table 4 shows the modes formed inside the cylindrical cavity and each mode’s resonant frequency (in the range of 1GHz–11 GHz approximately). These results show the homogeneous waveguide that transmits an electromagnetic wave from an input port to the output port (receiver port) at different frequencies and results a different mode. The indicated frequency and the modes formed inside the cavity could be a good starting point to design a cylindrical cavity waveguide for a desired engineering application.
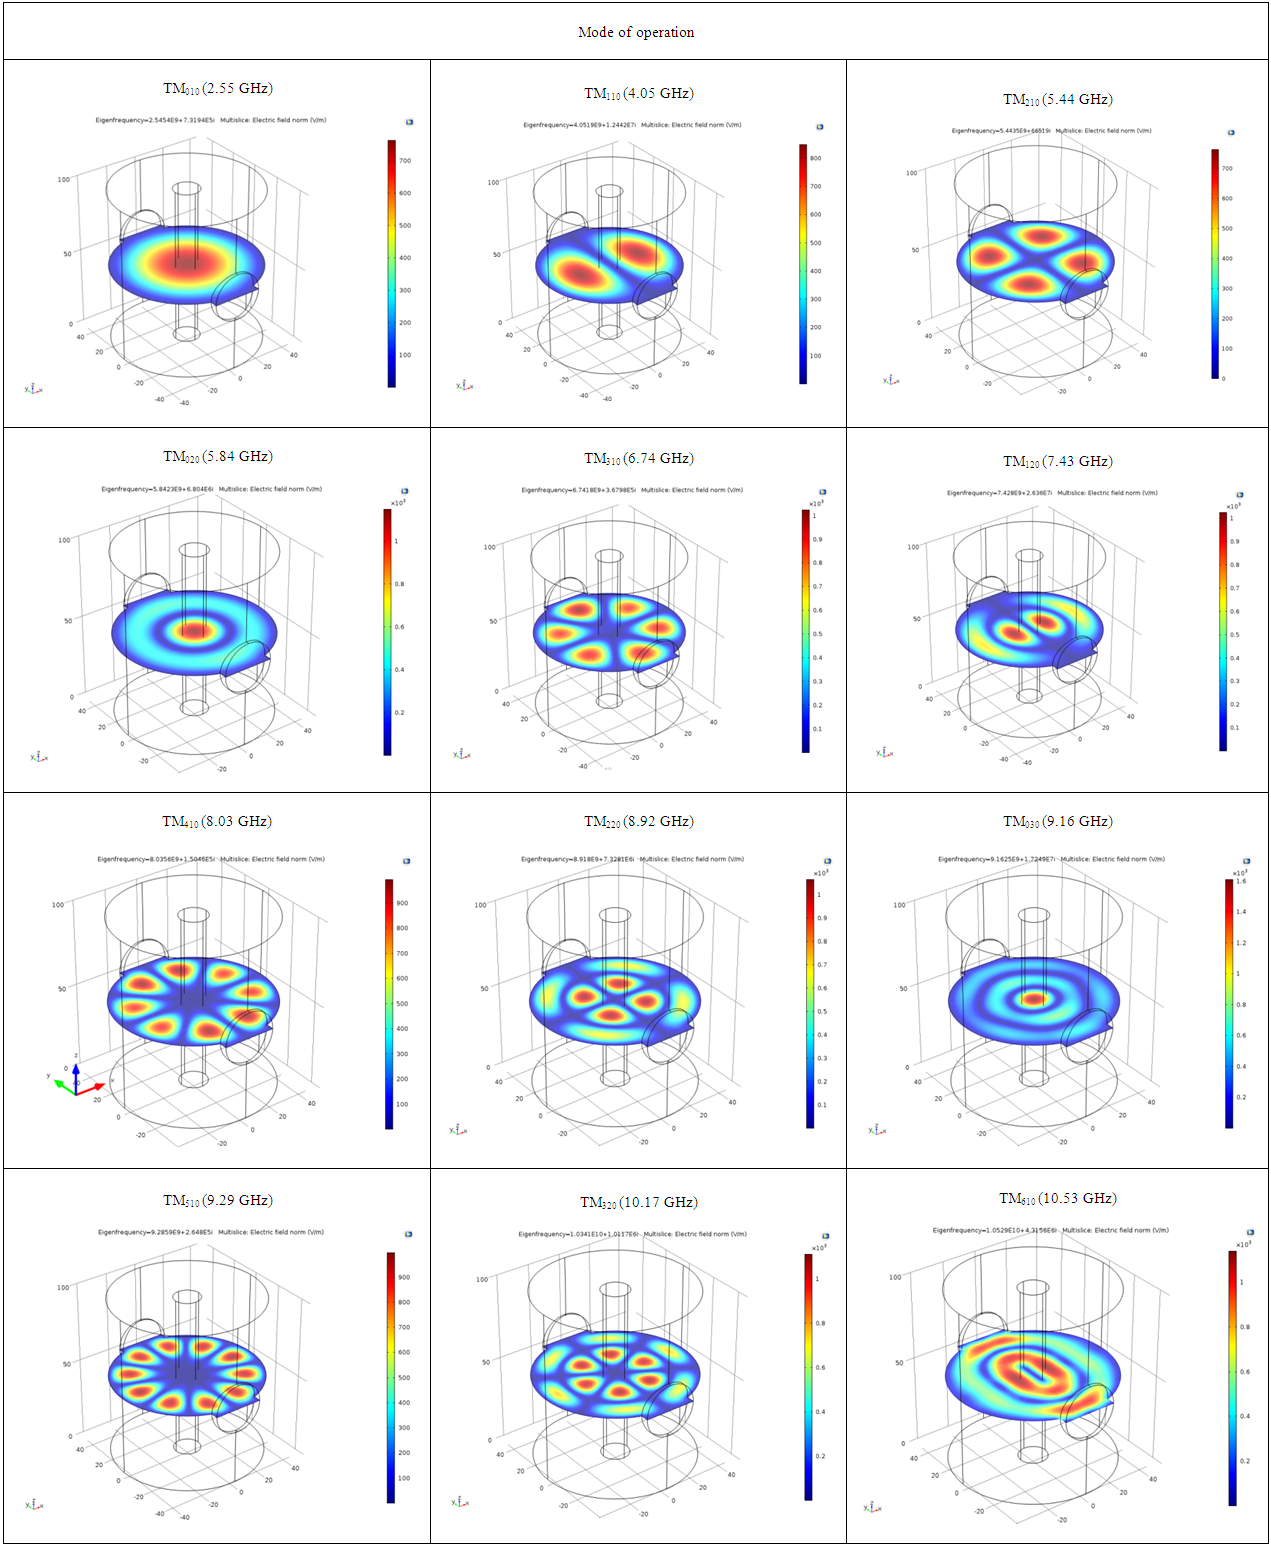 | Table 4. Modes formed in the cylindrical cavity and their associated eigenfrequencies |
5.2. Effect of the Water Hardness on the Signal Spectrum
- Figure 6 shows the effect of the concentration of calcium hardness on the S21 output signal where an input microwave power of 1mW rms (0 dBm) and the frequency range of 2.2–2.8 GHz was used. The results present a clear distinction in the amplitude of the signals with change in the sample hardness concentration. The amplitude of the spectrum for the higher concentration samples yields relatively a larger magnitude in comparison to the lower concentration. The observed phenomena can be explained as the result of the increased activity of soluble ionic compounds in the solution. The atoms absorb the EM wave and perturbs it [37]. As a result, combination of higher quantity of different states atom will settle into an excited state with higher energy state. Hence, a higher absorption of energy in higher concentration solution was observed as shown in Figure 6.
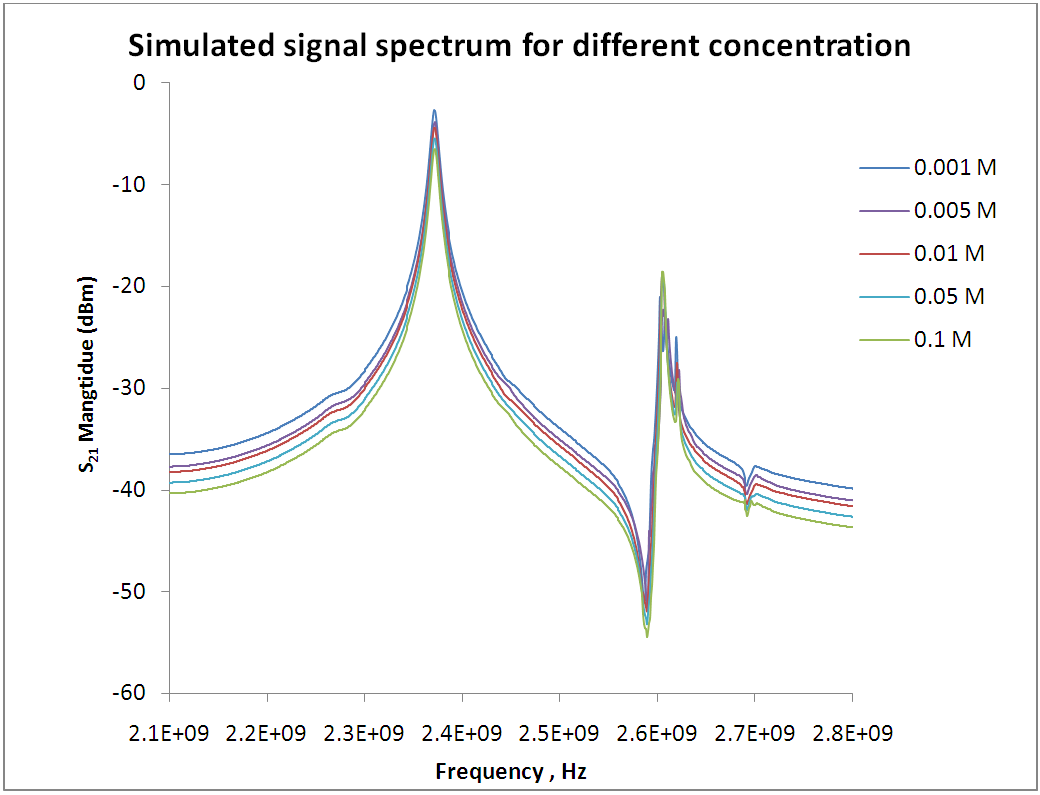 | Figure 6. S21 spectrum analysis for different hardness concentrations in the solution |
5.3. Effect of Water Hardness Concentrations on the Signal Magnitude
- Figure 7 shows the simulated and experimental results for the amplitude changes caused by different hardness concentrations in the solution. The simulated results demonstrate R-square values with respect to the change in the concentrations. It shows a good linear regression for the change in the hardness concentration in the solution. In addition, the experimental results show less than 5% error when compared to the simulated results. These results demonstrate reliability of the simulation package to carry out Microwave based design activities & research. Overall, simulated results shown are relative higher than experimental results, it is believe the ideal condition which including the power input, power loss, vacuum condition and ideal impendence condition resulting a slightly different of the experimental results and simulation results.
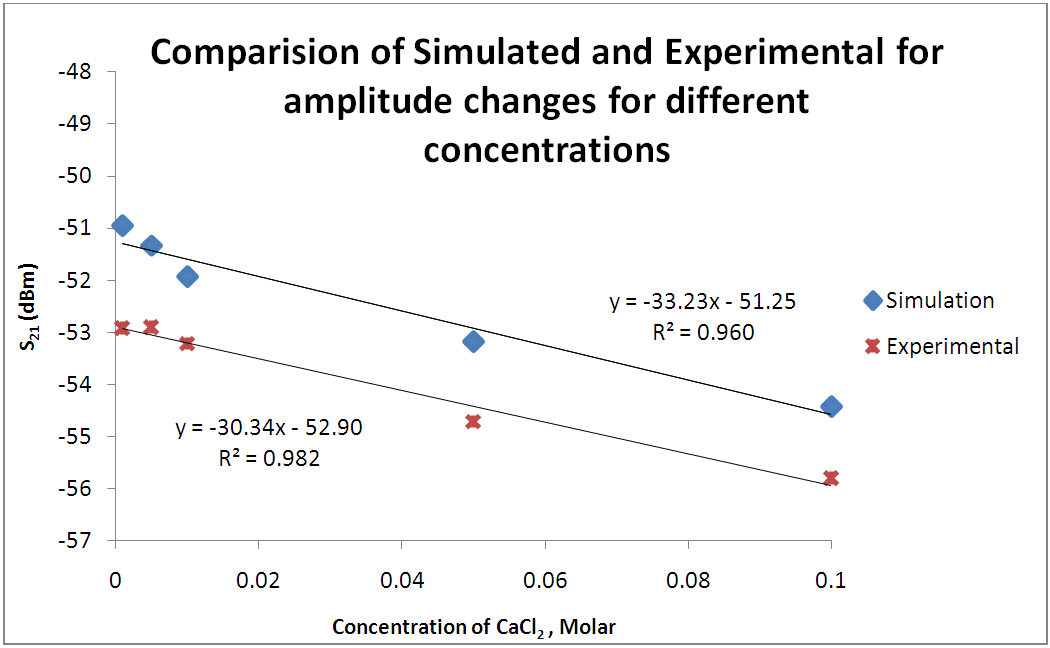 | Figure 7. Comparison amplitude changes of simulated and experimental results under effect of different concentration of CaCl2 |
6. Conclusions
- A numerical investigation on the eigenfrequency and different water hardness concentration were successfully performed. A range of frequency from 2.2 GHz to 2.8GHz with 4000 data points and 5 different calcium concentrations were considered in this numerical study. COMSOL Multiphysics simulation packages, RF module functions based on a finite element method and Maxwell equations model was used for simulations. The simulations setup was benchmarked against conducted experimental results. The simulated data have been evaluated and the results indicated close resemblances to the experimental results.Fundamental mode of operation, TM010, was successful modeled at the frequency of around 2.5 GHz. This fundamental mode enables the wave propagation across the sample in the middle of the cavity and yields a sensitive measurement of samples which validate the experimental results. On the other hand, the spectrum results show a good linear regression for different calcium concentrations. In conclusion, COMSOL Multiphysics simulation package is efficient and reliable to simulate an EM wave model for the prediction of chemical compound across range of industries.
Funding
- The authors gratefully acknowledge Liverpool John Moores University’s Radio frequency & Microwave (RFM) Group for providing the designed cavity resonator for this experiment, Liverpool John Moores University, United Kingdom, UMRG Grant RP012A-13AET, University Malaya Postgraduate Research Fund (PPP) (e.g. PG109-2015A) and University of Malaya, Malaysia for support to conduct this research work.