-
Paper Information
- Next Paper
- Previous Paper
- Paper Submission
-
Journal Information
- About This Journal
- Editorial Board
- Current Issue
- Archive
- Author Guidelines
- Contact Us
International Journal of Electromagnetics and Applications
p-ISSN: 2168-5037 e-ISSN: 2168-5045
2012; 2(5): 85-104
doi: 10.5923/j.ijea.20120205.02
Estimation of Complex and Linear Uncertainities in S-Parameter Measurements for Metrology Applications
 Abstract
 Reference
 Full-Text PDF
 Full-Text HTML
1Amorphous and Microcrystalline Silicon Solar Cells, CSIR-National Physical Laboratory, New Delhi, 110012, India
2Electrical Standards, CSIR-National Physical Laboratory, New Delhi, 110012, India
Correspondence to: Kamlesh Patel , Amorphous and Microcrystalline Silicon Solar Cells, CSIR-National Physical Laboratory, New Delhi, 110012, India.
| Email: |  |
Copyright © 2012 Scientific & Academic Publishing. All Rights Reserved.
The present paper aims to develop a uniform procedure of estimating uncertainty components in VNA measurements whether in complex or linear units. The individual response of each uncertainty components have been studied in the frequency range 1 to 18 GHz, which are applicable for one-port and two-port measurements. The Vector network analyser (VNA) measurements are performed to assign an overall uncertainty for the respective measuring parameter in terms of complex and linear units for coaxial step attenuator, fixed attenuator and mismatch. These measurements are then verified through the primary and transfer standards of the attenuation and impedance parameters and thus the traceability of the VNA measurements is established. Finally, the outcome of complete study has been presented as VNA measurements based new calibration and measurement capabilities (CMCs) for NPL, India. It has shown that the final combined uncertainty is found same or nearby by obtaining from uncertainty components either in complex or in linear units. Thus, this paper reports the estimation of VNA measurement uncertainties for various parameters as per the requirements of ISO/IEC 17025:2005 standard.
Keywords: Complex S-Parameter, Attenuation, Impedance, Traceability, Calibration Standards, VNA
Article Outline
1. Introduction
- Today, the broadband measurement of microwave parameters is carried out in terms of complex S-parameters using a vector network analyzer (VNA) at radio and microwave frequencies. A VNA characterizes the behaviour of linear networks quickly, accurately, and completely over broad frequency ranges by measuring its transmission and reflection coefficients in terms of scattering parameters or S-parameters of the device-under-test (DUT). From the measured S-parameters which can be represented by a number of different measurement parameters and units, one can easily deduce a number of microwave parameters in any of form as given in Table1. However, the magnitude and phase components are required for the complete characterization of a linear network and thus one can able to ensure a distortion-free transmission through the network at RF and microwave range. The complex number or vector format is most accurate as it deals with the phases, however a linear format for reflection coefficient or VSWR is required in the reflection measurements. As a range of measuring parameters are expressed in various units, the associated uncertainty should also be evaluate and expressed in the same unit to estimate more reliable uncertainty.A complete VNA system consists of VNA, calibrationand verification kits along with cables and adaptors. The VNA is calibrated against a set of known standards to minimize the measurement uncertainties, which also called the “vector error correction” process[1-4]. In the last few decades, a number of calibration techniques have been realized and implemented to calibrate VNA namely Short-Open-Load-Thru (SOLT), Thru- Reflect- Line (TRL), Thru- Short- Delay (TSD), Line- Reflect- Line (LRL), OSLT (Offset Short -Load -Thru) etc.[5-10]. The impact of each standard’s uncertainty depends on the calibration technique used, stability and repeatability of the system and residual post calibration errors. The quality of calibration also depends on operator experience and random effects such as system sensitivity limits, noise, connector repeatability, etc. The influences of the non-ideal calibration standards on the complex S-parameters measurement in the real/imaginary and magnitude/phase formats and sensitivity coefficients for various calibration techniques have been analyzed and on their uncertainties have been studied[11-14]. In the previous studies, the SOLT and TRL calibration techniques are emerged the best for accurate, most reliable and traceable measurements in general. For calibration laboratories, the use of this versatile system for metrology purpose needs special attention as per requirements of ISO/IEC 17025:2005. The international and national calibration labs have established and still improving the methods of VNA uncertainty estimation and establishing traceability. However, a uniform and widely acceptable realization of such methods has to be implemented in the national laboratories to compare the measurement compatibility more perfectly. In India, VNAs are being utilized as a calibration set up in many government and industrial laboratories for the range of 10 MHz to 20 GHz and installation of 40 GHz VNA is under process at many places. Being a National metrology Institute (NMI) of India, NPL has started the work to establish the traceability of VNA measurements as well as to traceable calibration facility for VNA system using the primary and transfer standards[15-16]. There is still a large gap between NMI and other level-II laboratories in evaluation of uncertainty in VNA measurements and establishing its traceability in accordance with ISO/IEC 17025:2005. For bridging this gap, this paper presents the steps and methods for the utilization of VNA system to calibrate of one-port and two-port components and in the metrology applications. The individual uncertainty components are estimated and evaluated in complex and linear formats as that of measurand. The possibility of getting the same uncertainty value will also be explored, while estimating the uncertainties using various forms for the single measurement value.
2. Uncertainty Contributors in VNA Measurements
- The basic details and importance of major uncertainty components applicable for VNA measurements have been studied earlier[17-22]. A number of uncertainty models have been developed to estimate the VNA measurement uncertainty and to establish its traceability[23-27]. Generally, the uncertainty contributors can be categorized in three types for VNA measurements, namely systematic, random and drift errors. The directivity, test port match (or source match for two-port), load match, isolation (or RF leakage), frequency tracking are the systematic error contributors. Such contributors can be effectively removed by perfect calibration of VNA to obtain a correct value. However, due to imperfections of calibration standards, these error contributors are considered as residual systematic errors for Type-B. In the second category, random contributors consist of system repeatability (resolution and noise), connector repeatability (Type A to cover gaps at the connector interface, slots in female connector) etc. Drifts due to signal source (frequency and power stability), instrument (any physical changes between calibration and measurement states), temperature, cable flexure etc. are belong to the drift error contributors. Some of these terms can be minimized by careful control and use of system and calibration kits. Error due to temperature drift can be reduced significantly in a stable and controlled environment.We have adopted the uncertainty expressions and methodology given in the references[27-28] have been adopted due to their easier implementation and well suited according to ISO standards and guidelines[29-32]. In the present study, frequency range 1 to 18 GHz is divided in three sub-ranges 1-8 GHz, 8-12 GHz and 12-18 GHz for to evaluate contributors. The measurements are performed for Type N connectors by making Port 1 male and Port 2 female for VNA Wiltron 37247B using full-port SOLT technique.For uncertainty conversion form logarithmic value to linear value and vice versa for any measured S-parameter, the following expressions were used,
 | (1) |
 | (2) |
2.1. Evaluation of Systematic Error Contributors
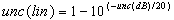
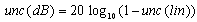
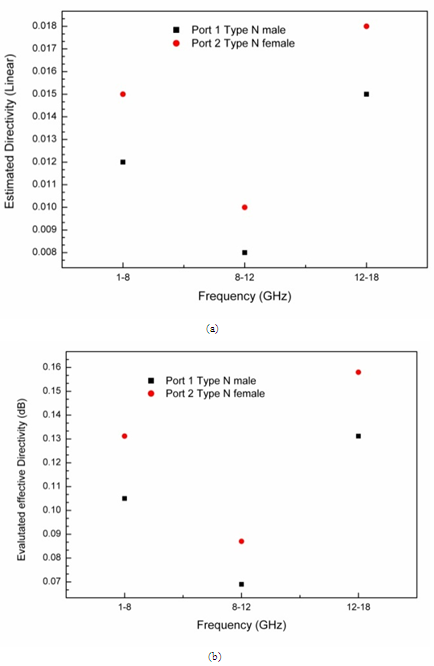
- To evaluate the effective directivity, test port match (or source match) and load match, the methods given in the references[27-28]. The evaluation of these three quantities utilizes the airline and calibration kit components and thus propagates the uncertainties of these standards to the measurements in the uncertainty budgets. The formula for evaluating the effective directivity in linear magnitude is given below,
 | (3) |
 | (4) |
 | Figure 1. Evaluated effective directivity (a) in linear format, (b) in log format |
 | Figure 2. Evaluated effective test port match (or source match) (a) in linear format, (b) in log format |
 | (5) |
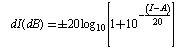
 | Figure 3. Evaluated effective load match (a) in linear format, (b) in log format |
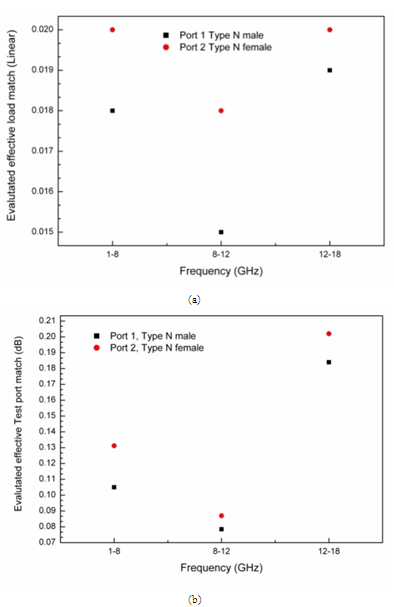
 | Figure 4. Estimated tracking (a) in linear format, (b) in log format |
2.2. Mismatch
- The expressions given in this section are briefly describe and evaluated earlier for the attenuation measurement systems in accordance to the fixed and variable attenuators[32-35]. Here the expressions are written again in context of VNA.
2.2.1. Mismatch Uncertainty Calculation for a Fixed Attenuator
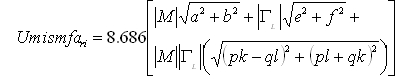
- Now if we consider, M: Effective Test port match or Effective Source matchΓL: Effective load matchS11, S12, S21, S22: Scattering coefficients of the attenuator (at the attenuation level)S’11, S’12, S’21, and S’22: Scattering coefficients of the two-port device at the initial state ‘0’ dB (applicable for step attenuator)If S11, S22, M and ΓL are extremely small i.e. <<1, in dB, mismatch uncertainty can be estimated using (6) in dB,
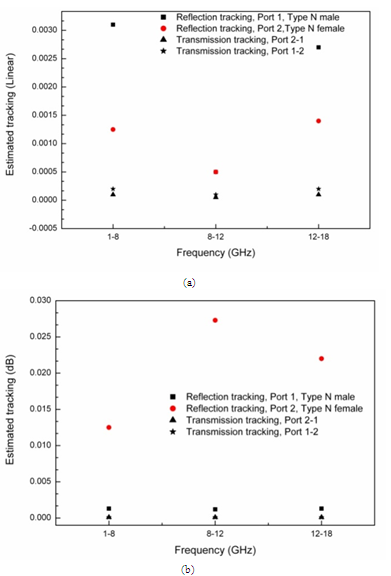
 | Figure 5. Estimated effective isolation (a) in linear format, (b) in log format |
 | (6) |
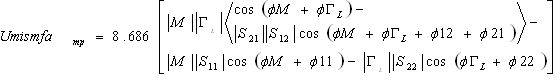 | (7) |
 | (8) |
2.2.2. Mismatch Uncertainty Calculation for Incremental Attenuation I.E. A Step Attenuator
- If S11, S22, M and ΓL are extremely small i.e. <<1, in dB
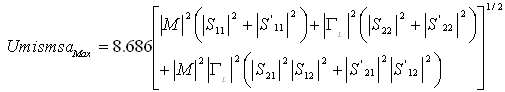 | (9) |
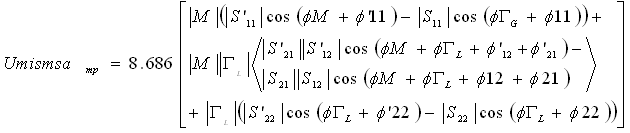 | (10) |
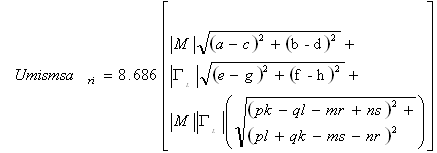 | (11) |
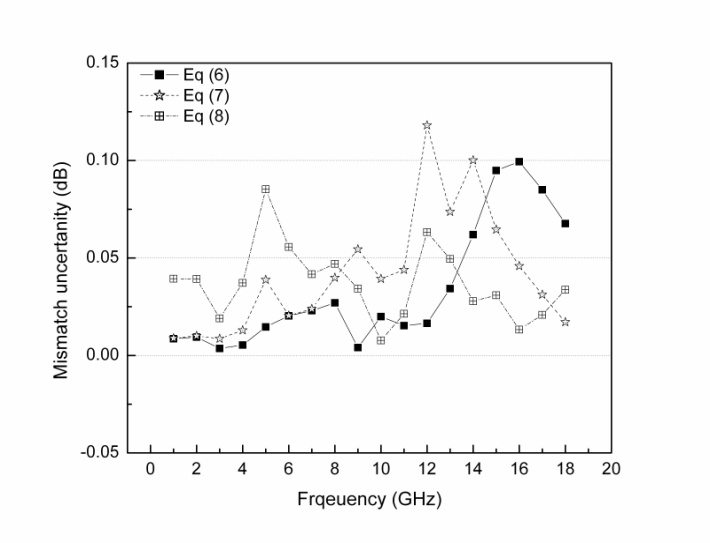 | Figure 6. Calculated mismatch uncertainty of a 50 dB attenuator |
 | Figure 7. Estimated reflection linearity (a) in linear format, (b) in log format |
 | Figure 8. Estimated transmission linearity (a) in linear format, (b) in log format |
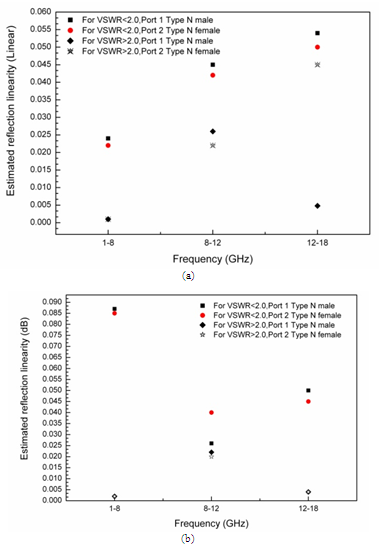
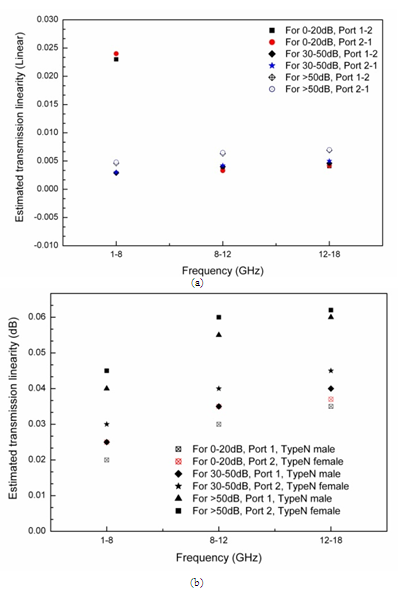
2.3. Effective Linearity
- The evaluation and inclusion of linearity in uncertainty budgets for one-port and two-port measurements, is the link to establish traceability to national standards of measuring parameters. Thus for evaluating linearity in transmission and reflection measurements, a step attenuator Agilent 8496B calibrated against the signal and attenuation calibrator model VM-7 and a mismatch set 2562L of Maury Microwave in Type-N connector calibrated against coaxial airline standard Anritsu 18N50-10 have been used, respectively. These linear contributions are shown in Figure 7(a-b) and Figure 8(a-b) for various ranges of reflection and transmission values separately. In Figure 7 (a-b), it has been noticed that the reflection linearity depends of type of connector used and the value of VSWR. Except for VSWR>2.0 at Type N female, the uncertainty contribution is increasing with frequency.Transmission linearity in linear values is having almost constant values except for lower attenuation ranges and independent of the direction of signal as shown in Figure 8 (a), whereas this uncertainty contribution is increasing with the applied frequency and attenuation range in dB given in Figure 8 (b).
2.4. Evaluation of Random Error Contributors
- The system repeatability has been estimated by the root square sum of two standard deviations for repeatability measurements, the standard deviation of 5 times measurements on the same calibration and the standard deviation of 5 times measurements after recalibrations and shown in Figure 9 (a) and (b). Separate assessment of connector repeatability is not performed in our case considering the same approach would be applied during the assessment of repeatability (type A contribution) using DUT for an individual parameter[27-28].
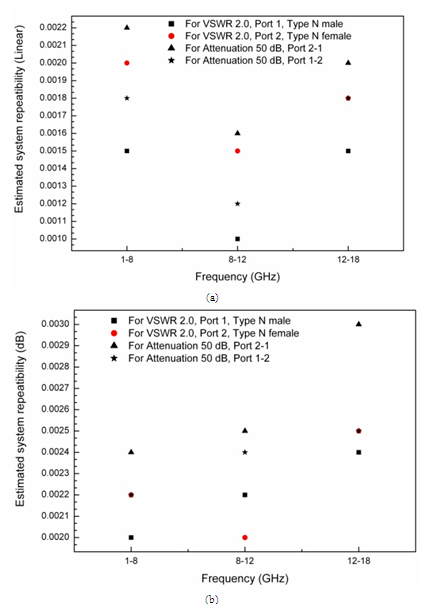 | Figure 9. Estimated system repeatability (a) in linear format, (b) in log format |
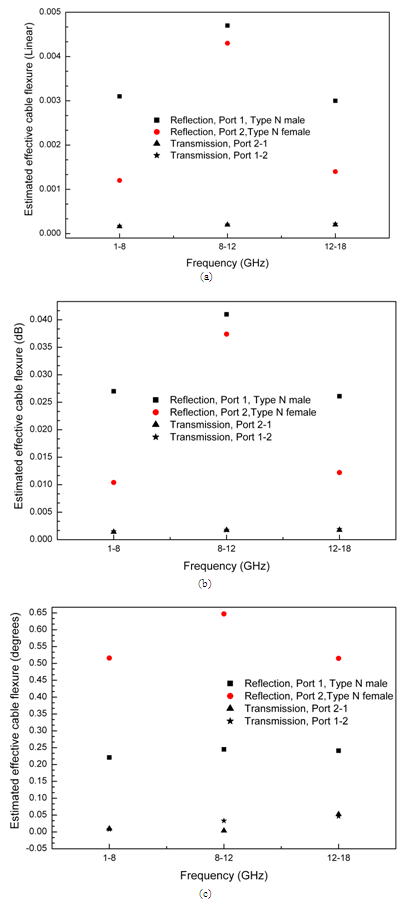 | Figure 10. Estimated effective cable flexure (a) in linear format, (b) in log format, and (c) in degrees |
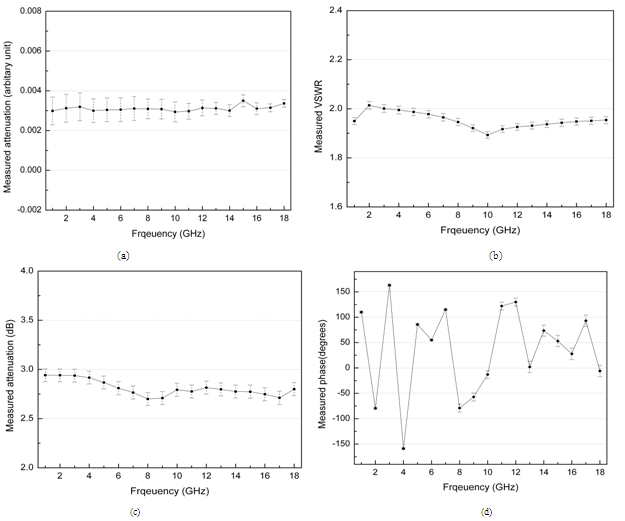 | Figure 11. Measurement results with estimated uncertainties (a) VSWR of coaxial mismatch, (b) Measured attenuation in linear magnitudes of 50 dB attenuator, (c) Measured attenuation in log magnitudes of 3 dB attenuator, and (d) Measured S21 phase values of 3 dB attenuator |
- The cable flexure contribution has a greater importance for phase measurements as signal phase changes along the cable for different frequencies i.e. two times for reflection measurements, and longer time for transmission measurements. For transmission phase, the root sums of squares for cable flexure uncertainties of reflection phases at both ports have taken into account for an estimate. As shown in Figure 10 (a), (b) and (c), the uncertainty due to cable flexure has similar response for reflection and transmission measurements, respectively, irespective of units.
3. Complex S-Parameters Measurement and Its Verification
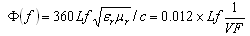
- After the evaluation of the uncertainty components of uncertainty as described in the previous sections, the associated uncertainties of various parameters are estimated as per GUM document. The uncertainty estimation of reflection and transmission magnitude in linear and logarithmic formats is performed using the model equations given in the reference[27], whereas the uncertainty in the reflection and transmission phases are estimated based on the references[16] and [25]. We calibrated two-port VNA Wiltron 37247B for SOLT calibration using Anritsu coaxial calibration kit 3653 in Type- N connector. For verification purpose, the DUTs were chosen Maury Microwave mismatch of VSWR 2.0, a Weinschel fixed attenuator 3 dB and Agilent step attenuator for 50 dB attenuation in 1 to 18 GHz range. Some of the results along with the uncertainties are presented in Figure 11(a-d). Model uncertainty budgets for few parameters are given in Appendix A for a frequency 2 GHz.The verification kit has been used to experimentally validate the VNA measurements and establishing the traceability of these measurements. The S11 and S22 of the airline were measured at port 1 and 2 of the calibrated VNA compared to the theoretically calculated values along with skin depth correction to check their closeness against the estimated uncertainty of the reflection coefficient (or Z0)[36]. The phase shift (in degree) introduced by a coaxial airline is calculated to estimate the standard contribution in phase using the equation (17)[27],
 | (12) |
4. Conclusions
- New calibration and measurement capabilities (CMC) in the frequency range 1 to 18 GHz by VNA system are realized and summarized in Table 2.The present work reports the establishment of the following calibration expertise at NPL, India in accordance to ISO/IEC 17025: a) Traceable calibration and uncertainty estimation of the lab’s VNA system (WILTRON 37247B) and its transmission and reflection measurements.b) Traceable calibration and uncertainty estimation of the user’s VNA system along with its calibration kits for regional and other calibration laboratories.c) Traceable calibration and uncertainty estimation of the user’s individual calibration kits and their components against the national standards of attenuation and impedance through VNA measurements.It has also verified that the final combined uncertainty is estimated the same or almost close by obtaining two practices for same measurement parameter, set-up and constant environment conditions, One practice is to estimate the most valid combined uncertainty from the individual uncertainty components evaluated in same terms as of the measurement parameters, and second, the total combined uncertainty have achieved from one format to another using handy formulas like VSWR and reflection coefficient or linear to logarithmic (dB) conversion formula etc. Thus, the present paper provides the descriptive solutions for estimation of uncertainties and traceable VNA measurements in vector and linear formats at one place for the RF metrologists.
|
ACKNOWLEDGEMENTS
- The authors gracefully acknowledge the contributions and efforts made by many great people in the field of microwave measurements and VNA developments. The authors are grateful to Director, NPL for his keen interest. The present work has been carried out under the project NWP-45 supported by CSIR, India.
Appendix A: Detail uncertainty budgets
- To estimate uncertainty of the S-parameters for their different forms, various uncertainty budgets have been prepared as examples for understanding of the reader.A.1. One-port uncertainty budgetsDevice under calibration: Coaxial mismatchRange: VSWR 2.0, DC to 18 GHzMeasurement frequency: 2 GHzUncertainty estimation for one –port component are given in Table–A1.1, Table–A1.2 and Table– A1.3 for VSWR, Reflection coefficient magnitude (linear) and Reflection coefficient phase (degrees) respectively.
| |||||||||||||||||||||||||||||||||||||||||||||||||||||||||||||||||||||||||||||||||||||||||||||||||||||||||||||||
| ||||||||||||||||||||||||||||||||||||||||||||||||||||||||||||||||||||||||||||||||||||||||||||||||||||||||||||||||||
| |||||||||||||||||||||||||||||||||||||||||||||||||||||||||||||||||||||||||||||||||||||||||||||||||||||||||||
| ||||||||||||||||||||||||||||||||||||||||||||||||||||||||||||||||||||||||||||||||||||||
| ||||||||||||||||||||||||||||||||||||||||||||||||||||||||||||||||||||||||||||||||||||||||||||||||
| ||||||||||||||||||||||||||||||||||||||||||||||||||||||||||||||||||||||||||||||||||||||||||||||||||||||||||||||||||||||||||||||||||||||||||||||||||||||||||||
| |||||||||||||||||||||||||||||||||||||||||||||||||||||||||||||||||||||||||||||||||||||||||||||||||||||||||||||||||||||||||||
| ||||||||||||||||||||||||||||||||||||||||||||||||||||||||||||||||||||||||||||||||||||||||||||||||||||||||||||||||||||||||||
References
| [1] | Doug Rytting, “An analysis of Vector measurement accuracy enhancement techniques”, in Proceedings of Hewlett Packard RF and Microwave Symposium, 1980. |
| [2] | Arlie E. Bailey, Microwave measurements, 2nd ed., IEE publication, U.K., 1989. |
| [3] | Geoff H. Bryant, Principles of microwave measurements, Peter Peregrinus Ltd., U.K., 1988. |
| [4] | Operation Manual, Vector Network Analyser Model 37247-B, P/N 10410-00180, Rev. B, Wiltron Co., USA, C-12, 1996. |
| [5] | R. A. Hackborn, “An automatic network analyzer system”, Microwave Journal, 11, 45-52, 1968. |
| [6] | G. F. Engen C. A. Hoer., “Thru-reflect-line: An improved technique for calibrating the dual six-port automatic network analyzer”, IEEE Trans. Microwave Theory Tech., 27, 987-993, 1979. |
| [7] | R. B. Marks, “A multiline method of Network analyzer calibration”, IEEE Trans. Microwave Theory Tech., 39, 1205-1215, 1991. |
| [8] | Application note 5A-01, LRL calibration of Vector network analyzers, Maury Microwave Corporation, 1999. |
| [9] | J. L. Hyh, S. Tenney, K. Wng, “Choosing an appropriate calibration technique for vector network analysis”, Agilent Measurement Journal, 4, 38-45, 2008. |
| [10] | A. Rumiantsev, Nick Ridler, “VNA calibration” IEEE Microwave magazine, 86. 86-99, 2008. |
| [11] | Ulrich Stumper, “Influence of TMSO calibration standards uncertainties on VNA S-parameter measurements”, IEEE Trans. Instru. Meas., 53, 311–315, 2003. |
| [12] | Ulrich Stumper, “Uncertainty of VNA S-parameter measurement due to non-ideal TMSO or LMSO calibration standards”, Adv. Radio Sci., 1, 1–8, 2003. |
| [13] | Ulrich Stumper, “Influence of nonideal LRL or TRL calibration elements on VNA S-parameter measurements”, Adv. Radio Sci. 3, 51–58, 2005. |
| [14] | Ulrich Stumper, “Uncertainty of VNA S-parameter measurement due to non-ideal TRL calibration items”, IEEE Trans. Instru. Meas., 3, 676–679, 2005. |
| [15] | Kamlesh Patel, P. S. Negi, P. C. Kothari, “Complex S-parameter measurement and its uncertainty evaluation on a Vector Network Analyzer”, Measurement, 42, 145-149, 2009. |
| [16] | Ram Swarup, P. S. Negi, R. L. Mendiratta, “Estimation of uncertainty in impedance measurement at narrow and broadband microwave frequencies”, Measurement, 33, 55-66, 2003. |
| [17] | D. Rytting, “Advances in Microwave error correction techniques”, in Proceedings of Hewlett-Packard RF and Microwave Measurement Symposium and Exhibition, 6201-6302, 1987. |
| [18] | Application note 11410-00464. Calculating VNA measurement accuracy, Rev. A, Anritsu, 2008. |
| [19] | Application note 1 EZ29_1E. Measurement uncertainties for Vector network analyzers, R & S, 1998. |
| [20] | N. Nazoa, Nick Ridler, “LA19-13-02 3 GHZ VNA calibration and measurement uncertainty”, Technical note ref. LAP03, LA Techniques Ltd, 2007. |
| [21] | C. F. Matthee, “The determination of the uncertainty associated with measurements performed using a Vector Network analyzer”, in Proceedings of IEEE AFRICON-5th AFRICON Conference in Africa, 1999. |
| [22] | J. Park, S. Pak, J. Moon, C. Park, “Uncertainty estimation of measurement using a Vector network analyzer”, in Proceedings of IEEE TENCON 02, 1093-1096, 2002. |
| [23] | Nick M. Ridler, M. J. Salter, “An approach to the treatment of uncertainty in complex S-parameter measurements”, Metrologia, 39, 295-302, 2005. |
| [24] | R. A. Dudley, Nick M. Ridler, “Traceability via the Internet for microwave measurements using Vector network analyzers”, IEEE Trans. Instru. Meas., 52, 130-134, 2003. |
| [25] | Y. Ji, M. P. J. Daly, T. Zhang, “Verification of vector network analyzers”, MSA 2009, Brisbane, Australia, 2009. |
| [26] | D. Culver, A. Pettai, Y. Lee, “Traceability for Broadband VNA and compatibility study of waveguide (WR-10) and 1 mm coaxial measurements”, 60th ARFTG Conference Fall 2002. 2002. |
| [27] | EA Guidelines on the Evaluation of Vector Network Analyzers (VNA), Publication reference EUROMET/cg-12/v0.1, 2000. |
| [28] | Richard J. Collier, A. Douglas Skinner,, Microwave measurements, 3rd Edition, IET publication, U.K., 2009. |
| [29] | General requirements for the competence of testing and calibration laboratories, ISO/IEC 17025:2005, Geneva, 2005. |
| [30] | Guidelines on the evaluation and expression of the measurement uncertainty, Singapore Institute of Standards and Industrial Research, 1995. |
| [31] | Guide to the expression of uncertainty in measurement, Geneva, International Organization for Standardization, Geneva, 1993. |
| [32] | Expression of the uncertainty of measurement in calibration, Publication reference EA-4/02, 1999. |
| [33] | H. Bayer, “An error analysis for the RF Attenuation measuring equipment of the PTB applying the Power method”, Metrologia, 11, 43-51, 1975. |
| [34] | F. L. Warner, “New expression for mismatch uncertainty when measuring microwave attenuation”, IEE Proc. 127, 66-69, 1980. |
| [35] | I. A. Harris, F. L. Warner, “Re-examination of mismatch uncertainty when measuring microwave power and attenuation”, IEE Proc. 128, 35-42, 1981. |
| [36] | Zorzy, “Skin effect corrections in Admittance and Scattering coefficient standards employing Precision Air-dielectric coaxial lines”, IEEE Trans. of Inst. Meas., 15, 358-364, 1966. |