International Journal of Ecosystem

p-ISSN: 2165-8889    e-ISSN: 2165-8919

2026;  15(1): 14-26

doi:10.5923/j.ije.20261501.02

Received: Jul. 15, 2026; Accepted: Aug. 12, 2026; Published: Aug. 13, 2026


Assessment of Insect Diversity in a Differentially Degraded Savanna Ecosystem

Charles M. Warui

Department of Physical & Biological Sciences, Murang’a University of Technology, Murang’a, Kenya

Correspondence to: Charles M. Warui, Department of Physical & Biological Sciences, Murang’a University of Technology, Murang’a, Kenya.

Email:

Copyright © 2026 The Author(s). Published by Scientific & Academic Publishing.

This work is licensed under the Creative Commons Attribution International License (CC BY).
http://creativecommons.org/licenses/by/4.0/

Abstract

This study was conducted between December 2024 and February 2025 and aimed at using insects as indicators of disturbance in a differentially degraded ecosystem in Laikipia, Central Kenya. Three methods were employed namely pan traps, pitfalls and sweep netting. Thirteen (13) transects were set prior to commencement of the study and cut across four (4) vegetation types/habitats namely degraded, moderately degraded, undegraded (intact) and pristine. Species accumulation curves almost reached reach plateau implying that the sampling effort to establish full species diversity per taxa was fairly inclusive. A total of 131 species were reported and cut across 41 families. The dominant insect species were ants and beetles and where Camponotus flavomarginatus, Camponotus vividus, Tetramorium sp, (Formicidae), Blatella germanica, (Blattodea), Zophosis sulcata, Geophanus pygmae, Coryna apicicornis (Coleoptera) and Macrogalea candida (Hymenoptera). There were significant differences in species richness (F (3, 35) =6.75, p=0.001), abundance (F (3, 35) =2.99, p=0.04) and Shannon–Wienerdiversity index (F (3, 35) = 5.54, p=0.003) for pan trapping samples where undegraded and pristine habitats had significantly higher means than degraded and moderately degraded habitats. However, there were no significant differences in all species diversity parameters for pitfall trapping methods. A t-test to compare species richness for degraded with pristine habitas was also not significant t(6) =1.83, p=0.11. The study recommends restoration of degraded and moderately degraded habitats which translates to Western Boundary/ Plains, Southwest Corner, Fig Tree Rock, Central Gate Forest, Zebra Plains and Eastern Lugga. The study also recommends long term monitoring of forest fires for sustainable restoration efforts.

Keywords: Invertebrates, Indicators, Land use, Habitat quality, Rangelands

Cite this paper: Charles M. Warui, Assessment of Insect Diversity in a Differentially Degraded Savanna Ecosystem, International Journal of Ecosystem, Vol. 15 No. 1, 2026, pp. 14-26. doi: 10.5923/j.ije.20261501.02.

1. Introduction

Savanna Ecosystems cover approximately 20% of the earths service [1] and 65 % of the African continent [2]. They are important in peoples’ livelihoods as they provide diverse benefits [3]; [4]; [5]. Degradation of savanna and grasslands is widely documented [6]; [9] and easily reflected in form of reduced water quality, lower groundwater tables, reduced soil fertility, soil erosion and loss in biodiversity [10]. Consequences of such degradation has already been reported in the greater Mara ecosystem in Kenya [11]. There is an increased need for more land to sustain increasing human population while restoration of the degraded savannah ecosystems can complement this process. As restoration work continues [5]; [6], there is need to continuously monitor the current savanna ecosystems to inform of their status.
Insects play diverse roles in ecosystems including nutrient cycling, soil building, pollination and as part of food chains and food webs [7]; [8]. They are known to be good indicators of environmental quality and have been widely used to monitor ecosystems ([12]; [13]; [14]; [15]; [16]. Interesting patterns have been reported on beetles and ants as indicators of habitat quality in savanna ecosystems [17]; [18]; [19] as well as in desert areas [20]. However, studies indicate that worldwide decline of insects is happening due to diverse threats [21], yet there is little published evidence on the same [22]. The current study proposes to use insect monitoring results to compare diversity in differentially degraded areas in savanna ecosystem in Laikipia, Central Kenya, and propose feasible management strategies to increase insect diversity. The current study area was recently curved out of the larger Lloldaiga Hills Ranch which begun as a sheep farm in 1928 and grew to cattle ranch with diverse livestock regimes. In 2013, the ranch came up with a Community Crisis Grazing Programme (CCP) that allowed neighboring group ranches a drought-relief access to its grasslands for several years [56,57]. This programme continued over several years. The current status of degraded habitat, hence reduced biodiversity, is as a result of many years of increased livestock grazing with limited vegetation regeneration coupled with human disturbances. Further changes in management of the land transitioned the property into a registered wildlife conservancy in 2021 and which is slowly enhancing the regeneration of this ecosystem as evident by past vegetation report [58]. Currently a plan to restore most of this degraded land is underway via Lolldaiga Valley Initiative and justifies the need to use insects as indicators of level of degradation.

2. Materials and Methods

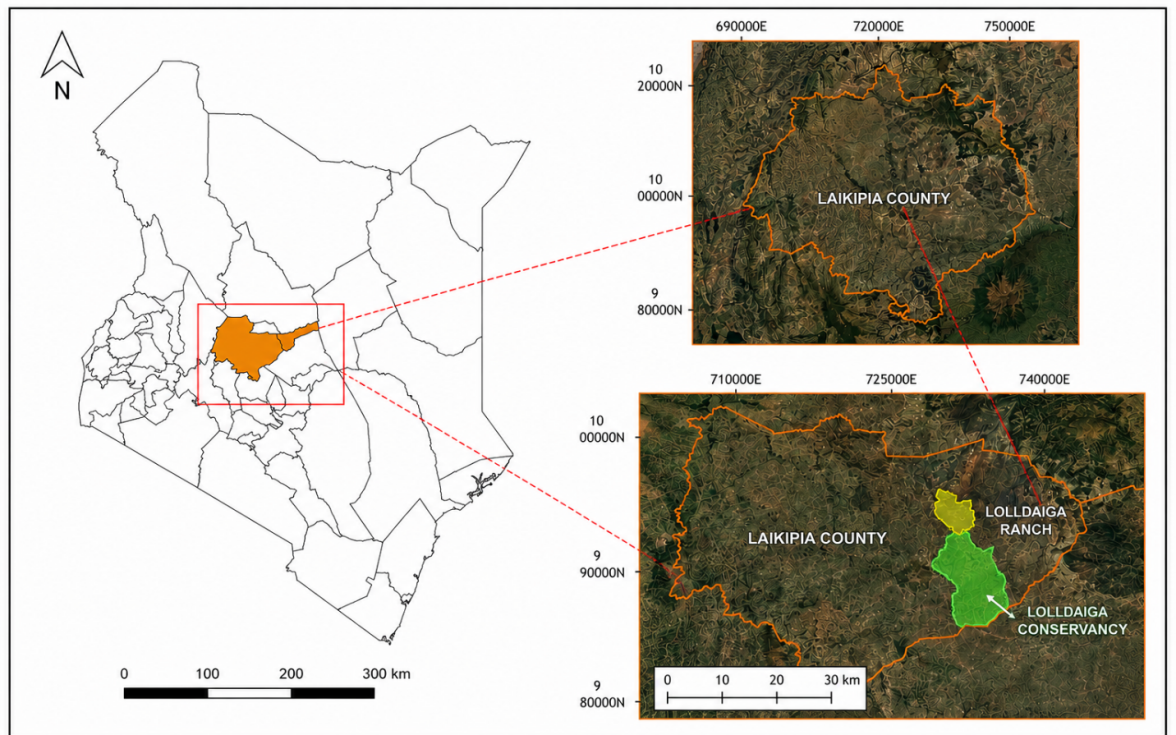
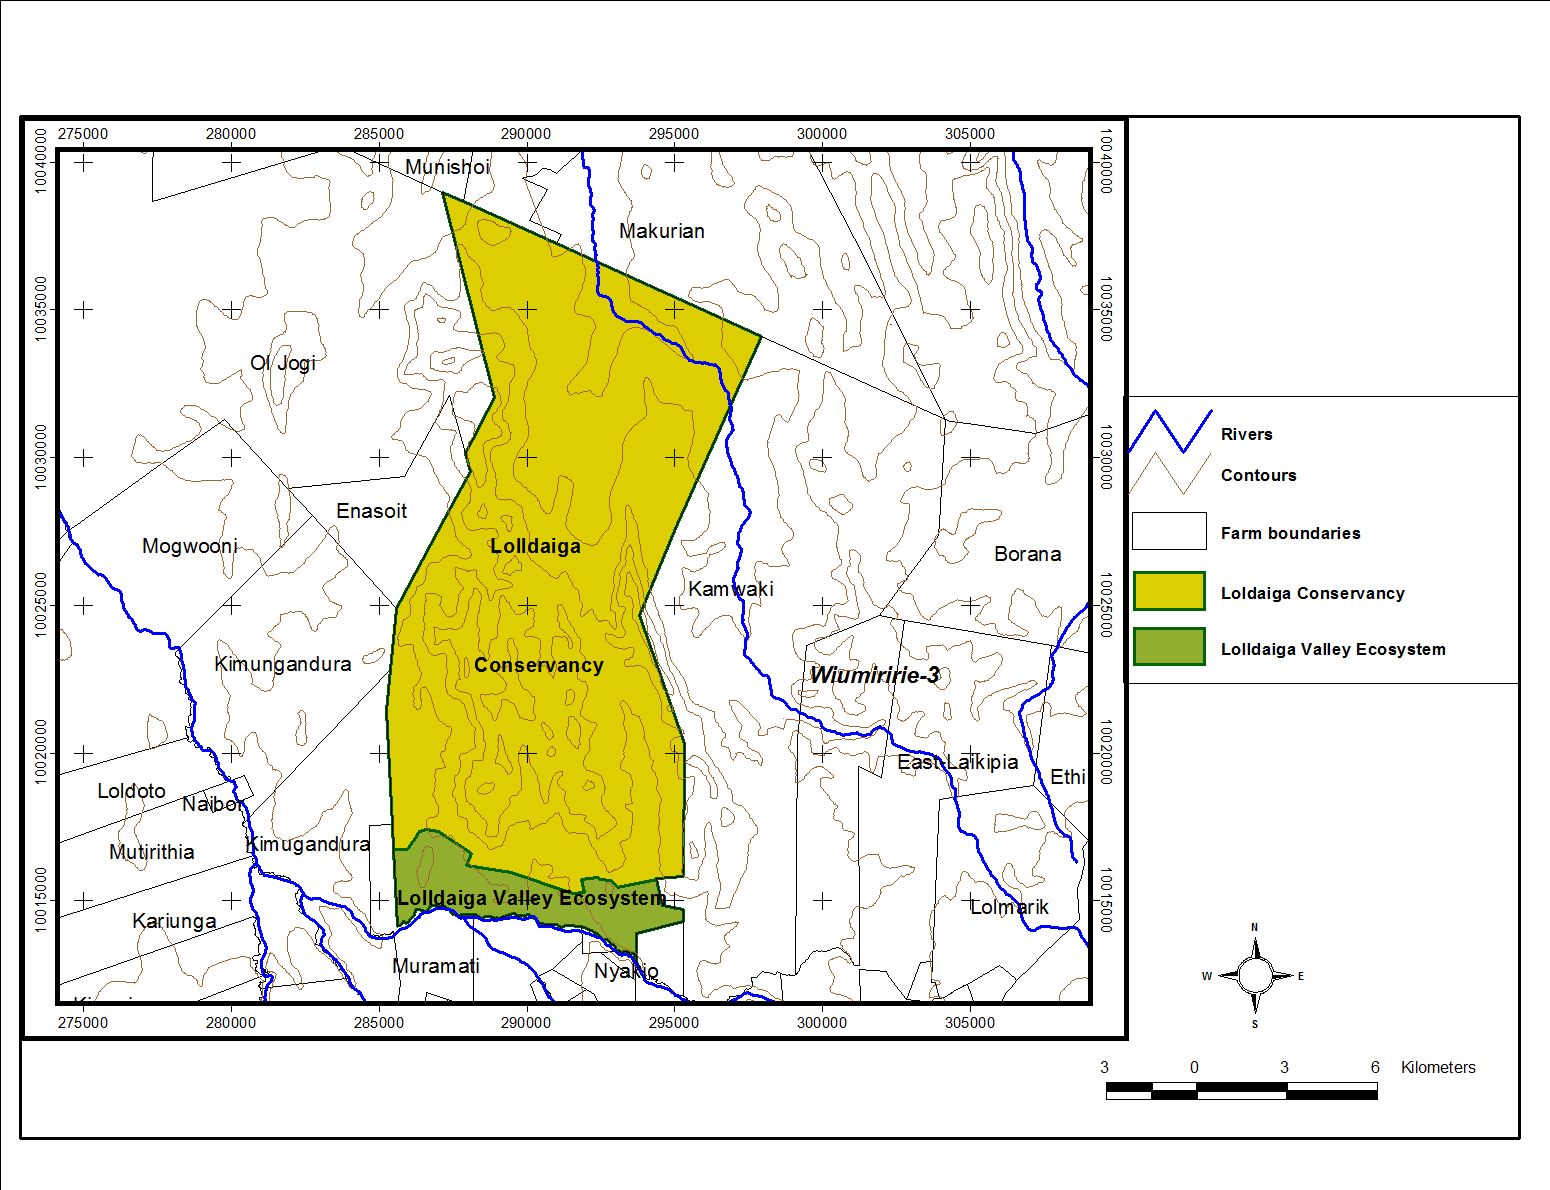
The study was undertaken in Lolldaiga Valley Ecosystem (LVE), located in Laikipia County, Central Kenya, (Figures 1 and 2). LVE experienced degradation due to prolonged grazing pressure and occasional fires [56]. Laikipia ecosystem is known for high diversity of primates and mammals [23]; [24]. The LVE is a heterogenous savannah ecosystem with unique landscapes including expansive Lolldaiga Hills, plains and valleys and is characterized by rich biodiversity in certain locations as demonstrated by recent research ([23]; [25]; [26]. [27].
Figure 1. Lolldaiga Ranch, in Laikipia County, Kenya
Figure 2. Lolldaiga Valley Ecosystem (LVE)

2.1. Study Design

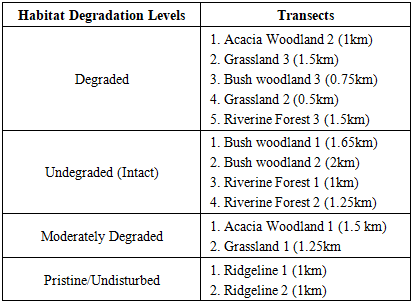
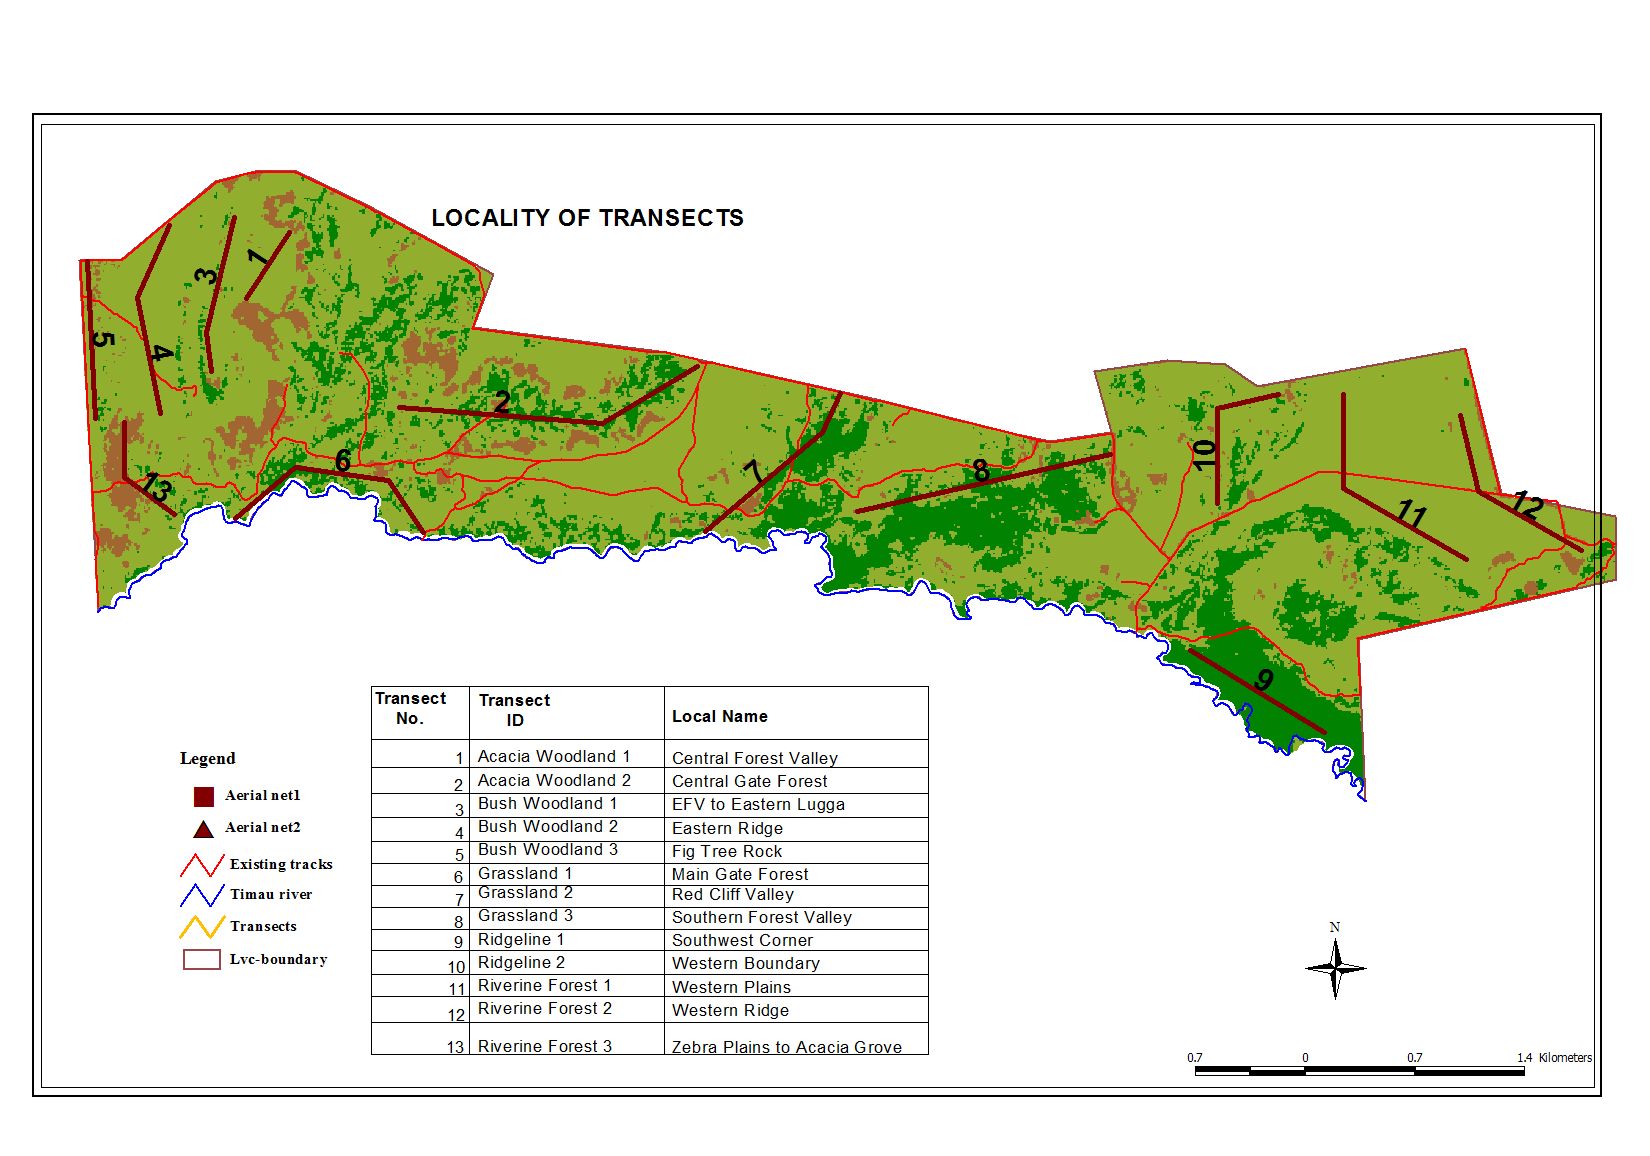
Based on latest aerial photographs, satellite images and ground truthing during reconnaissance survey, the study area was mapped into five main habitats reflecting the level of habitat degradation The five main sub-habitats mapped out were Riverine Forest, Bush woodland, Acacia woodland, Grassland and Ridgeline (Rocky). Following a stratified radomn sampling design, a total of thirteen (13) transects ranging from 500m-2km in length were marked (Figure 3, Table 1). For the purpose of investigating the changes in insect diversity based on habitat quality (Level of degradation), the transects/habitats were further categorized as degraded, undegraded (intact), moderately degraded and pristine (undisturbed), (Table 1), based on reconnaissance survey. A GIS specialist along with the researcher marked the transects. A software [28] was used to locate and track the transects during sampling sessions.
Table 1. Randomly selected study transects and corresponding habitat degradation levels
     
Figure 3. Locality of study transects at Lolldaiga Valley Ecosystem

2.2. Insects Survey Methods

Diverse methods exist to study different groups of insects and in the current study insects were targeted using both active (sweep nets) and passive sampling methods (pan traps and pitfall traps). Although diversifying insects’ collection methods to include other methods like malaise traps [59], D-vac [60] and beet-sheets [61] would increase the sample sizes, the costs of managing the resultant catch volumes would be beyond the scope of this study. Furthermore, studies by [62] clearly illustrated the importance a particular technique for effective evaluation and monitoring of diverse insect species and at different life stages within a species. Where applicable, Lepidopterans only were identified in the field through use of available field guides [29], [30]. However, for most of the insect species, further processing and identification was carried out in the lab using microscopes and other available taxonomic resources.
Pan traps
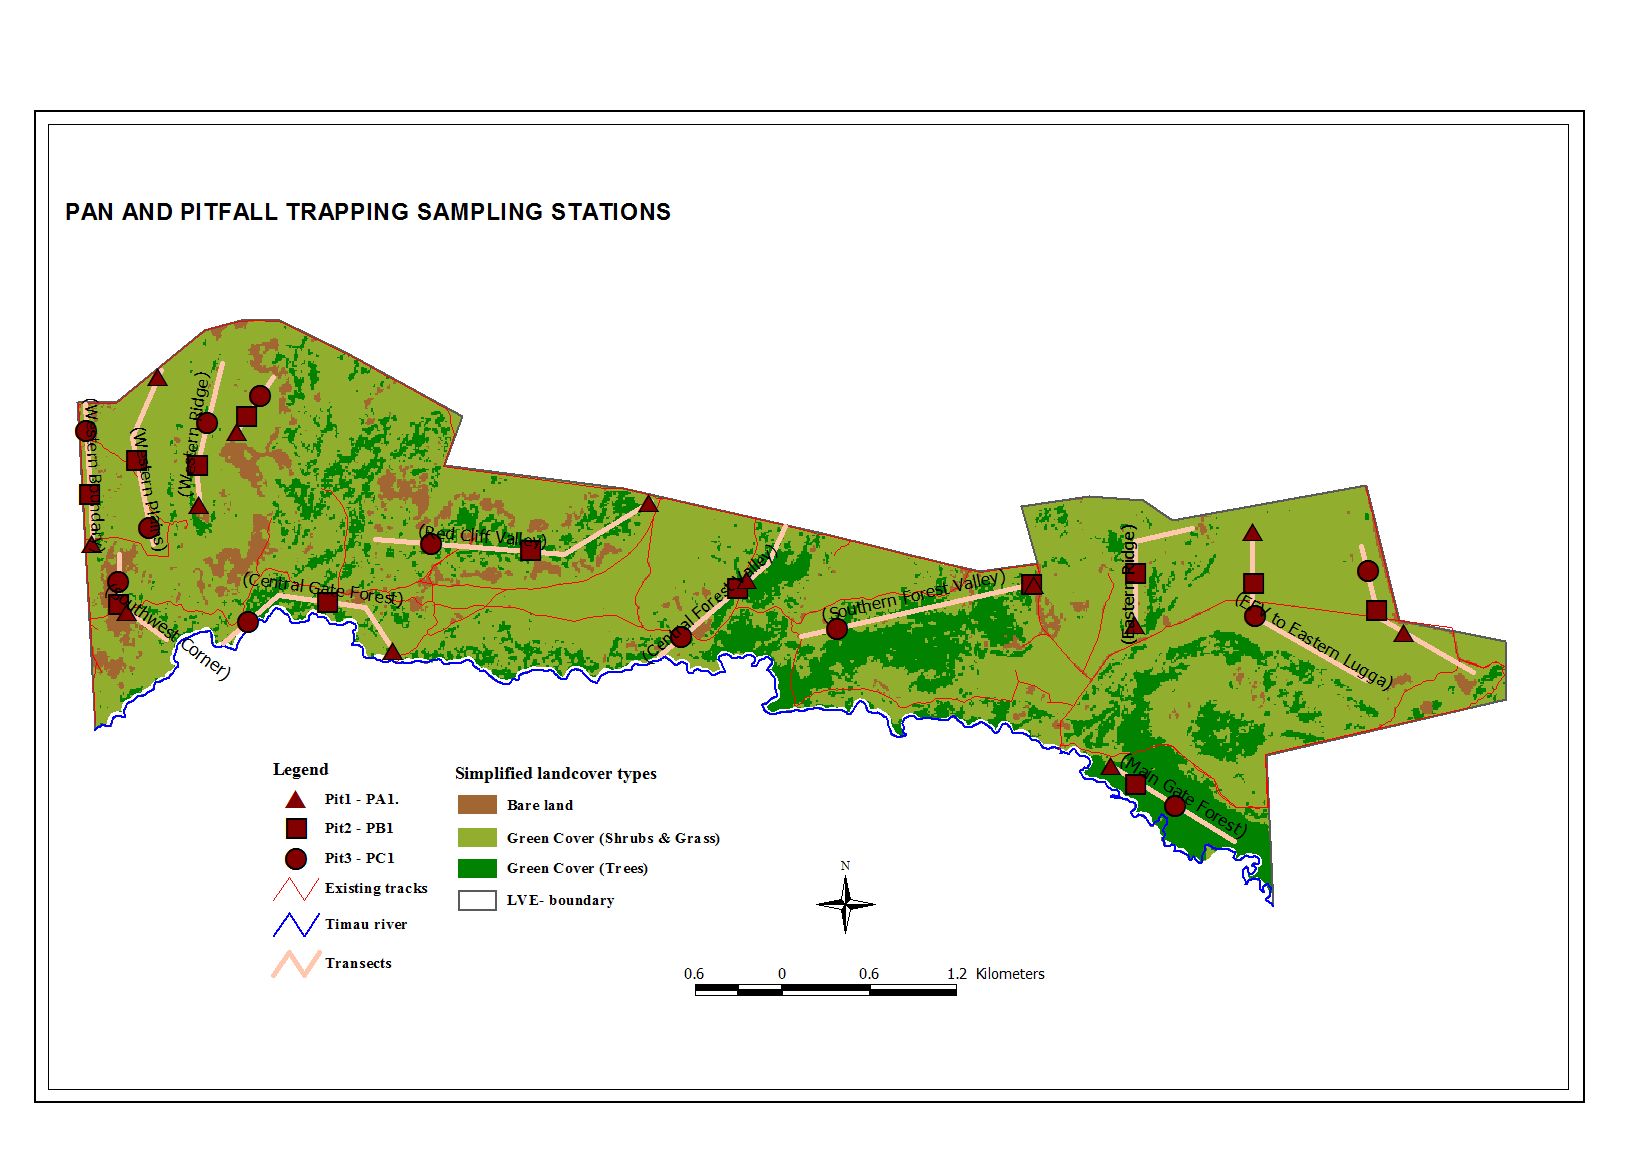
These are traps of colour filled with water and little detergent and are placed on the ground to attract winged insects which land and are drowned [31]; [32]. Pan traps target visually oriented invertebrates such as bees and other pollinators that are often attracted by color and the method is widely used in research [33]. The traps have been reported to be very effective in open places [34]. In the current study blue, white and yellow pans were used [33]. Pan traps were systematically placed in grids of three along each transect where station one was at the beginning of the transect while the other two stations were systematically placed along the transect. Each of these stations had a grid of 3 pan traps of each of the aforementioned colours that were half filled with soapy water and a little ethanol (Figure 4). The traps were left out for two nights (48hours) but were emptied after every 24 hours. Samples were taken to the lab for further processing.
Figure 4. The pan and pitfall trapping sampling stations and transects
Pitfall traps
These are passive traps for capturing epigeal insects for ecological surveys [32]. Many factors are known to influence their efficiency [35]; [36]. In the current study, we used double cone-shaped plastic containers of 500ml with a diameter of 8.5 cm, buried to their rim where insects inadvertently fell [37]; [38]. Soapy water was used to break the surface tension and ensure insects fell and drowned immediately. Pitfalls were placed at systematically designed intervals along each of the thirteen transects (Figure 4). Along each transect nine (9) pitfalls were systematically set in grids of 3 traps. At each grid, the pitfalls were 10m apart, along each of the established transects.
The traps were checked and emptied after every 48 hours for a total of four (4) consecutive days. Similar trapping has been used in the past to sample insects [39]; [38]. During emptying, a grid of three samples were pulled together to make a sample. Eventually, each transect had 3 samples after every 48hrs transiting to 6 samples per transect after 96 hours. In total there were 90 pitfall samples collected. It is noted that pitfall traps were set on different days from pan traps to minimize disturbances.
Sweep-netting
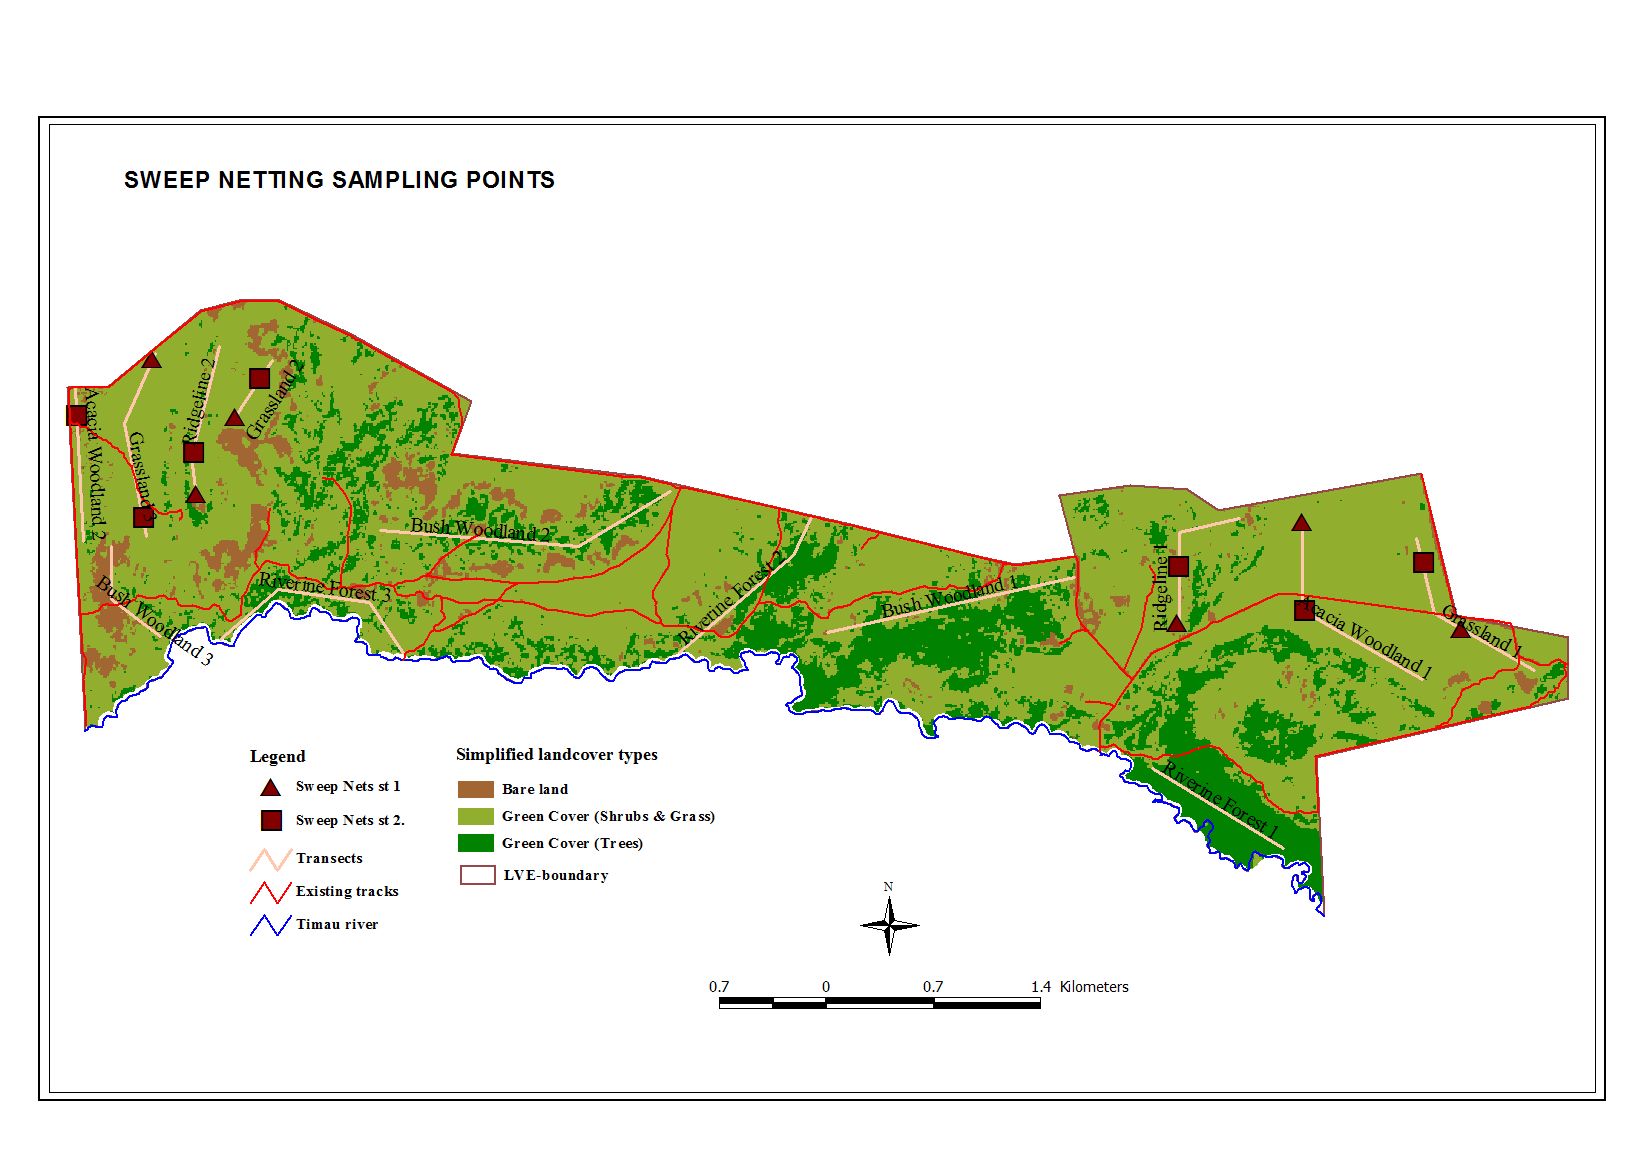
This method was mainly employed only for applicable habitats that had low vegetation (grasslands, Acacia woodland and ridgelines). Sweeping involved walking through the herb layer and understorey vegetation swinging a sweep net for a standard number of times [40]; [41]. Fifty (50) back and forth sweeps were performed along each of the established transects of known distance (Figure 5). After every 25 sweeps, samples were emptied on a killing jar with a killing agent (ethanol soaked on saviette). Two sweeping samples (of 50 sweeps each) were collected at the beginning of transect (Station 1) and at end of transect (final third). Later all the invertebrates were placed on a plain tray and sorted into appropriate vials and collection boxes. Sweeping was only performed once per transect during the study period.
Figure 5. The sweep-netting transects and sampling stations

2.3. Laboratory Processing of Samples

Laboratory processing involved sorting, specimen relaxation, pinning, labelling and identification. All collected insect materials were identified to the lowest possible taxonomic level (species or morphospecies) using the most recent databases, catalogues and taxonomic keys [42]; [43]. Comparisons were also made with voucher specimen collections held at the National Museums of Kenya (NMK) and taxonomic manuals. Where further identification and verification was needed, consultation with relevant taxa experts was sought.

2.4. Data Analysis

Data was initially entered into excel spread sheets [63] after lab processing. Statistical analysis (species area curves, diversity and ordination) was performed in PRIMER [44] as well as STATISTICA. In PRIMER, the diversity results considered were Total abundance (N), Total species richness (S), Pielou Evenness (J) and Shannon–Wiener diversity index (H').

3. Results

The evaluation of sampling effort.
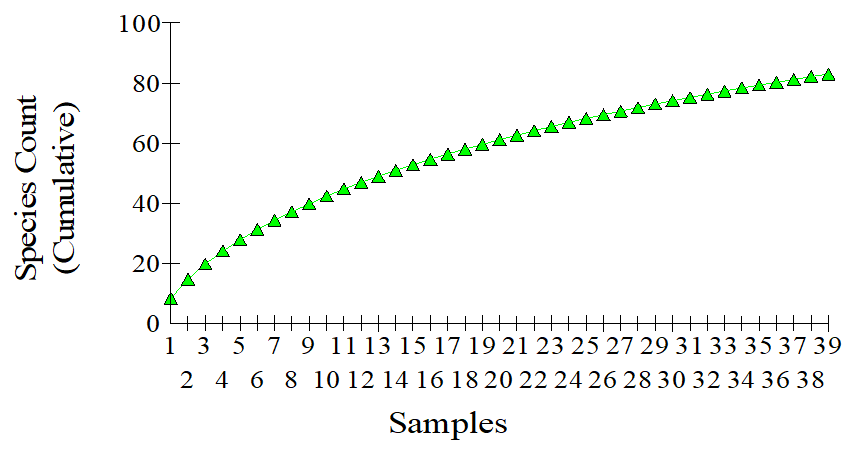
Although there were some incidences of destruction of traps where gazelles/impalas or zebra drank water from pantraps and baboons plucked a few pitfall traps and ungulates trampled on few pitfall traps, this did not significantly affect the study results. There were no incidences of flooding throughout the study. In the current study, the species accumulation curve for the pan traps is reported (Figure 6) where the curve was almost levelling. Similar curves were obtained for pitfalls and sweep netting samples.
Figure 6. Species accumulation curve for pan traps showing how new species were added during the sampling period

3.1. Checklists, Species Composition & Abundance

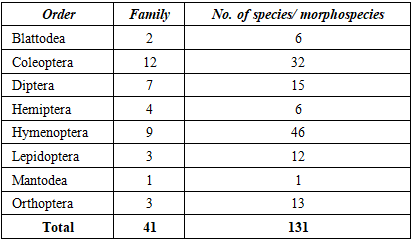
A total of 4199 invertebrates (3967 insects), belonging to 131 species/morphospecies were reported (Appendix 1.1). Overall, a total of eight (8) insect orders were encountered represented by 42 individual insect families (Table 2). Among the dominant insect species were Camponotus flavomarginatus, Camponotus vividus, Tetramorium sp, Tetramorium sp (Formicidae), Blatella germanica, (Blattodea), Zophosis sulcata, Geophanus pygmae, Coryna apicicornis (Coleoptera) and Macrogalea candida (Hymenoptera). The most diverse orders in terms of families were Coleoptera (32) and Hymenoptera (46).
Table 2. Summary total number of insect families and morphospecies reported
     

3.2. A comparison of Species Diversity Pameters in the Differentially Degraded Habitasts

There was a significant difference in species richness across the various habitat categories with degraded and moderately degraded habitats returning significantly low means, F(3, 35) =6.75, p=0.001. The source of variation was degraded and moderately degraded habitats which had significantly lower means. Similarly, there was a significant difference in insect abundance with the pristine habitats returning significantly higher means than the rest of habitats, F(3, 35) =2.99, p=0.04. However, there was no significant difference in species evenness F (3, 35) =1.34, p=0.27). There was a significant difference in Shannon–Wiener diversity index (H') for pan traps where moderately degraded habitats returned lower means than the other habitats, F(3, 35) = 5.54, p=0.003.
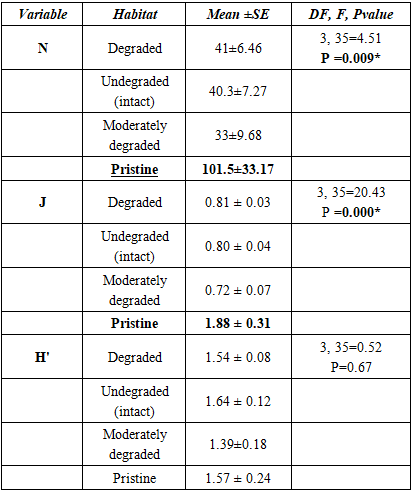
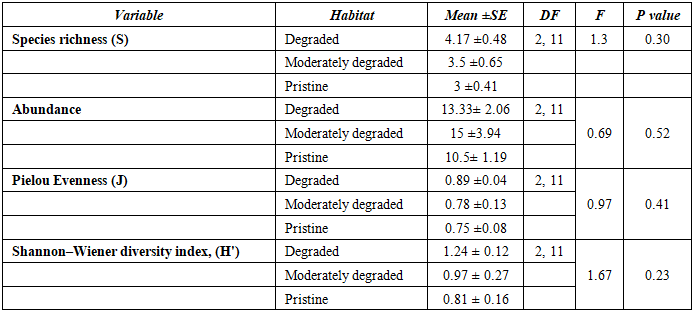
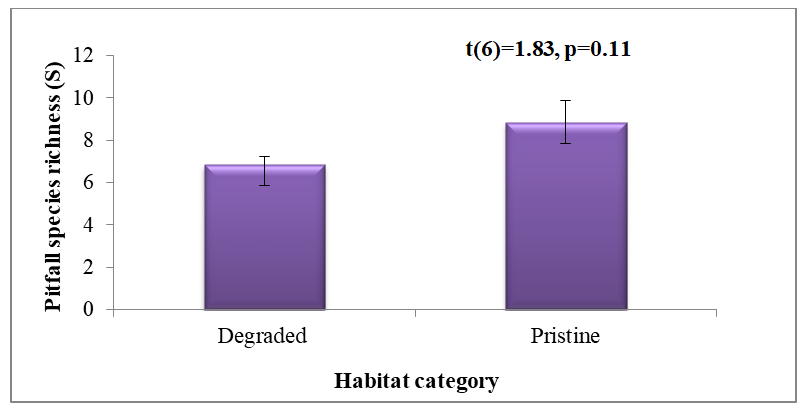
For data collected using pitfall traps, there were no significant differences in pitfall species richness across the habitat categories, F(3,35) = 1,55, p = 0.22. However, there were significant differences in the mean abundance and species evenness (Table 3). The source of variation was the Pristine habitat which reported significantly higher means in abundance and species evenness compared to the others. There was also no significant difference for pitfall species richness between degraded and pristine habitats (Figure 7). On analyzing all sweep samples, there were no significant differences in all diversity measures among the three habitats sampled (Table 4). Further, pairwise comparisons between any two habitats did not yield any significant differences between means.
Table 3. Pitfall traps diversity results for one way ANOVA across diverse habitats. * represents significant figures at p=0.05
     
Table 4. Sweeps diversity results for one way ANOVA across three habitats. *represents significant figures at p=0.05
     
Figure 7. Results of a t-test comparing the means for pitfall species richness between degraded and pristine habitats

4. Discussion and Recommendations

4.1. Discussion

Although species area curves for the three methods did not flatten completely, one can reasonably conclude that the sampling effort was optimal and species lists were satisfactory. This is supported by diverse studies [44]; [45]; [46]; [48] which have adversely discussed the relationship between species area and habitat. The fact that the entire study was only for one dry season implies that the list of 131 morphospecies is not exhaustive of the checklist and more species are likely to be encountered with more sampling over diverse seasons. The list is however more exhaustive for LVE compared to a previous report by [49] where a rapid assessment yielded only 45 species belonging 14 families Coleoptea (7), Lepidoptera (4) and Hymenoptera (3).
The current study is the first to report a large collection of insects (approx. 3967 individual belonging to 131 species) for LVA. Majority of past studies have been general to entire Laikipia ecosystem and were more inclined to specific taxa. Some of such studies reported 33 species of Lepidoptera [64], [65]; 29 species of Carabidae [66]; 8 Species of ants [67], [68]; 17 species of Diptera [69] among others. The dominance of Hymenoptera and coleoptera is similar to past studies in savanna ecosystem where [14] reported seven orders dominated by Hymenoptera and Coleoptera. Studies by [70] relied on similar methods but reported double the total abundance of insects (8147) due to a longer intensity and duration of sampling but the overall patterns of species richness and diversity were comparable.
The significant differences in species richness, abundance and Shannon–Wiener diversity index imply that the insects collected by pan traps were sensitive to the level of habitat degradation and therefore clearly indicates that degraded and moderately degraded habitats had low insect diversity. Previous studies have clearly demonstrated similar results where insects were sensitive to habitat quality [50]; [51]; [52]; [53]. The data on sweep netting and pitfall trapping, however, had no significant trends in insect abundance, species richness and diversity as demonstrated by the results and and table 4. This is contrary to studies in a similar ecosystem where interesting patterns were reported like a higher overall insect abundance [14]; reduced diversity with increased tree cover [51]; and positive correlation of environmental variables like temperature to diversity [54]. Lack of significant changes in sweeps results may imply that majority of the insects were not sensitive to changes in the habitat. It may also imply that the sampling duration intensity was probably not enough [55] or that the species collected by these two methods were not really sensitive to changes. Studies by [36]; [55] have also highlighted the importance of sampling intensity and duration in determining the efficiency of pitfall trapping, implying the need to prolong sampling duration.
The significantly low species in the degraded and moderately degraded habitats implied that the Eastern Plains, Western Boundary, Fig Tree Rock, Central Gate Forest, Zebra Plains to Acacia Grove and the south-western corner area have conspicuously lower insect species richness compared to Eastern and Western Ridges, Red Cliff Valley, Central Forest Valley as well as the Main Gate Forest. This could be attributed to the level of degradation of these habitats. It is expected that the ongoing restoration activities shall target the degraded areas and lead to improvement of habitat quality and consequently a rise in species diversity.

4.2. Conclusions & Recommendations

The insects collected from pan traps clearly discriminated the level of habitat degradation in LVA. The pitfall and sweep netting samples were not sensitive to changes happening to the ecosystem on the ground. There is however a need to encourage restoration of degraded and moderately degraded habitats in order to increase the biodiversity of insects which have many benefits to the ecosystem where management decisions can target the affected habitats for restoration. A recommendation is made for future studies to increase the intensity and duration of sampling to uncover hidden patterns of insect diversity in this ecosystem as well as long term monitoring of forest fires for sustainable restoration efforts.
In terms of conservation of species, there is need for further taxonomic analysis as some species were identified to morpho-species level. However, several species appear in IUCN red list as of Least concern (LC) as follows: Actizera stellate (Lepiodoptera, Lycaenidae); Byblia ilithyia, Charaxes achaemenes, Charaxes aubyni, Charaxes candiope, Charaxes chapalunga (Lepidoptera, Nymphalidae). The following are Data deficient (DD): Gymnobothrus linea and Taramassus cunctator (Orthoptera, Acridida).

ACKNOWLEDGEMENTS

Thanking LV management, Lolldaiga Valley Initiative and NAREDA Consultants for the opportunity to work with them.

Appendix

Appendix 1.1. A checklist of insects of Lloldaiga valley Ecosystem based on three (3) methods
     

References

[1]  Singh, J., Boucher, P. B., Hockridge, E. G., & Davies, A. B. (2023). Effects of long-term fixed fire regimes on African savanna vegetation biomass, vertical structure and tree stem density. Journal of Applied Ecology, 60, 1223–1238. https://doi.org/10.1111/1365-2664.14435.
[2]  Umuhoza, J., Jiapaer, G., Tao, Y., Bai, J., Hakizimana, E., Zhang, L., Liang, H., Lin, K., & Ju, T. (2025). Impacts of climate extremes on vegetation health in the tropical savannas of Africa. Global Ecology and Conservation, 61, e03649. https://doi.org/10.1016/j.gecco.2025.e03649.
[3]  Shackleton C, Shackleton S (2004). The importance of non-timber forest products in rural livelihood security and as safety nets: a review of evidence from South Africa. S Afr J Sci 100:558–664.
[4]  Bhanye, J. (2023). Traditional ecological knowledge and practices for ecosystem conservation and management: the case of savanna ecosystem services in Limpopo, South Africa. Article. https://doi.org/10.1080/13504509.2023.2249856.
[5]  Buisson E, Le Stradic A, Silveira FAO, Durigan G, Overbeck GE, Fidelis A, et al. (2018) Resilience and restoration of tropical and subtropical grasslands, savannas and grassy woodlands. Biological Reviews 94: 590–609.
[6]  Dudley, N., Eufemia, L., Fleckenstein, M., Periago, M. E., Petersen, I., & Timmers, J. F. (2020). Grasslands and savannahs in the UN Decade on Ecosystem Restoration. Restoration Ecology, 28(6), 1313-1317.
[7]  Scudder, G.G.E. (2017). The Importance of Insects. In Insect Biodiversity (eds R.G. Foottit and P.H. Adler). https://doi.org/10.1002/9781118945568.ch2.
[8]  Verma, R., Waseem, M., Sharma, N., Bharathi, K., Singh, S., Rashwin, A., Pandey, S., and Singh, B. (2023). The Role of Insects in Ecosystems, an in-depth Review of Entomological Research. International Journal of Environment and Climate Change. 13. 4340-4348. 10.9734/ijecc/2023/v13i103110.
[9]  Bedair, H., Alghariani, M.S., Omar, E., Anibaba, Q.A., Remon, M., Bornman, C., Kiboi, S. K., Rady, H. A., Salifu, M.A. & Ghosh, S., Guuroh, R. T., Sanou, L, & Alzain, H. M (202. Global warming status in the African continent: sources, challenges, policies, and future direction. International Journal of Environmental Research, 17 (3) 45. https://doi.org/10.1007/s41742-023-00534-w.
[10]  Geißler, K. et al. (2024). Biodiversity and Ecosystem Functions in Southern African Savanna Rangelands: Threats, Impacts and Solutions. In: von Maltitz, G.P., et al. Sustainability of Southern African Ecosystems under Global Change. Ecological Studies, vol 248. Springer, Cham. https://doi.org/10.1007/978-3-031-10948-5_15.
[11]  Li, W., Buitenwerf, R., Munk, M., Amoke, I., Bøcher, P., & Svenning, Jens-Christian. (2020). Accelerating savanna degradation threatens the Maasai Mara socio-ecological system. Global Environmental Change. 60. 102030. 10.1016/j.gloenvcha.2019.102030.
[12]  Gerlach, J., Samways, M., & Pryke, J. (2013). Terrestrial invertebrates as bioindicators: an overview of available taxonomic groups. Journal of insect conservation, 17, 831-850. https://doi.org/10.1007/s10841-013-9565-9.
[13]  Borges, F. L. G., da Rosa Oliveira, M., de Almeida, T. C., Majer, J. D., & Garcia, L. C. (2021). Terrestrial invertebrates as bioindicators in restoration ecology: A global bibliometric survey. Ecological Indicators, 125, 107458. https://doi.org/10.1016/j.ecolind.2021.107458.
[14]  Mhlanga, L., Kapembeza, C., Sithole, R., & Kativu, S. (2022). Variation in ground insect diversity, composition and abundance across land use types in an African savanna, Zimbabwe. Scientific African, 16, e01204. https://doi.org/10.1016/j.sciaf.2022.e01204.
[15]  Ramola, G. C., Nidhi R., Ravindra S., Ankita S. S., Lekhendra S., and Pravin R. (2024). “Insects As Ecological Indicators: A Review”. International Journal of Environment and Climate Change, 14: 260-79. https://doi.org/10.9734/ijecc/2024/v14i124623.
[16]  Xiupeng Yi., Yanwen Zh., Xichen Z., Yan L and Zhongyuan D. (2026). Insect indicators of the environment: A review of progress toward environmental monitoring, Ecological Indicator: 186: 114871. https://doi.org/10.1016/j.ecolind.2026.114871.
[17]  Reinhard, J., Geissler, K. & Blaum. (2018). Short-term responses of darkling beetles (Coleoptera: Tenebrionidae) to the effects of fire and grazing in savannah rangeland. Insect Conservation and Diversity. 12. 10.1111/icad.12324. https://resjournals.onlinelibrary.wiley.com/doi/epdf/10.1111/icad.12324.
[18]  Henschel, J. R. (2021). Long-Term Population Dynamics of Namib Desert Tenebrionid Beetles Reveal Complex Relationships to Pulse-Reserve Conditions. Insects, 12(9), 804. https://doi.org/10.3390/insects12090804.
[19]  Magagula, C.N. (2022). Rapid Assessment of Ant (Formicidae) and Beetle (Carabidae, Scarabaeidae, Tenebrionidae) Assemblages Across an Ecological Gradient in an African Savanna for Conservation Planning. Proc Zool Soc 75, 221–230. https://doi.org/10.1007/s12595-022-00432-7.
[20]  Yousif N. Aldryhim, C.W. Mills III, A.S. Aldawood (1992). Ecological distribution and seasonality of darkling beetles (Coleoptera: Tenebrionidae) in the central region of Saudi Arabia. Journal of Arid Environments, Volume 23, Issue 4, November 1992, Pages 415-422. https://www.sciencedirect.com/science/article/abs/pii/S0140196318306141?via%3Dihub.
[21]  Miličić M., Popov S., Branco V. V., Pedro Cardoso P. (2021). Insect threats and conservation through the lens of global experts. Conserv. Lett. 14. doi: 10.1111/conl.12814.
[22]  Stork, N. E. 2018. How many species of insects and other terrestrial arthropods are there on Earth? Annual Review of Entomology 63: 31–45.
[23]  Musila, Simon, Monadjem, A, Webala, P. W., Patterson, Bruce D., Hutterer, Rainer, de Jong, Yvonne A., Butynski, T. M., Mwangi, G. G., Chen, Z. & Jiang, Xuelong. 2019. An annotated checklist of mammals of Kenya. Zoological research, Volume 40, Issue 1, Year 2019. https://doi.org/10.24272/j.issn.2095-8137.2018.059 , ISSN: 20958137.
[24]  Wells, H. B. M.; Kirobi, E. H.; Chen, C. L.; Winowiecki, L. A.; Vagen, T.; Ahmad, M. N.; Stringer, L. C.; Dougill, A. J. 2021. Equity in ecosystem restoration. Restoration ecology. 29(5): e13385. doi: 10.1111/rec.13385.
[25]  Butynski, T. M & de Jong, Yvonne A.. 2018. Lolldaiga Hills research programme. Newsletter–August 2018 (Issue 20). Available from: https://www.researchgate.net/publication/329319963_LOLLDAIGA_HILLS_RESEARCH_PROGRAMME _NEWSLETTER_-_July-August_2018.
[26]  Butynski, Thomas M & de Jong, Yvonne A.2014. Primate conservation in the rangeland agroecosystem of laikipia county, Central Kenya. Primate Conservation, Volume 28, Issue 1, Year 2014. DOI: 10.1896/052.028.0104, ISSN: 08986207.
[27]  Roberts, M., Spawls, S., Malonza, P., Muchai, V., Mathiu, J. & Butynski, T. M. 2015. Reptiles and amphibians of the Lolldaiga Hills Conservation Landscape. Unpublished list of the Lolldaiga Hills Research Program, Nanyuki, Kenya.
[28]  QField (2026) [Mobile application]. (YEAR). OPENGIS.ch. Copyright © 2026 OPENGIS.ch Retrieved from https://qfield.org.
[29]  Montgomery G. A., Belitz, M. W.,Guralnick, R. P. & Tingley, M. W. (2021). Standards and Best Practices for Monitoring and Benchmarking Insects. Front. Ecol. Evol. 8: 579193. doi: 10.3389/fevo.2020.579193.
[30]  Martins, D. J. (2015). Insects of East Africa pocket guide. Nature Kenya - The East Africa Natural History Society.
[31]  Dafni, A., Kevan, P. G., & Husband, B. C. (Eds.). (2005). Practical pollination biology. Enviroquest.
[32]  Buchholz, S.; Jess, A.M.; Hertenstein, F.; Schirmel, J. 2010. Effect of the colour of pitfall traps on their capture efficiency of carabid beetles (Coleoptera: Carabidae), spiders (Araneae) and other arthropods. Eur. J. Entomol. 2010, 107, 277–280.
[33]  Popic T. J., Davila, Y. C. & Wardle, G. M. 2013. Evaluation of common methods for sampling invertebrate pollinator assemblages: net sampling out-perform an traps. PLoS ONE 8(6): https://journals.plos.org/plosone/article?id=10.1371/journal.pone.0066665.
[34]  Dirrigl, F.J. 2012. Effectiveness of Pan Trapping as a Rapid Bioinventory Method of Freshwater Shoreline Insects of Subtropical Texas. Southwestern Entomologist, 37: 133-139. DOI:10.3958/059.037.0205.
[35]  Saska, P., Makowski, D., Bohan, D. A., & Van Der Werf, W. (2021). The effects of trapping effort and sources of variability on the estimation of activity-density and diversity of carabids in annual field crops by pitfall trapping; a meta-analysis. Entomologia Generalis, 41(6), 553–566. https://doi.org/10.1127/entomologia/2021/1211.
[36]  Ahmed, D.A., Beidas, A., Petrovskii, S.V., Bailey, J. D., Bonsall, M. B., Hood, A. S. C., Byers, J. A., Hudgins, E. J., Russell, J. C., Růžičková, J., Bodey, T. W., Renault, D., Bonnaud, E., Haubrock, P. J., Soto, I., & Haase, P. (2023). Simulating capture efficiency of pitfall traps based on sampling strategy and the movement of ground-dwelling arthropods. Methods in Ecology and Evolution, 14, 2827–2843. https://doi.org/10.1111/2041-210X.14174.
[37]  Sutherland, W. J. (1996). Ecological census techniques: A handbook. Cambridge: Cambridge University Press.
[38]  Warui, C. M., Villet, M. H., & Young, T. P. 2004. Spiders (Araneae) from black cotton soils of a highland savanna in Laikipia, central Kenya. Journal of Afrotropical Zoology 1: 13-24.
[39]  Uetz, G. W., and J. D. Unzicker. 1976. Pitfall trapping in ecological studies of wandering spiders. J. Arachnol. 3: 101-111.
[40]  Dippenaar-Schoeman A S, Van den Berg A M & Van den Berg A 1999. Spiders in South African cotton fields: species diversity and abundance (Arachnida: Araneae). African Plant Protection 5(2): 93-103.
[41]  Warui, C. M., Villet, M. H., Young, T. P., & Jocqué, R (2005). Influence of grazing by large mammals on the spider community of a Kenyan savanna. Journal of Arachnology 33: 269-279. http://www.bioone.org/doi/full/10.1636/CT05-43.
[42]  De Prins J, De Prins W, Heughebaert A (2024). Afromoths, online database of Afrotropical moth species (Lepidoptera). Version 1.23. Belgian Biodiversity Platform. Checklist dataset https://doi.org/10.15468/s1kwuw accessed via GBIF.org on 2026-07-05.
[43]  Coleoptera in GBIF Secretariat (2023). GBIF Backbone Taxonomy. Checklist dataset https://doi.org/10.15468/39omei accessed via GBIF.org on 2025-02-15.
[44]  Clarke, K. R., & Gorley, R. N. (2006). Ecological Statistics Software PRIMER v5.
[45]  Thompson, G. G. and P. C. Withers. 2003. Effect of species richness and relative abundance on the shape of the species accumulation curve. Austral Ecology 28: 355-360.
[46]  Thompson, G. G., P. C. Withers, E. R. Pianka, and S. A. Thompson. 2003. Assessing biodiversity with species accumulation curves; inventories of small reptiles by pit-trapping in Western Australia. Austral Ecology 28: 361-383.
[47]  Tjorve E, Matthews TJ, Whittaker RJ (2021a) The History of the Species-Area Relationship. In: Matthews TJ, Triantes KA, Whittaker RJ (eds) The Species-Area Relationship: Theory and Application. Cambridge University Press, Cambridge, pp 20–48.
[48]  Tjorve E, Tjorve KMC, Sizlingová E et al (2021b) Determinants of the shape of Species-Area curves. In: Matthews TJ, Triantes KA, Whittaker RJ (eds) The Species-Area Relationship: Theory and Application. Cambridge University Press, Cambridge, pp 78–106.
[49]  Wasonga, V., Wamiti, W., Abdillahi, H., Kinuthia, W & Mwebi, O. 2015. Four Biodiversity Assessments of Lolldaiga Hills Ranch by the National Museums of Kenya (2014). file:///C:/Users/WARUI/Downloads/Four_Biodiversity_Assessments_of_Lolldai-1.pdf.
[50]  Grez, A.A., Zaviezo, T., DÍAZ, S., Camousseigt, B. & Cortés-Hinojosa, G. (2008). Effects of habitat loss and fragmentation on the abundance and species richness of aphidophagous beetles and aphids in experimental alfalfa landscapes. European Journal of Entomology. 105. 411-420. 10.14411/eje.2008.052.
[51]  Neves, K., Santos, B., Schultz, T., Gotzek, D., Abreu, R.C.R., Durigan, G. et al. (2023) Woody encroachment affects multiple dimensions of ant diversity in a neotropical savanna. Insect Conservation and Diversity, 16(3), 393–402. Available from: https://doi.org/10.1111/icad.12633.
[52]  Martínez-Dueñas, D. & Cogollo, J. E. (2022). Effects of habitat loss on three insect assemblages in modified ecosystems of foothills of the Colombian Orinoquia. Revista de Biologia Tropical. 70. 504-525. 10.15517/rev.biol.trop.2022.49628.
[53]  Perrin, A., Rein, F., Christe, P. & Pellet, J. (2025). Habitat fragmentation impact on insect diversity: opposing forces at patch and landscape levels. Landsc Ecol. 2025; 40(6): 113. doi: 10.1007/s10980-025-02133-w.
[54]  Budiaman, B., Nuraeni, S., Nurhaini, N., & Prastiyo, A. (2025). Composition and role of ants (Formicidae) as indicators of habitat conditions in different stands in urban forest, Makassar, South Sulawesi, Indonesia. Biodiversitas Journal of Biological Diversity, 26(1). https://doi.org/10.13057/biodiv/d260116.
[55]  Oberprieler, S.K. & Andersen, A.N. (2020). The importance of sampling intensity when assessing ecosystem restoration: ants as bioindicators in northern Australia. Restor Ecol, 28: 737-741. https://doi.org/10.1111/rec.13172.
[56]  FAO 2026. Lolldaiga Hills Ranch: Rotational Grazing and Boma-Based Land Reclamation. https://sti-portal.fao.org/innovations/lolldaiga-hills-ranch-rotational-grazing-and-boma-based-land-reclamation.
[57]  Lloldaiga conservancy 2024. About Lloldaiga Conservancy. https://www.lolldaigaconservancy.org/about.
[58]  Butynski, T. M & de Jong, Yvonne A.. 2018. Lolldaiga Hills research programme. Newsletter–August 2018 (Issue 20). Available from: https://www.researchgate.net/publication/329319963_LOLLDAIGA_HILLS_RESEARCH_PROGRAMME _NEWSLETTER_-_July-August_2018 [accessed Mar 15 2025].
[59]  Hutcheson J.A.; Kimberley, M.O. 1999: A pragmatic approach to insect community characterisation: Malaise trapped beetles. New Zealand Journal of Ecology 23: 69–79.
[60]  Schotzko, D.J. & O’Keeffe, L.E. (1989). Comparison of sweep net., D-Vac., and absolute sampling., and diel variation of sweep net sampling estimates in lentils for pea aphid (Homoptera: Aphididae)., Nabids (Hemiptera: Nabidae)., lady beetles (Coleoptera: Coccinellidae)., and lacewings (Neuroptera: Chrysopidae). Journal of Economic Entomology, 82: 491-506.
[61]  Murray, S. U & Chapman, B. L (2010). Methods for Collecting, Preserving and Studying Insects and Other Terrestrial Arthropods. 5thEdition, Australian Entomological Society. ISBN: 978-0-646-54337-6.
[62]  Herms, D. A., Nielsen, D. G., Sydnor, D. T. (1990). Comparison of Two Methods for Sampling Arboreal Insect Populations, Journal of Economic Entomology, Volume 83: (3) 69–874, https://doi.org/10.1093/jee/83.3.869.
[63]  Microsoft Corporation. (2018). Microsoft Excel. Redmond, Washington, USA. https://office.microsoft.com/excel.
[64]  Lehmann, I., Roberts, M., Mathiu, J.M. & Butynski, T.M. (2018) Undescribed species and genera of Metarbelidae moths (Lepidoptera, Cossoidea) from Lolldaiga Hills Ranch, central Kenya. Newsletter Lolldaiga Hills Research Programme, January–February 2018, 3–4. Available from: http://www.lolldaiga.com/metarbelidae-moths-lolldaiga.
[65]  Lehmann, I., Zahiri, R. & Husemann M. 2023. Revision of the Metarbelodes Strand, 1909 genus-group (Lepidoptera: Cossoidea: Metarbelidae) with descriptions of two new genera and 33 new species from high elevations of eastern and southern Africa. Zootaxa Vol. 5267 No. 1: 18 Apr. 2023.
[66]  Gordon, Robert D. and Barbero, Enrico. 2009. "Dung beetles (Coleoptera: Scarabaeidae: Scarabaeinae) of the Mpala Research Centre and environs, Laikipia District, Kenya." Journal of East African Natural History. 97 (2): 135–164. https://doi.org/10.2982/0012-8317-97.2.135.
[67]  Palmer, T, Young, T.P., Stanton, M. L & Wenk E (2000). Short-term dynamics of an Acacia ant community in Laikipia, Kenya. Oecologia 123(3): 425-435.
[68]  Garcia, F H., Eva Wiesel & Georg Fischer (2012).The Ants of Kenya (Hymenoptera: Formicidae)—Faunal Overview, First Species Checklist, Bibliography, Accounts for All Genera, and Discussion on Taxonomy and Zoogeography, Journal of East African Natural History 101(2): 127–222.
[69]  Dick CW, Verrett TB, Webala PW, Patterson BD. 2023. Nycteribiid bat flies (Arthropoda, Insecta, Diptera, Nycteribiidae) of Kenya. Zookeys. Jul 13; 1169: 65-85. doi: 10.3897/zookeys.1169.102800. PMID: 38328029; PMCID: PMC10848833.
[70]  Kyerematen, R., Owusu, E. H., Acquah-Lamptey, D., Anderson, R. S & Ntiamoa-Baidu, Y. (2014). Species Composition and Diversity of Insects of the Kogyae Strict Nature Reserve in Ghana. Open Journal of Ecology 4: 1061-1079. https://www.scirp.org/journal/paperinformation?paperid=52758.