-
Paper Information
- Paper Submission
-
Journal Information
- About This Journal
- Editorial Board
- Current Issue
- Archive
- Author Guidelines
- Contact Us
International Journal of Ecosystem
p-ISSN: 2165-8889 e-ISSN: 2165-8919
2025; 14(1): 22-34
doi:10.5923/j.ije.20251401.02
Received: Oct. 2, 2025; Accepted: Oct. 26, 2025; Published: Nov. 10, 2025

Effect of Anthropogenic Drivers on Forest Cover and Ecosystem in Mkuti Forest Reserve, Kasulu District, Tanzania
 Abstract
 Reference
 Full-Text PDF
 Full-text HTML
Shadrack A. Msilu1, Pantaleo KT Munishi1, Thadei Rugambwa1, Kelvin J. Lyatuu1, Beatus Mwendwa2
1Department of Ecosystems and Conservation, Sokoine University of Agriculture, P.O. Box 3010, Morogoro, Tanzania
2Department of Research, Publications and Consultancies, Institute of Adult Education, P. O. Box 20679, Dar es Salaam, Tanzania
Correspondence to: Shadrack A. Msilu, Department of Ecosystems and Conservation, Sokoine University of Agriculture, P.O. Box 3010, Morogoro, Tanzania.
| Email: |  |
Copyright © 2025 The Author(s). Published by Scientific & Academic Publishing.
This work is licensed under the Creative Commons Attribution International License (CC BY).
http://creativecommons.org/licenses/by/4.0/

Forests provide critical ecological, economic, and social services, yet anthropogenic pressures continue to drive rapid degradation worldwide. In Tanzania, Miombo woodlands are increasingly threatened by logging, charcoal production, agricultural expansion, and population growth. This study assessed forest cover change and associated ecosystem alterations in Mkuti Forest Reserve, Kigoma Region, between 2000 and 2024, integrating satellite-based land cover analysis with field assessments of anthropogenic disturbances. Landsat imagery for 2000, 2013, and 2024 was classified into four land cover types: closed woodland, open woodland, agriculture, and water bodies. Accuracy assessments yielded overall accuracies of 81–85% and Kappa coefficients of 0.71–0.77. Results indicated a dramatic decline in closed woodland from 46.48% to 5.17%, a substantial increase in agriculture (25.18% to 43.90%) and open woodland (23.72% to 41.96%), and expansion of water bodies (4.62% to 8.97%). Annual loss rates were highest for closed woodland (−18.23% between 2000–2013) and gains for open woodland (5.20%) and agriculture (4.02%). Field surveys across 71 plots revealed that logging intensity (stump count), charcoal production, farm encroachment, and illegal logging were significant predictors of woodland loss, whereas fire and grazing had limited direct effects. Spatial analysis indicated that proximity to villages and weak enforcement exacerbated disturbance. Population density and regional economic growth were positively correlated with deforestation, reflecting the interplay between demographic pressure and resource-based livelihoods. The findings underscore the urgent need for integrated management strategies, including participatory forest governance, enforcement of protection measures, livelihood alternatives, and restoration of degraded areas. This study demonstrates that combining remote sensing with field-based assessments provides a robust framework for monitoring forest dynamics and guiding sustainable management of Miombo ecosystems under increasing anthropogenic pressure.
Keywords: Deforestation, Spatial temporal analysis, Random forest, Ecosystems, Rate of change
Cite this paper: Shadrack A. Msilu, Pantaleo KT Munishi, Thadei Rugambwa, Kelvin J. Lyatuu, Beatus Mwendwa, Effect of Anthropogenic Drivers on Forest Cover and Ecosystem in Mkuti Forest Reserve, Kasulu District, Tanzania, International Journal of Ecosystem, Vol. 14 No. 1, 2025, pp. 22-34. doi: 10.5923/j.ije.20251401.02.
Article Outline
1. Introduction
- Forests are vital ecosystems that deliver a wide range of ecological, economic, and social services, including biodiversity conservation, climate regulation, water catchment protection, and the provision of livelihoods, especially in rural communities [10]. Despite their value, global forest cover continues to decline at an alarming rate due to anthropogenic pressures. Between 2000 and 2020, approximately 101.8 million hectares of tree cover were lost worldwide, with the greatest losses occurring in tropical regions [19]. According to the Food and Agriculture Organization (FAO), the annual rate of global deforestation reached 10 million hectares per year between 2015 and 2020 [10].In sub-Saharan Africa, forest degradation is primarily driven by agricultural expansion, logging, charcoal production, and settlement development [7]. The continent recorded the highest net loss of forest area globally between 2010 and 2020, with an average of 3.9 million hectares lost per year [10]. In Tanzania, deforestation is estimated at 469,000 hectares annually, attributed primarily to shifting cultivation, unsustainable harvesting, charcoal burning, and population pressure [28]. Study conducted across mainland Tanzania [37] and within protected areas [36] have reported a consistent trend of forest cover loss resulting from the conversion of natural forests to agricultural land, settlements, and other land uses.Although forest degradation has been widely documented across Tanzania, studies focusing on the western regions of the country remain limited. In Kigoma Region, where Mkuti Forest Reserve is located, emerging research is beginning to reveal the extent and underlying drivers of forest loss. For example, [16] reported that land use and land cover changes forest cover in the Masito–Ugalla ecosystem declined substantially between 1990 and 2014, while agricultural land, open woodlands, and settlement areas expanded. These changes were primarily driven by agricultural expansion, wood extraction, population growth, poverty, and increased demand for fuelwood. In addition, [40] in a study of land use and vegetation cover dynamics around Kagoma Forest Reserve in Kagera Region, found a consistent decline in forest and woodland cover between 1988 and 2010, with forest cover decreasing from 9.5% to 1.39%, and woodland from 28.9% to 5.95%.Despite these insights, there remains a lack of detailed, site-specific study regarding deforestation within Mkuti Forest Reserve. Most existing literature either generalizes deforestation patterns across the broader Kigoma Region or focuses on nearby forest ecosystems, thereby overlooking localized dynamics within Mkuti. Furthermore, few studies in the region have combined remote sensing technologies with ground-based assessments of anthropogenic disturbance, which are essential for understanding spatial patterns of change and identifying causal factors.The aim of this study is to assess the extent and drivers of forest cover change and associated ecosystem alterations within Mkuti Forest Reserve from 2000 to 2024. By integrating satellite-based land cover analysis with field assessments of anthropogenic disturbances, the study (i) analyzed spatial-temporal land cover changes in Mkuti Forest Reserve between 2000, 2013, and 2024 using satellite imagery; (ii) quantified the annual rates, gains, losses, and persistence of different land cover classes over the study period; and (iii) assessed the influence of anthropogenic disturbance variables on forest cover change. Through this assessment, the findings are intended to inform sustainable forest management and restoration interventions for Miombo ecosystems under increasing anthropogenic pressure.
2. Material and Method
2.1. Description of the Study Site
- Mkuti Forest Reserve is a Central Government-owned Forest managed under the Ministry of Natural Resources and Tourism through the Tanzania Forest Services Agency (TFS), gazetted under Government Notice No. 287 of 1956. Initially encompassing an area of 105,412.93 hectares, the current officially recognized area of the forest reserve is 48,638.93 hectares, following boundary rationalizations due to land use conflicts and administrative adjustments [28]. The reserve is situated in Kasulu District, Kigoma Region, and lies between Latitude 4°34′36.01″S and Longitude 30°06′09.00″E [25]. Geographically, the forest reserve is located approximately 19 kilometers from Kasulu town and is readily accessible by road. The terrain of the forest is predominantly flat to gently undulating, ranging in elevation from 1,200m – 1,800meters above sea level, with a few upland hills concentrated in the northern part. The reserve is characterized primarily by Miombo woodlands (Brachystegia, Julbernardia, and Isoberlinia species), interspersed with patches of riparian vegetation along watercourses [27].Ecologically, Mkuti Forest Reserve serves as an important catchment area contributing to the hydrology of Lake Tanganyika. Several rivers including Lugufu, Mazungwe, Kidawe, Lubilizi, and Ngandago originate or flow through the reserve, ultimately contributing to the Malagarasi River basin, which drains into Lake Tanganyika. This complex hydrological network supports a diversity of flora and fauna and underpins essential ecosystem services such as water regulation, sediment control, and wildlife habitat provision [25]. The area experiences a tropical savanna climate, with average annual temperatures ranging between 25.5°C and 33.2°C. Rainfall is unimodal, typically occurring from late October to May, with annual precipitation varying from 600mm to 1000mm/year. These climatic and edaphic conditions support the growth of wet forests and woodlands, especially the Miombo ecosystem, which is adapted to fire, drought, and nutrient-poor soils [16].
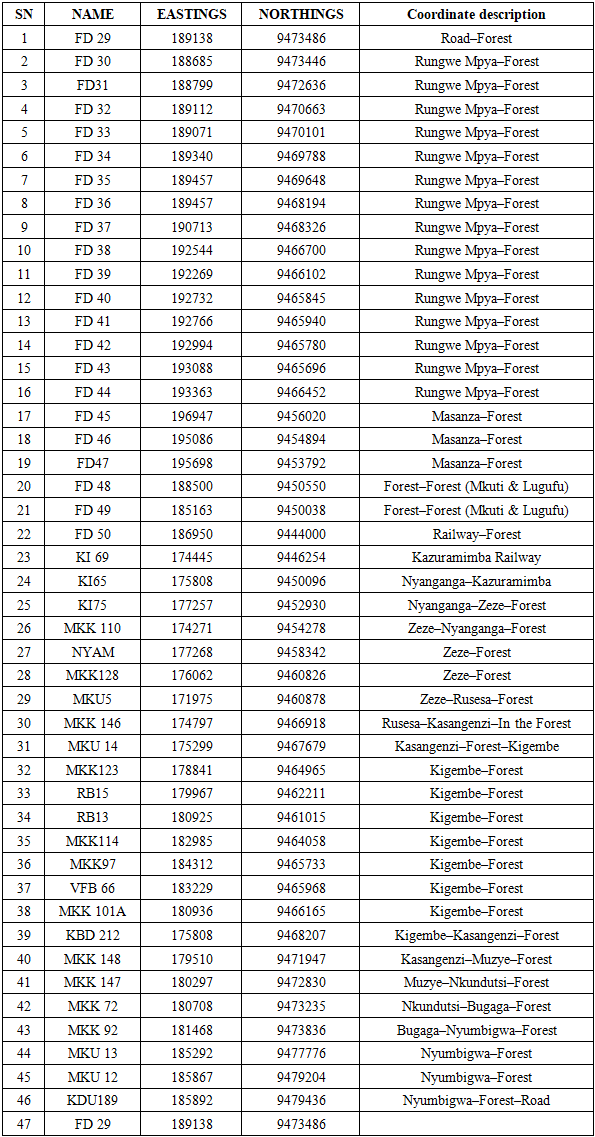
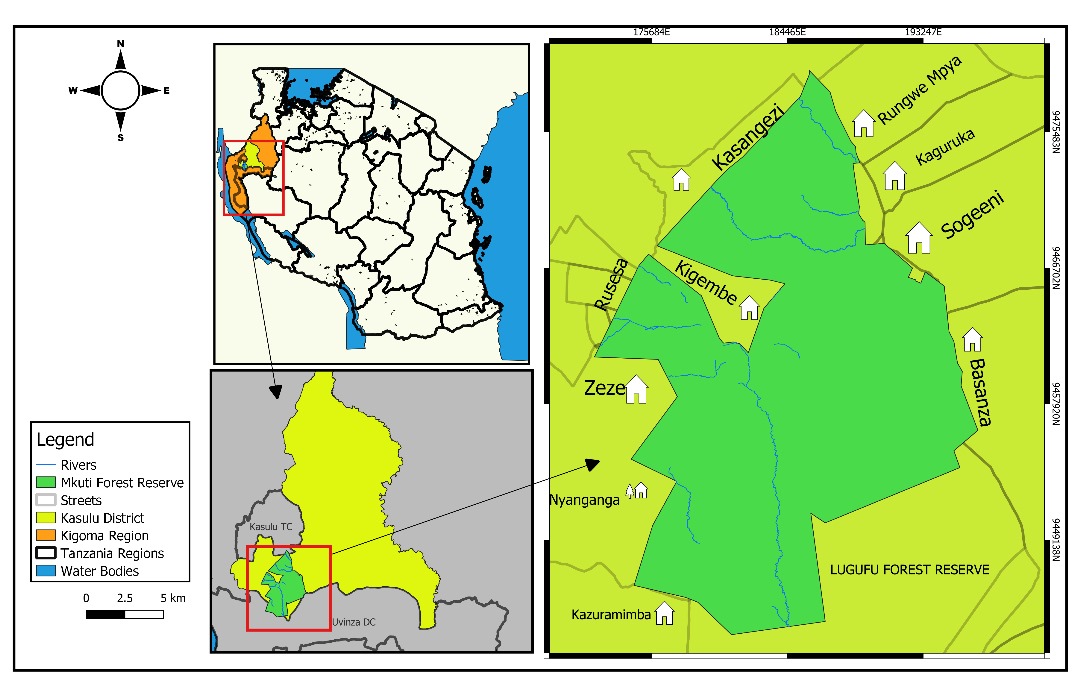 | Figure 1. A Map showing geographical location and spatial extent of Mkuti Forest Reserve in Kasulu District within Eastings (171975/9460878 to 196947/9456020) and Northings (186950/9444000 to 185892/9479436) at Kigoma Region, (Coordinates in Appendix 1) |
2.2. Data Collection
2.2.1. Imageries Acquisition
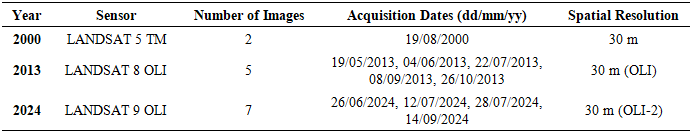
- Landsat Top of Atmosphere (TOA) imagery for the years 2000, 2013, and 2024 was acquired from the Google Earth Engine (GEE) platform. Only dry season scenes with less than 5% cloud cover were selected to ensure consistency and minimize atmospheric interference. Median composite images were generated for each year using the pixel-wise median approach, providing high-quality inputs for land cover classification [32]. Additional details on sensors, acquisition dates, and image counts (Table 1). The selected years represent key anthropogenic events influencing Mkuti Forest Reserve. In 2000, Lugufu Refugee Camp located near the reserve was still active, exerting pressure on the forest [52]. The year 2013 was selected as a midpoint to observe forest cover trends following the camp’s closure in 2009 and the shift in management to the Tanzania Forest Service Agency [28]. The year 2024 reflects the current condition. This timeframe allows assessment of forest cover changes in response to these human-driven influences.
|
2.2.2. Image Processing
- Image processing was carried out within the Google Earth Engine (GEE) platform in three main stages. First, Landsat imagery were atmospherically corrected to Top-of-Atmosphere (TOA) reflectance using standard rescaling coefficients provided in the metadata. For Landsat 5 (TM), pre-processing was based on surface reflectance conversion integrated within the collection (C02/T1_TOA). Second, geometric correction and rectification were performed to align all imagery to the national coordinate system (UTM Zone 35 South, Datum Arc 1960, Spheroid Clarke 1880), ensuring accurate multi-temporal spatial analysis. Third, image enhancement was conducted to support visual interpretation, including the generation of true-color composites (RGB: Bands 3, 2, 1) and (Bands 4, 3, 2) to highlight vegetation and land cover features.
2.2.3. Image Classification
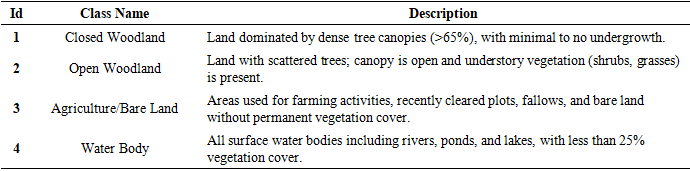
- Supervised land cover classification was conducted using the Random Forest (RF) machine learning algorithm within Google Earth Engine. Classification was performed for three target years 2000, 2013, and 2024 based on four dominant land cover types observed in the study area: Closed woodland, Open woodland, Agriculture, and Water body (Table 2). Training samples were digitized using visual interpretation of Landsat composites alongside high-resolution Google Earth imagery. A total of 100 sample points were collected for each class and randomly split into 70% for training and 30% for validation. Ground truth data obtained from field surveys comprising 8 georeferenced points representing the land cover classes were incorporated to support classification consistency and accuracy. Classification accuracy was assessed using the confusion matrix approach, reporting both overall accuracy and the Kappa coefficient, following the method described by [45]. Final classified maps were exported to Google Drive for post-classification analysis.
|
2.2.4. Anthropogenic Drivers Data Collection
- Data were collected from 71 systematically established rectangular plots (20 m × 40 m; 0.08 ha each) within Mkuti Forest Reserve to assess the impact of anthropogenic disturbances on forest cover change. The plot size was adopted based on common practices in forest disturbance and degradation studies in Miombo woodlands [30]; [50]. Plots were laid at 2.5 kilometer intervals along transects, with the transects themselves also spaced 2.5 kilometers apart [11]. Within each plot, field observations recorded the presence and intensity of disturbance indicators, including: number of tree stumps (reflecting logging intensity), presence of charcoal kilns, signs of fire/burning, farm encroachment, grazing activity, and evidence of illegal logging. A four-point Likert scale was applied to each disturbance indicator to assign a standardized score: None (0), Low (1), Moderate (2), and High (3), following the approach used by [31]. Additionally, spatial data were collected using a handheld GPS device to determine the distance of each plot from the nearest road, settlement, and forest conservation office.
2.3. Data Analysis
- Land cover classification results were exported to QGIS version 3.40.6 [42]. For post-classification processing and change detection. The Semi-Automatic Classification Plugin (SCP) was used to generate cross-tabulation matrices to assess land cover transitions between 2000–2013 and 2013–2024. Spatial distribution maps of the observed changes were produced to visualize the dynamics across the Mkuti Forest Reserve. To quantify the annual rate of land cover change for each class, the logarithmic formula from [38] and [29] were applied:
 Where A2 and A1 are the land cover class areas at the end and the beginning, respectively, of the period being evaluated, and t is the number of years spanning that period (2013–2000= 13, 2024-2013= 11).Descriptive statistics were used to summarize disturbance levels (None, Low, Moderate, and High) across plots. A Pearson correlation matrix was generated to explore associations between the disturbance index and individual anthropogenic variables, with the results visualized using a heatmap. Finally, examine the relationship between anthropogenic disturbances and the loss of closed woodland, a multiple linear regression analysis was conducted. The dependent variable was Closed Woodland Loss, while the independent variables included Stump Count, and binary indicators for Charcoal Kilns, Burned Areas, Farm Presence, Grazing Signs, and Illegal Logging, as well as two spatial variables: Distance to Village and Distance to Conservation the lm () function in R software version 4.4.2 [43].
3. Result
3.1. Land Cover Map and Change Between 2000, 2013 and 2024
- Four land cover classes: closed woodland, open woodland, agriculture, and water body were identified for the years 2000, 2013, and 2024 (Figure 2). In 2000, closed woodland occupied the largest proportion (46.48%) of the total study area, followed by agriculture (25.18%), open woodland (23.72%), and water bodies (4.62%). By 2013, closed woodland declined sharply to 4.34%, while open woodland increased substantially to 46.62%, agriculture expanded to 42.44%, and water bodies grew to 6.60%. By 2024, agriculture became the dominant class at 43.90%, open woodland slightly decreased to 41.96%, closed woodland slightly increased to 5.17%, and water bodies continued to rise to 8.97%. Overall, between 2000 and 2024, there was a dramatic decline in closed woodland, a significant increase in agriculture and water bodies, and a notable expansion of open woodland (Figure 2).
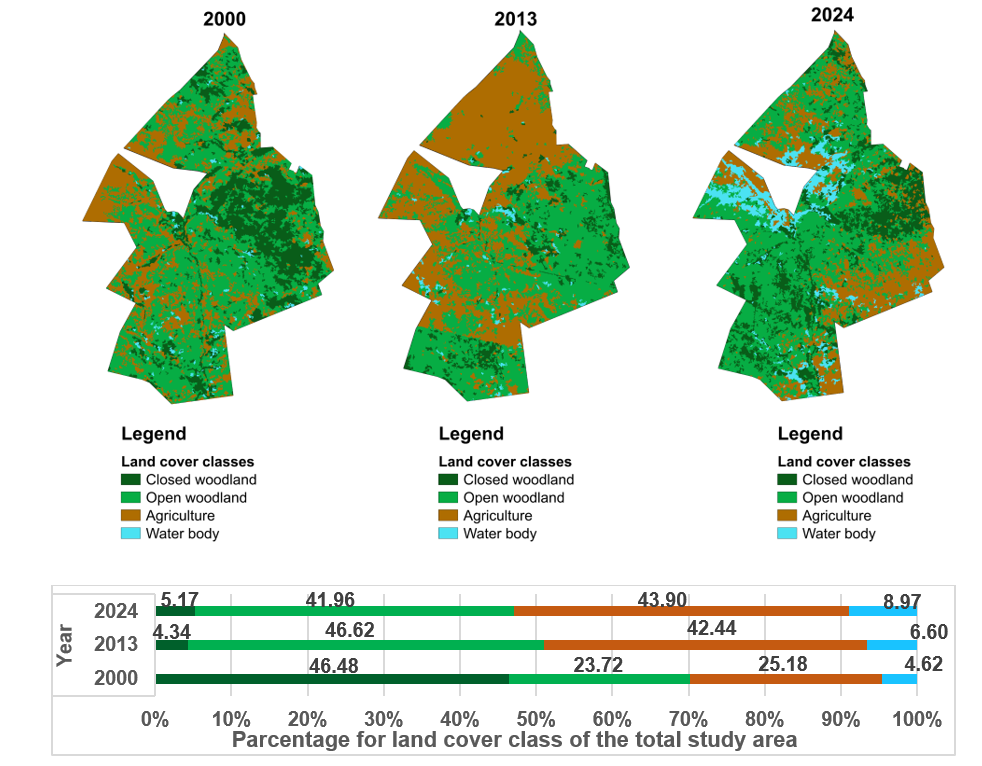 | Figure 2. Land cover maps and change between 2000, 2013, and 2024 showing the spatial distribution and relative proportions (%) of closed woodland, open woodland, agriculture, and water bodies |
3.1.1. Accuracy of Land Cover Classification
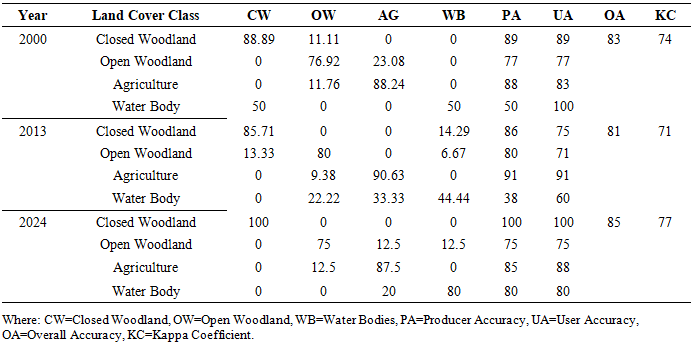
- In 2000, 2013, and 2024, the land cover classifications achieved overall accuracies (OA) of 83%, 81%, and 85%, respectively as compared to Global range of 73.4 to 83.4%, with corresponding Kappa coefficients (KC) of 0.74, 0.71, and 0.77. The average producer accuracies (PA) were 89%, 86%, and 100%, while the average user accuracies (UA) were 89%, 75%, and 100% for the respective years (Table 3). Agriculture experienced the highest classification confusion in 2000, particularly with open woodland, as reflected in its lower producer and user accuracies. In 2013 and 2024, agriculture showed improvements but remained commonly confused with open woodland. Closed woodland, open woodland, and water body classes consistently exhibited higher classification accuracy and lower confusion across all years (Table 3).
|
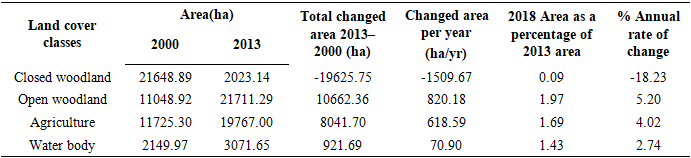
3.1.2. Rate of Land Cover Change between 2000-2013, and 2013-2024
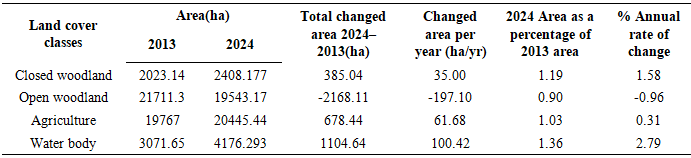
- Between 2000 and 2013, the most dramatic change was observed in closed woodland, which declined sharply with the highest annual loss rate of −18.23%, while open woodland recorded the highest gain in area (Table 4a). Agricultural land also expanded substantially during this period. In the subsequent period (2013–2024), water bodies exhibited the highest proportional increase (2.79% per year), whereas open woodland showed the greatest decline, reversing its earlier gain. Agriculture continued to grow, though at a much slower rate, while closed woodland showed slight recovery (Table 4b).
|
|
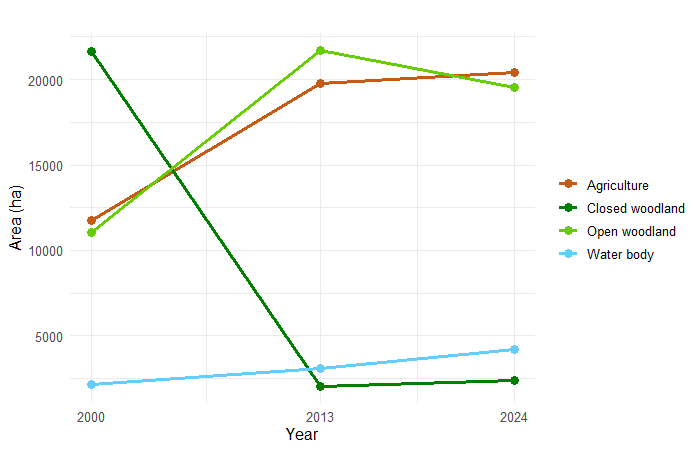 | Figure 3. Trend of change in land cover classes between 2000, 2013, and 2024 in the study area |
3.2. Summary of Anthropogenic Disturbance by Category
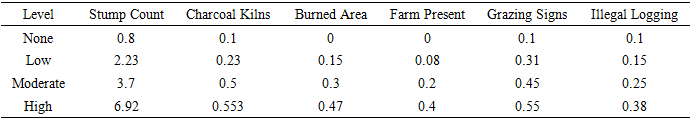
- Table 5 summarizes the average intensity of anthropogenic activities across disturbance levels. Stump count, a proxy for logging pressure, increased progressively from 0.8 in plots with no disturbance to 6.92 in highly disturbed plots. Similar trends were observed for the presence of charcoal kilns, burned areas, farm encroachment, grazing signs, and illegal logging. Notably, the average presence of charcoal kilns rose from 0.10 in undisturbed plots to 0.553 in highly disturbed plots.
|
3.2.1. Correlation Analysis of Anthropogenic Driver
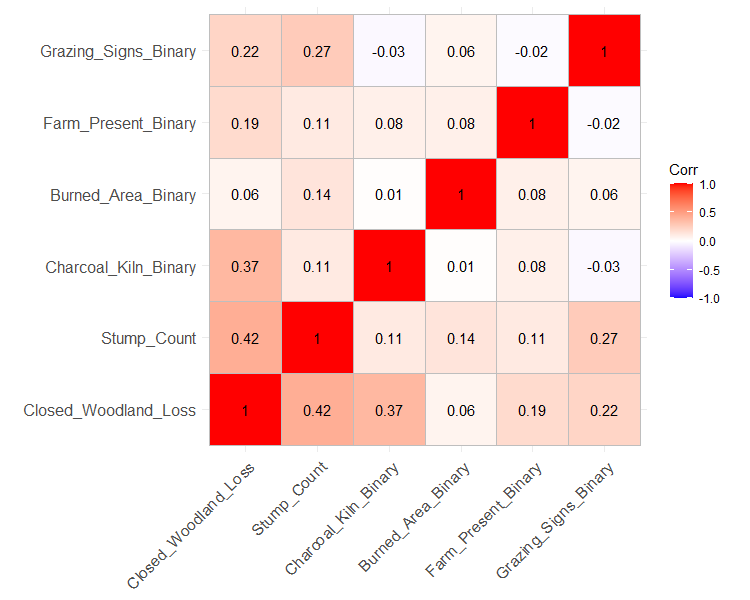
- Pearson correlation analysis showed that closed woodland loss was moderately correlated with stump count (r = 0.42) and charcoal kiln presence (r = 0.37). Farm presence (r = 0.19), grazing signs (r = 0.22), and burned areas (r = 0.06) exhibited weak correlations with closed woodland loss (Figure 4).
 | Figure 4. Correlation matrix of anthropogenic variables with the disturbance index |
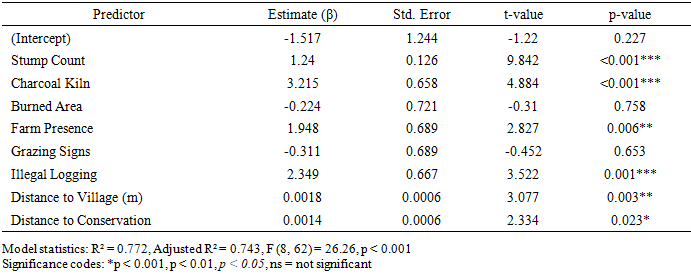
3.2.2. Regression Analysis of Anthropogenic Drivers on Closed Woodland Loss
- The multiple linear regression model incorporating eight anthropogenic variables was statistically significant (F₈, ₆₂ = 26.26, p < 0.001), with an R² of 0. 772.Stump count (β = 1.240, p < 0.001), charcoal kiln presence (β = 3.215, p < 0.001), farm presence (β = 1.948, p = 0.006), illegal logging (β = 2.349, p = 0.001), distance to village (β = 0.0018, p = 0.003), and distance to conservation office (β = 0.0014, p = 0.023) were statistically significant predictors (Table 6). Burned area (p = 0.758) and grazing signs (p = 0.653) were not statistically significant at the 5% level.
|
4. Discussion
4.1. Land Cover Dynamics and Temporal Shifts
- The observed land cover transitions in Mkuti Forest Reserve over the 24-year period reveal a clear pattern of anthropogenic pressure driving forest cover change, particularly the rapid loss of closed woodland and the consistent expansion of agricultural land. These dynamics mirror broader land use trends observed across Miombo woodlands in sub-Saharan Africa, where shifting cultivation, fire, and weak enforcement of conservation regulations have continually undermined forest sustainability [9];[18]. Between 2000 and 2013, closed woodland in Mkuti Forest Reserve declined at an alarming annual rate of −18.23%, with a total loss of over 19,600 ha, while agricultural land expanded at 4.02% per year. These rates are substantially higher than the national deforestation rate of 1.13% [27], the Sub-Saharan Africa average of 0.8%, and the global average of 0.15% [54]. Even compared to the 0.9% national rate reported by FAO for the same period [10], the deforestation rate in Mkuti is more than 20 times greater. This stark contrast likely reflects the intense localized anthropogenic pressure in Mkuti, whereas national-level statistics represent broader averages that mask such high-impact hotspots [28].Comparable observations have been made in the Katavi-Rukwa ecosystem, where [39] documented rapid conversion of woodland to farmland driven by fire, livestock grazing, and shifting cultivation. Also, [38] reported a loss of 2.3 million hectares of forests, bushlands, and grasslands in mainland Tanzania between 1995 and 2010, primarily due to agricultural expansion. Their study further identified Tabora, Mbeya, Rukwa, and Lindi as national deforestation hotspots, suggesting that Mkuti’s severe forest loss is part of a larger national pattern, though with unusually high intensity. The initial increase in open woodland between 2000 and 2013 may reflect the degradation of closed forest due to selective logging and charcoal production. However, its subsequent decline from 2013 to 2024 (−0.96% annually) indicates that even these degraded forest formations are now under increasing pressure, likely due to continued agricultural encroachment. This finding aligns with [14], who noted that without intervention, degraded Miombo woodlands often serve as transitional phases toward full agricultural conversion.Interestingly, between 2013 and 2024, a modest increase in open woodland (2.77% annually) and a slight reduction in agricultural land (−2.69%) may signal localized land abandonment or passive natural regeneration. This trend echoes observations by [16] in the Malagarasi Basin, where vegetation recovered in formerly cultivated landscapes. Nevertheless, the continued decline in closed woodland, albeit at a slower rate, suggests that such regeneration is largely secondary succession or degraded woodland, rather than full ecological restoration. As [36] emphasized, open woodland often lacks the structural and functional integrity of original closed forest ecosystems. The increase in water bodies from 4.62% in 2000 to 8.97% in 2024 could result from natural hydrological processes or the construction of artificial water sources such as fishponds and reservoirs. However, it may also indicate increased surface runoff and erosion associated with forest clearing trends reported in other degraded catchments as reported by [4].Finally, the accuracy assessment shows that the land cover classifications were reliable, with overall accuracy scores ranging from 81% to 85%, and Kappa coefficients from 0.71 to 0.77. However, the persistent confusion between open woodland and agricultural land, particularly in earlier years, highlights the challenge of mapping spectrally similar land cover types in dynamic forest-agriculture mosaics an issue also reported by [35] in many miombo woodland ecosystem of Tanzania.
4.1.1. Spatial Trajectories of Land Cover Conversion
- The land cover trajectory refers to the sequence of transformations that a specific land area undergoes over time, shifting from one land cover type to another. Analysis in Mkuti Forest Reserve revealed a common pattern of deforestation and degradation, which is typical of Miombo ecosystems in Tanzania. Between 2000 and 2013, a substantial proportion (9.73%) of closed woodland was converted to agricultural land, and between 2013 and 2024, a further 10.91% transitioned to open woodland. These conversions signify not only the initial removal of forest for cultivation but also subsequent land abandonment or secondary regeneration into less dense, often degraded woodland. This trajectory echoes findings by [2] who noted similar post-cultivation regeneration patterns in central Miombo woodlands, where open woodlands emerged with reduced biodiversity and limited productivity. The declining persistence of land cover classes from 25.54% in the first period to 24.37% in the second indicates increasing land-use dynamism and instability, suggesting recurring land cover conversions and lack of long-term ecological stability. Comparative national-scale analysis by [37] similarly found that woodlands were the most deforested forest type across mainland Tanzania during 1995–2010, largely driven by accessibility, proximity to infrastructure, and socioeconomic pressures. The authors noted that woodland loss was particularly pronounced in unprotected areas near roads and towns patterns consistent with the Mkuti Forest Reserve, which faces intense anthropogenic pressure due to its accessibility and absence of strong protective enforcement. Furthermore, their study emphasized that population density and regional GDP had a significant positive correlation with deforestation, underscoring the role of both subsistence and commercial land conversion in driving forest loss.
4.1.2. Anthropogenic Drivers of Forest Cover Change in Mkuti Forest Reserve
- The pattern of anthropogenic disturbances observed in Mkuti Forest Reserve closely mirrors disturbance dynamics commonly reported in Miombo woodlands across Tanzania and southern Africa [2], [23] and [49]. Among the evaluated disturbance indicators, stump count emerged as the most frequent and statistically significant predictor of closed woodland loss. This strongly suggests intense logging pressure, corroborating the findings of [15], who documented that unregulated timber extraction and fuelwood harvesting particularly near settlements are the primary contributors to Miombo woodland degradation in central and eastern Tanzania. Charcoal kiln presence was also significantly associated with woodland degradation, a pattern consistent with the results of [20], who reported widespread forest loss due to charcoal production in the Morogoro and Iringa regions. Charcoal harvesting typically targets dense woodland stands, leading to severe canopy degradation and progressive structural simplification. This phenomenon was particularly evident in the highly disturbed zones of Mkuti Forest Reserve, where charcoal kilns were most prevalent. Farm encroachment also contributed significantly to forest loss in Mkuti, aligning with broader patterns observed in Miombo ecosystems. [33] highlighted the role of population pressure and the expansion of shifting cultivation as dominant drivers of deforestation in forest-adjacent villages. This is consistent with the present findings, which demonstrated elevated disturbance scores in plots exhibiting signs of agricultural activity. Illegal logging, another significant predictor, further underscores the impact of weak forest governance on woodland integrity. The findings are in agreement with [47], who noted that poorly patrolled reserves are more susceptible to unauthorized harvesting. In Mkuti, illegal logging was particularly prominent in plots located farther from the conservation office, supporting the hypothesis that limited enforcement correlates with greater forest degradationas reported by [26].In contrast, fire and grazing signs did not emerge as statistically significant predictors of woodland loss. While these factors are ecologically relevant in Miombo systems, their effects may be more context-specific and temporally variable. For instance, [24] examined fire regimes in Miombo landscapes of central Mozambique and found that vegetation remained resilient under moderate fire frequencies (≥4-year return intervals), with minimal long-term structural loss. This suggests that, although fire can influence regeneration and composition, it may not serve as a primary driver of canopy loss unless coupled with other disturbances such as logging or drought. Similarly, grazing impacts are likely dependent on intensity, seasonality, and interactions with other land uses, potentially explaining their weaker statistical influence in the present study. Spatial patterns further revealed a clear disturbance gradient associated with proximity to human settlements. Plots located closer to villages and farther from conservation offices exhibited higher levels of disturbance, indicative of accessibility-driven degradation. This finding is consistent with [46], who reported that Miombo woodlands within a 2–5 km radius of settlements in Katavi and Mbeya regions were disproportionately affected by illegal extraction and agricultural expansion.Collectively, these findings emphasize the urgent need for localized and participatory forest management interventions. Notable success has been documented in community-managed Miombo reserves such as Duru-Haitemba and Mgori in Tanzania, where Participatory Forest Management (PFM) initiatives significantly reduced illegal activities and promoted forest regeneration [4]. Adopting similar governance models in Mkuti particularly in high-risk zones adjacent to villages could offer a practical pathway to mitigating anthropogenic pressure and facilitating ecological recovery.
4.2. Correlation Analysis of Anthropogenic Driver
- The correlation analysis was conducted to determine the strength and direction of relationships between anthropogenic drivers and the forest disturbance index in Mkuti Forest Reserve. Figure 4 shows that stump count and charcoal kiln presence have the strongest positive correlations with the disturbance index (r ≈ 0.42 and r ≈ 0.37, respectively), indicating that extraction activities are closely associated with higher disturbance levels in Mkuti Forest Reserve [7]. This pattern is consistent with field-based studies across Miombo systems that identify selective logging and charcoal production as immediate proximate causes of canopy loss and structural simplification [6].In contrast, farm presence, grazing signs, and burned areas exhibit weaker positive correlations (r ≈ 0.19, 0.22 and 0.06 respectively), suggesting that while these processes occur in the landscape, their direct linear association with the disturbance index is smaller or more variable [13]. This weaker relationship for agriculture and grazing is well documented in recent regional analyses which show that agriculture often drives permanent land-cover conversion (clearance for cropping) while grazing and fire exert more complex, sometimes nonlinear, influences on vegetation structure that depend on intensity, seasonality and interactions with other disturbances [21].The relatively modest correlation between burning and the disturbance index (r ≈ 0.06) does not imply fire is ecologically unimportant; rather, it suggests that the role of fire in this dataset is dependent. In many Miombo landscapes, recurrent low-intensity fires influence species composition and regeneration trajectories but do not always produce immediate canopy loss detectable as stump counts or kiln presence [24]. Where fire co-occurs with logging or conversion to agriculture it can accelerate degradation, but alone it can also facilitate some forms of woody regrowth under certain regimes commonly as weak simple correlations [34].The correlations also point multiple, interacting drivers rather than a single dominant cause: many deforestation and degradation events arise from combinations of activities example wood extraction to supply charcoal and fuel for farm expansion, which reduces the explanatory power of any single predictor in bivariate correlations [12]. Large-sample, multi-variable studies across Tanzania and neighbouring countries similarly find that agriculture, charcoal production and logging often act together and that governance/enforcement and accessibility moderate their impacts [53]. Having close links between stump counts/charcoal kilns and disturbance there is need to intervene curbing illegal extraction through targeted patrols and market chain in controlling charcoal would likely reduce disturbance [8]. Meanwhile, addressing agriculture and grazing requires integrated livelihood alternatives and landscape-scale planning because these drivers operate through socio-economic dynamics and land-use decisions that simple enforcement cannot alone resolve [55].
4.3. Effect of Population Density and Regional GDP Correlation with Deforestation
- The results of this study indicate that both population density and regional economic growth have significantly influenced deforestation around Mkuti Forest Reserve. The forest borders thirteen villages in the wards of Muzye, Bugaga, Kigembe, Rusesa, Kwaga, Kalela, Nyumbigwa, Rungwe Mpya, Ahsante Nyerere, Basanza, and Kazuramimba, which collectively host 177,304 people of the 537,767 residents in Kasulu District and 2,470,967 in Kigoma Region [55]. The high concentration of population in these villages has increased pressure on land and forest resources, manifested through the expansion of agricultural fields, extraction of fuelwood, and harvesting of timber for construction purposes [44]. These observations are consistent with findings across Tanzania, where rural population growth near forest boundaries is a major driver of forest degradation [17].In this study, high population density was associated with intensified forest encroachment, as communities expanded agricultural land to meet growing food and energy needs. Similar trends have been documented across the miombo woodlands of western Tanzania, where population pressure nearby protected forest reserve has accelerated shifting cultivation and unsustainable charcoal production [38].Economic growth in Kigoma Region, largely driven by agriculture, informal trade, and resource extraction, also influenced forest dynamics. In low-income economies such as Tanzania, increases in regional GDP often correlate positively with deforestation because economic expansion relies heavily on land- and forest-based resources [1]. In the study area, however, regional income remains low, and economic growth has not yet shifted towards sustainable practices. Expansion of agriculture and forest product trade continues to intensify pressure on Mkuti Forest, particularly for charcoal and timber extraction [5].These findings suggest that both demographic pressure and resource-driven economic growth are important drivers of deforestation around Mkuti Forest Reserve. Mitigating these pressures requires integrated strategies that combine effective land-use planning, alternative livelihood development, and strict enforcement of sustainable forest management practices to balance economic development with ecological conservation.
5. Conclusions and Recommendations
- Mkuti Forest Reserve has experienced significant land cover change and degradation between 2000 and 2024, with closed woodland declining from 46.48% to 5.17%, while agricultural land and open woodland expanded. The most severe loss occurred between 2000 and 2013, driven primarily by logging, charcoal production, farm encroachment, and illegal timber extraction. Fire and grazing had limited direct impact, while proximity to villages and weak enforcement intensified disturbances. These trends reflect broader patterns in Miombo ecosystems, where human pressure and limited governance accelerate forest degradation.The study highlights the urgent need for sustainable management interventions, including strengthened forest protection, participatory community management, alternative livelihoods, and restoration of degraded areas. Integrating remote sensing with field assessments proved effective in identifying spatial patterns of forest loss, offering a practical approach for long-term monitoring and evidence-based planning to conserve Mkuti Forest’s ecological integrity, hydrological function, and biodiversity under increasing anthropogenic pressure.
ACKNOWLEDGEMENTS
- The authors gratefully acknowledge the Tanzania Forest Services Agency (TFS) for providing financial support for this study. Appreciation is also extended to the District Forest Conservator of Kasulu for granting research permission in Mkuti Forest Reserve (MFR) and for his collaboration during data collection. We sincerely thank the forest rangers of Mkuti Forest Reserve for their field guidance and assistance with data collection. Special recognition goes to Mr. Iddi Beya, a local botanist, Mr. Dulla Kilasi, the driver, and the two Pangaman, Mwita Matiko and Ibrahimu Sintotuma, for their invaluable support throughout the fieldwork.
Appendix 1