E. C. Merem 1, Y. A. Twumasi 2, S. Fageir 3, D. Olagbegi 1, J. Wesley 1, R. Coney 1, Y. Babalola 1, T. Thomas 1, A. Hines 4, G. Hirse 4, G. S. Ochai 5, E. Nwagboso 6, M. Crisler 1, S. Leggett 7, J. Offiah 1, S. Emeakpor 8
1Department of Urban and Regional Planning, Jackson State University, 101 Capitol Center, Jackson, MS, USA
2Department of Urban Forestry and Natural Resources, Southern University, Baton Rouge, LA, USA
3Department of Social Sciences, Alcorn State University, 1000 ASU Drive, Lorman, MS, USA
4Department of Public Policy and Administration, Jackson State University, 101 Capitol Center, Jackson, MS, USA
5African Development Bank, AfDB, 101 BP 1387 Avenue Joseph Anoma, Abidjan, AB 1, Ivory Coast
6Department of Political Science, Jackson State University, 1400 John R. Lynch Street, Jackson, MS, USA
7Department of Behavioral and Environmental Health, Jackson State University, 350 Woodrow Wilson, Jackson, MS, USA
8Department of Environmental Science, Jackson State University, 1400 John R. Lynch Street, Jackson, MS, USA
Correspondence to: E. C. Merem , Department of Urban and Regional Planning, Jackson State University, 101 Capitol Center, Jackson, MS, USA.
| Email: |  |
Copyright © 2024 The Author(s). Published by Scientific & Academic Publishing.
This work is licensed under the Creative Commons Attribution International License (CC BY).
http://creativecommons.org/licenses/by/4.0/

Abstract
The Pacific Northwest region of the US has over the years, outpaced other zones in the country in every socio-economic indicator. Known for its enviable physical attributes of high montane ecosystem and warm weather all year round in some places together with abundant biodiversity. The region’s position as among the fastest growing areas in the nation under vast swaths of land with large population concentration in big cities has made it the perennial destination for many. Aside from all these, in the last several years, the zone continues to be the epicenter of the most dangerous natural disasters prompted by changing climatic parameters from high aridity, bush fires, and sometimes isolated patches of irregular heavy rainfall and periodic snowstorms. Additional risks embody subzero and elevated temperature and the warming of the atmosphere. Accordingly, this changing climatic trend coincides with recurrent fires, damage to agriculture, forestry as well as very deadly threats, to the extent that both human and natural ecosystems have come under serious degradation at disturbing rates. This involves mounting concerns over air quality, deaths, water scarcity, the drying of wells, plumes of smog and economic losses. In as much as, all these are attributed to socio-economic, physical, economic and factors. Very little has been done in the literature to fully assess the risks posed to the western region’s environment by changing climate through a mix-scale model. Notwithstanding current efforts of institutions to remedy the situation to no avail. This study will fill that void in the literature by assessing the state of climate change in the US Pacific Northwest region. Emphasis is on the issues, trends, factors and efforts and impacts. With results showing the occurrence of change and recurrent pressures of climatic parameters in the study area. The zone saw increased temperature, aquifer declines, heavy fire outbreaks and ecosystem degradation as well as loss of economic assets and displacement of citizens. The fact that the impacts of change in the zone are manifested notably. The GIS mapping of the trends points to gradual diffusion of climatic risks over different areas in space. These changes are attributable to a host of forces from policy to the economy and the physical environment. The paper proffered solutions in the form of education, enforcement of regulations, the design of regional climate information systems and the installation of advanced early warning systems to alert citizens of impending dangers and risk monitoring.
Keywords:
Climate change, Risks, Policy, Factors, Impacts, Ecosystem, Degradation
Cite this paper: E. C. Merem , Y. A. Twumasi , S. Fageir , D. Olagbegi , J. Wesley , R. Coney , Y. Babalola , T. Thomas , A. Hines , G. Hirse , G. S. Ochai , E. Nwagboso , M. Crisler , S. Leggett , J. Offiah , S. Emeakpor , The Effects of Changing Climate in the US Western Region, International Journal of Ecosystem, Vol. 13 No. 1, 2024, pp. 1-19. doi: 10.5923/j.ije.20241301.01.
1. Introduction
The Pacific Northwest Region of the US has over the years [1], outpaced the other zones in the country in every socio-economic indicator [2,3]. Known for its enviable physical attributes of high montane ecosystem and warm weather all year round in some places together with abundant biodiversity [4]. The region’s position as among the fastest growing areas in the nation under vast swaths of land with large population concentration in big cities has made it the perennial destination for many [5]. Aside from all these, in the last several years, the zone continues to be the epicenter of the most dangerous natural disasters. This has been prompted by changing climatic parameters from high aridity, bush fires, and sometimes isolated patches of irregular heavy rainfall and periodic snowstorms. Additional risks encompass subzero and elevated temperature and the warming of the atmosphere [6]. Accordingly, this changing climatic trend coincides with recurrent fires, damage to agroforestry as well as very deadly threats, to the extent that, both human and natural ecosystems have come under serious degradation at disturbing rates. This involves mounting concerns over air quality, deaths, water scarcity, the drying of wells, plumes of smog and economic losses [7-16]. Regarding the distribution of fatalities during the August of 2021 heat wave debacle [7]. The sad scenes at hospital emergency rooms were quite horrifying and traumatic in the Seattle metro area. In these places, as the baking temperature scale soared, the gravity of the intense heat was fully felt as the bodies of victims and identifications pointing to diverse range of demographics spread across, gender, age groups of 18-80 and various ethnicities from blacks to whites. This indicates that climate disasters do not respect socio-economic strata [17-21]. Being a place fraught with mega floods now and many more projected to come under “the next big one” notation. At one time, the US western region and the states had seen and endured the extremities of about 100 wildfires, draping vast swaths of areas in the Pacific Northwest coastal zone in fume. As of 2022, current studies showed how climate induced shifting in the ecosystem within major streams impacting California is becoming an impediment. This has increased the possibilities of mega floods by 50%. While this could entail 100 inches (250 cm) of heavy precipitation and monthly snow melts from the mountain estimated at 25 to 34 feet (7.6 to 10.4 m) in the Sierra Nevada. The projected runoff over time in case of any looming violent storm scenario could reach 200 to 400% above historical levels within the Sierra Nevada. With sea level expected to rise by 2050 in the zone, inactions towards mitigation measures to reduce emission, by 2100, will accelerate further rise by 3.5-7 feet (1.1-2.1 m) [22-27] Against that background, over the last century, the mean yearly temperature in the Pacific Northwest rose by 1.3°F amidst water deficits [28,29]. In that way, temperatures are likely to rise by almost 3°F to 10°F at the end of the century, with much of the biggest surges anticipated in the summer. Accordingly, the latest heatwave that baked the US Pacific Northwest in 2021 not only pushed up temperature records in cities from Seattle to Portland but laid to rest the perception of the zone as safe paradise from the ravages of the climate crisis. Unmatched temperatures roasted the zone, as a succession of heatwaves pummelled the land that scorched US west, from Montana to southern California in the summer of 2021. With time, the “heat dome” that encircled over the zone in Seattle resulted in 108F (42.2C), shattering the prior record by 3F (1.7C), as Portland Oregon, posted another record of 116F (46.7C). With the hotness in most inland areas at 118F (47.8C) [30]. Being the most dangerous climate events chronicled globally. During the period, the zonal mean daily maximum temperature stood almost at 30°F warmer than the average of the warmest 3 months over the last 10 years, while the peak temperature was 61°F warmer. Given that the Pacific North-west has warmed at an average of 2°F (1.1C) in the last century, with rising wildfires, drops in coastal fisheries, thinning snowpack and growing aridity devastating a zone usually unready to absorb these limits. This is prompting meagre flow of water into reservoirs like Lake Oroville in Northern California. In the zone, groundwater volumes continue to drop over the years in several areas in the West coast including California’s San Joaquin Valley and the Ogallala Aquifer within the High Plains region. Additionally, tens of millions of plants have also perished in the Rocky Mountains in almost 2 decades, on a place as big as Colorado. With all these attributed to climate-driven siege of tree-killing insects, wildfires, and stress from global warming and aridity. California endured the destruction of over 129 million trees in a similar fashion as well. In as much as, these incidents emanate from socio-economic, physical, economic and factors [31-35]. For that, consider the current pace of energy related CO2 emissions from 2000-2016. Note how Green House Gas emission levels across some of the states and sectors of the economy has been driving up the trends from Alaska, California, Oregon to Washington. There is also the frequency of events involving wildfires and the acreages torched [36]. In all these, very little has been done in the literature to fully assess the risks posed to the western region’s environment by changing climate through a mix-scale model [37-40]. Notwithstanding current efforts of institutions to remedy the situation. Climate change risks as major persistent concerns, now require a mix scale analysis [41-44]. The study will fill that void in the literature by assessing the state of climate change in the US Pacific Northwest. Emphasis is on the issues, trends, factors and efforts and impacts. From the study, five principal objectives driving the enquiry exist. The primary aim consists of the use of geo-spatial technology to analyze the status of climate issues and changes, whereas the second aim offers a support tool for policy makers. Along those lines, the third goal stresses the design of a new method for delineating climate change index. The fourth objective is to create a framework for regional ecological impact analysis with mix scale techniques while the fifth objective is to assess climate risk trends. The study covers five sections consisting of introduction, methods, results, discussions, and conclusion.
2. Methods and Materials
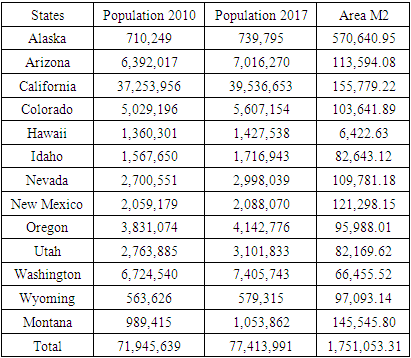
The study area Pacific Northwest region [Fig. 1] which stretches over 13 states, is the nation's most ecologically beautiful landscape dazzling with natural opulence. For that, the common notion of the Northwest rests on its perception as an ecozone containing substantial Pacific shoreline under recurrent wet weather situation. Being near the Cascade Mountain Range stretching north south through Washington and Oregon, at the center of contrasting climate along the western and eastern flanks of the range. The Western portions of the foothills, have mild temperatures throughout the wintertime, that are exceedingly damp, and arid in the summer periods. Further along the East of the mountains is a landscape characterized predictably by sunny and arid conditions evident in the cold winter and warm summers [45,46,47]. With a population of more than 77 million in 2017, on large swath of land spanning over an area of 1,751,053.31 miles to 28,913 miles in shorelines [48,49]. Recurring hydrological patterns therein shapes the life cycle of the region’s plants and animals. This involves symbolic salmon and steelhead, and woodland ecosystems, covering 47% of the topography. Aside from the thousands of miles in coastlines, regional financial hubs, portions of the study areas have diverse habitats and ecosystems sustaining thousands of varieties of fish and animals, involving commercial fish and crawfish assets worth $480 million in the period 2011. Considering the nature of the ecology, some of its cities (Portland, Eugene, and Seattle were ranked among the top eight greenest cities in the country [10]. Situated along the Cascadian subduction zone (CSZ) [11], some of the states in the region have a nationally ranked population density attributes that are represented within the top 27 in the US (Table 1).Table 1. Population of The Study Area in 2010-2017 and The Size
 |
| |
|
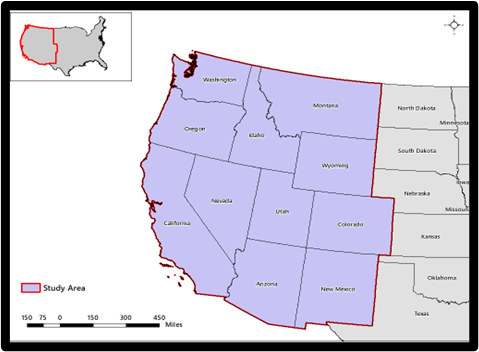 | Figure 1. The Study Area: Pacific Northwest Zone |
Surrounded by stony coastlines, mountains formed by volcanic eruption, and high alluring deserts, the Northwest’s sophisticated and dappled topography, enriches the zone’s iconic “climatic, geographic, social, and ecological diversity”. Accordingly, rich natural resources in the form of lumber, fishing, fertile soils, and ample water serve useful purpose to the zone’s wealth. In a setting where the accrued ice buildup in the foothills, melt down in the spring to drive both the region’s streams and markets, indispensable in generating adequate hydroelectricity (40% of US overall). The power loads in output from the hydro amounts to about 2 to 6 million megawatt hours monthly in exports to other places. Just as runoff from snowmelt irrigates farm items deep in the arid inland. This aids the region’s capacity to harvest tree fruit (ranked highly at number one globally) coupled with nearly $17 billion value in farm supplies, comprising of 55%, 15, -11% in wheat, and milk output in the United States [50].Yet, the Pacific Northwest not only warmed up at a mean of 2°F over time, but many coastal areas have been exposed to sea level rise, including California where 60% of beaches are now at a risk of submergence due to surge in sea level (Fig1a-1b). Given the shifts in climate therein, the mean yearly temperature in the zone grew by around 1.3°. With Northwest now faced with lasting global warming. The yearly mean temperature at elevated scales, since 1900 in Idaho, Oregon, and Washington, as well as Alaska resulted in a heating up of the surroundings. This trend seems much quicker than in any other state, by 3°F going back to the levels in the mid-1920s. Since most of the warmest seasons over the years on record have happened in the past two decades in the Northwest. The region saw more snow melts as the impact of climate change remains evident [51-53]. Together with the weight of climate, anthropogenic actions have modified natural ecosystems, quickened exposures of species to dangers, and removed vast quantity of water. It is currently fuelling disputes between various users during periods of intense drought. Because of all these, measures have increased to ensure integrated approach that blends both ecological renewal and economic expansion while assessing climate dangers. In the face of open disagreements and recurse to growing adjustments or compromise, the region’s population stays on high levels as the impacts of climate change accelerates. The search for remedies has emerged progressively far more critical. In the process, the Northwest’s economy, infrastructure, natural ecosystems, health services, and fundamentally significant sectors are all threatened. These key climate change induced hazards merits analysis using mixscale approach [54-58].
2.1. Methods Used
The paper uses a mix scale approach involving descriptive statistics and secondary data connected to GIS to assess the changing climatic parameters together with the related issues in the Pacific Northwest region of the US over the last couple of years. The spatial information for the enquiry was obtained principally from several agencies consisting of the United States Department of Energy (US DOE), The United States Energy Information Administration (US EIA), the United States Geological Survey (USGS) and the University of Washington. Other sources of spatial info originated from the Federal Emergency Management Administration, The National Oceanic and Atmospheric Administration (NOAA), The National Agency for Space Administration (NAASA), the United States Bureau of Ocean Energy Management, Tetratech and Natural Resources Defence Council. In addition to that, Climate Central, Accucentre, University of Oregon, NAASA Observatory, Yale Program on Climate Communication, the National Weather Center and the West Gulf River Forecast Center also offered other essential information in the research. Generally, the US Forest Service, United States Center for Diseases and Control for the most part were also major sources of data. Climate risks indices relevant to the Pacific Northwest region and the counties were obtained from the Oak Ridge National Laboratory, the US Army Corps of Engineers, The City of Portland, the US Department of the Interior (DOI) and the Environmental Defence Fund and City of Seattle for some of the years.Essentially, group entities made up of Forbes magazine, Business insider, Reuters, Gavop, the US Census, The US Department of Agriculture and Natural Resources Conservation Service, provided the secondary data highlighting sea level rise, hurricane hazards and vulnerable coastal zone tracts while the US Department of Energy, US Energy Information Administration and US Department of Interior, Bureau of Land Management, the Pacific Water Institute and the USGS ensured data access to ranking, averages and totals of capacity, percentages and water wells, volume of water as well as the county and state level usage. These same organizations also offered the time series data and physical information on variables in the major states highlighting the potentials and risks in the region. Pertaining to additional data needs, NASA, UC Davies climate cool data system, National Weather Service, CoreLogic, Purdue university, and National Hurricane Center (NHC) were respectively critical in the procurement of information on the availability of rain data, houses threated by floods, costs of hurricane damage, average domestic Carbon footprint and CO2 emissions by cities highlighting the vulnerability to changing climate. Elsewhere, the government of the state of California and Washington state Conservation Commission added deeper insights on emission budgets from the sectors, while the US Environmental Protection Agency, Natural Resources Defense Council, The Portland General Electric, the US Forest Service, the Western Departments of Environmental Quality, Tetra Tech, Intergovernmental Panel on Climate Change, and the Environmental Defense Fund were critical also on data related to hydrological stress. Give that regional and federal geographic identifier codes of the states were used to geo-code the info contained in the regional data sets. This information was processed and analyzed with basic descriptive statistics, and GIS with attention paid to the temporal-spatial trends at the national, state, and regional levels in Pacific Northwest. The relevant procedures consist of two stages listed below.
2.2. Stage 1: Identification of Variables, Data Gathering and Study Design
The initial step in this research involved the identification of variables required to analyze the extent and form of climate change trends, the impacts, factors, liabilities, damages, the risks indices, and parameters at the regional level from 2007 to 2018. The variables consist of socio-economic and environmental information, climate risks indicators, made up of sea and flood levels and years, ranks, volumes, percent, average, mean annual precipitation volume, mean low temperature, storm frequency, population by city living in a coastal zone. Others embody ten most dangerous wildlife fires and damages, percentage of properties at risk, change in energy related CO2,percentage change in emissions, acres burnt in wild life fire, number of wildlife fire outbreak by state, drought intensity, abnormally dry, moderate dry, severe drought, extreme drought, exceptional dry, historical summer average temperature, drought monitor, temperature of selected cities, solar radiation, precipitation, historical precipitation, below normal ground water levels well, all-time highs, below normal and much below normal, change in energy related CO2 emission.This is followed by total properties at risk by flood, risk level, CO2 emission levels and percentages at state and county levels, monetary costs of hurricane disasters are also listed, average annual rainfall and temperature, state energy related CO2, casualties from natural disasters, number of housing units, number of properties at risk, worst year insured wildlife losses, the population of the study area and sea level rise, socio-economic group, low income, age groups, flood vulnerable group 65 yrs older, no high school education, minority, global warming cumulative damage costs, damage costs with no adaptation, damage costs with adaptation, and sea level rise levels. In the same order comes other variables including CO2 emissions from wildlife in 2000-2022 for California, volume of emitted CO2, the percentage response to global warming exposure, comparison of exposures, the size of habitats burned by wildlife 2017-2021, and projected distribution of socially vulnerable group. Added to that are other variables consisting of extremely hot day time high temperature, the regional average daily maximum temperature, percent of heat related deaths by age, heat related death by ethnicity, the 10 most dangerous wildlife fires and the damages in 2021, number of housing units, number of properties at risk and the worst year in insured wildlife losses. These variables as mentioned earlier were derived from secondary sources made up of government documents, newsletters, and other documents from NGOs. This process was followed by the design of data matrices for socio-economic and climate risks variables covering the periods from 2007, 2010, 2014 to 2018. The design of spatial data for the GIS analysis required the delineation of county boundary lines within the study area as well. Given that the official boundary lines within the region and its counties remained the same, a common geographic identifier code was assigned to each of the states’ area units for analytical coherency.
2.3. Stage 2: Step 2: Data Analysis and GIS Mapping
In the second stage, descriptive statistics and spatial analysis were employed to transform the original socio-economic, energy and biogeoclimtatic data into relative measures (percentages, ratios, averages, and rates). This process generated the parameters for establishing, the extent of climate change, the impacts, factors, trends, frequencies, output in energy indicators, projections, and quantities, temperature, storm frequency, average annual rainfall and temperature, state energy related CO2, CO2 emission by counties, monetary costs of hurricane disasters prompted by unprecedented growth and the policy failures that emerged in the states and counties in the Pacific Northwest region through measurement and comparisons overtime. While the spatial units of analysis consist of counties, region, the boundary, and locations where changing climatic parameters, the growing frequency and projected, and current risks remain imminent. This approach allows the detection of change, while the tables highlight the actual frequency and impacts, rankings, temperature, intensity of rain and the trends as well as the economic costs. The remaining steps involve spatial analysis and output (maps-tables-text) covering the study period, using Arc GIS 11.0 and SPSS 29.0. With the spatial units of analysis covered in the region and counties (Figure 1), the study area map indicates boundary limits of the units and their geographic locations. The outputs and indicators for the state and counties were not only mapped and compared across time, but the geographic data for the units which covered boundaries, also includes ecological data of land cover files and paper and digital maps from 2007-2018. This process helped show the spatial evolution of location of various activities and the trends, the ensuing economic and environmental effects, potentials, benefits, as well as changes in other variables and factors driving climate change in the Pacific North West region.
3. The Results
This part of the analysis focuses on temporal and spatial analysis of the climate change dangers in the study area. Using descriptive statistics there is an initial focus on the analysis of rain fall and temperature snapshot, chronicle of key climate events that plagued the zone in nearly four decades. The other sections delve on the pollution audits. This is followed by the remaining portions of the section encompassing of an impact assessment, GIS mappings, and the classification of the factors fuelling changing climate in the Pacific Northwest region.
3.1. Green House Gas Emissions Among Selected States 2000-2022
In browsing at the temporal distribution of Green House Gas budget for the states, consider the tendencies concerning the occurrences between the periods 2006-2013. From only 8 of the 13 states listed in the area, and disparate annual data display on Green House Gases evident. California stands as the only state in the region with complete accessible info. Notwithstanding the limited access to complete regional Green Gas House data clearing house. The distribution of Green House emissions shows California accounted for complete and much larger share of the atmospheric discharge of noxious substances between the 2000-2022 when compared to the others. For that, the states with partial and complete information consists of Alaska, California, Colorado, Hawaii, Nevada, New Mexico, Oregon, and Washington. Drawing from available matrix, among the listed states, during the periods, 2000, 2005, 2007, 2010-2011. The Golden state posted GHGs emission levels of 461.9, 478.1, MT CO2e, - 484.7 MT CO2e, 442.3 MT CO2e, to 437.6 MT CO2e. In the process, just as during the periods 2014-2022 (2014, 2015, 2016, 2017, 2018, 2019, 2020, 2022) the emission values for California ranged from 428.2, 426.6, 414.4, to about 410.6, 411.0, 404. 5 and 369 MT CO2e in 2020-2022. In the case of other places, the Green House Gas emission budget for Alaska in the deep side of the Pacific Northwest, from 2010-2015 opened with 17,381,356-20,535,692, MT CO2e, during the periods 2010 and 2011, but it later stabilized by 18,225,754-18,570,170 MT CO2e in 2014-2015. Of great importance in the analysis is the temporal profile of Green House Gas emission trends in Colorado, given its proximity to the hot desert Southwest Ecosystem. Accordingly, from the initial fiscal years 2000, 2005, 2010, Colorado’s GHGs emission surged notably from 110, MT CO2e, 139.3, MT CO2e 150.19 MT CO2e to 130.9 - 126.1, MT CO2e from 2015 through 2019. Aside from this, one notices the gradual emergence of some level of stability over time in the zone, and as such, much of the GHGs emission patterns started showing some level of stability, considering the situation in the neighboring states of Oregon and Washington. Except for average emission volumes of 70.5 MT CO2e in 2000 and 2007, the rest of GHGs emission values in the state in 11 different years were at over 60 MT CO2e all through 2005, 2010 to 2019 as the average GHGs emission levels stood over 90 MT CO2e from 2000-2019.From the blazing heat triggered by elevated temperatures fueled by warming of the air. The sectors in the Pacific northwest especially the agricultural, industrial, and commercial hubs therein based on the scale of their operations from California (the 5th largest economy globally) to the Washington, all were visibly active emitters of Green House Gas. Just as the concentration of the Green House stressors in the atmosphere in the zone make these sectors legit players in managing the risks from extreme climate events. The Green House Gas emission indicators from transportation to commercial sector in two major states (Washington and California) in the Pacific Northwest region during 2019 and 2022 provides further insights. Therefore, to fully recognize the issue associated with growing risks from GHGs emissions in accelerating the dangers of changing climate in the study area, more can be fully gleaned from the tendencies statewide. This is based on how they are manifested among the sectors in the zone. Seeing that the state of New Mexico in the Southwest Desert ecozone discharged 75.6 Mt CO2e -113.6 Mt CO2e in Green House Gases into the atmosphere in 2015 and 2018. In the Washington state area where transportation and residential, commercial, and industrial heating ranked high in numbers 1-2 as sources. In 2019 they combined for 65.6% of all the regionally generated GHGs at the rate of 40.3 Mmt-25.3 MMT respectively. In the same order, electricity and others accounted for 21.9%-14.6% of state emissions (Figure 2). In California, from the distribution of emission rankings for 2020-2022, both transportation and industrial hubs were responsible 38%-23% of all emissions along with the rates for electricity generation and ago forestry at 9% in the same period, while residential and commercial generated 8-6% of the GHGs (Figure 2.1). 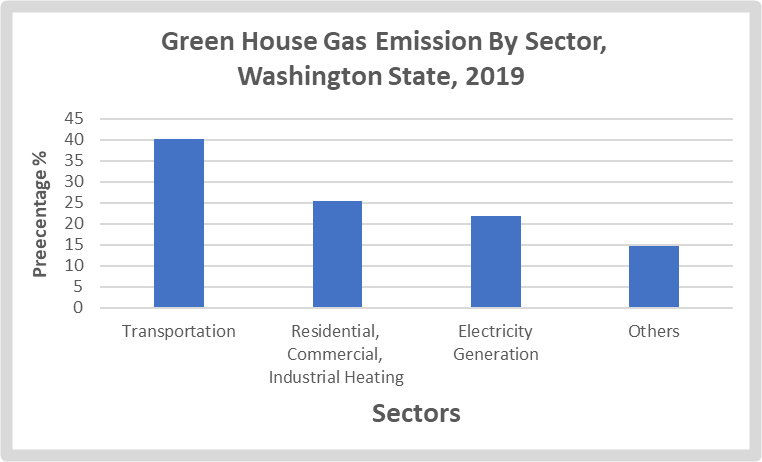 | Figure 2. Sectoral Greenhouse Gas Washington State 2019 |
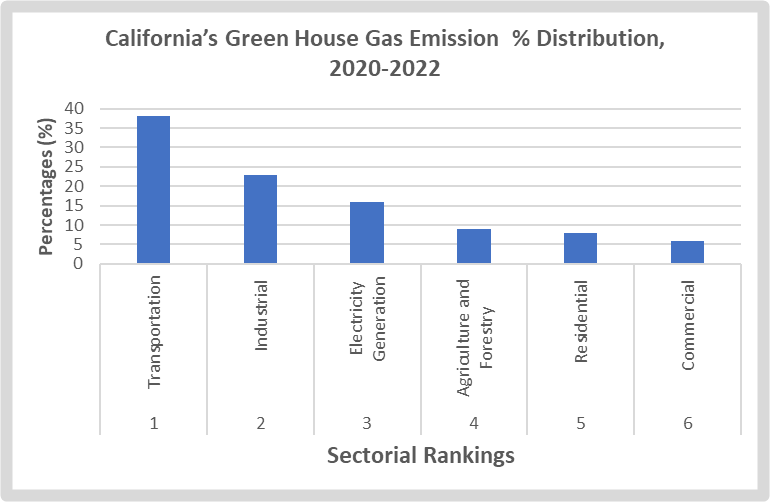 | Figure 2.1. California’s Greenhouse Gas Emissions 2020-2023 |
3.1.1. Energy Related CO2 Emission 2005-2016
The other dimension to the impacts of climate change in the study area of the Pacific Northwest region stems from exposures to energy related CO2 emissions particularly the fossil fuel side originating through various states. For that, the total regional values in energy related CO2 emissions in 2005-2016 for the study area showed opening budgets of 1053.1-1078.6, 997.4 MMT, 994.9 MMT in the first years of 2005-2007 to 2009-2010 for the Pacific Northwest. Over time, the emission proportions peaked at 1370.8 MMT by 2012 and then moved from 967.3 MMT -970.6 MMT to 961.1 at an average of 1049.22 MMT all through 2012-2016. Considering that the high propensity to hot air in the study area, especially the core west, has not really translated into a change in best management practices regarding energy related emissions over the years. About 4-5 states headlined by California, Utah, Arizona, Colorado, and Washington discharged more CO2 individually than the surrounding states in the zone. Further along these lines, the overall volumes of emissions in the context of energy related CO2 puts emission in California at much higher level that supersedes Arizona, followed by Colorado. Accordingly, in the pace of energy related CO2 emission, the Golden state posted the average of 367.53 MMT below regional mean value as at 2005-2016. The same can be said of Green House Gases in which California’s emission levels deemed the highest in the region, stood at 461.9-369 MT CO2 from 2000-2022. Over time in the state, during 2005, 2007, 2009, energy related CO2 discharge ranged from identical high levels of 383.8 MMT, 397.4MMT-368.1 MMT levels, until subsequent drops of 362.8, MMT 353.1, -352.9 MMT, 360.8 MMT -361.4 MMT kicked in all through the periods 2010, 2012, 2014, 2015 to 2016. In the case of the other four states, Utah’s emission levels of 114.8 MMT, even though behind the former, appears in similar CO2 emission levels just like in both Arizona and Colorado at 93.7 MMT -92.95 MMT while Washington follows up at 74,8 MMT. With all these has also come the percentage levels represented as mostly declines in 11 states from Alaska to Wyoming. Of these states, Alaska and Nevada accounted for the highest levels of declines in the energy related emissions of relatively identical proportions of -27.60%-26.50%. This is followed by mixed gains of only 4.10% -16.3% in two states, most notably Washington and Idaho (Figure 2.2). 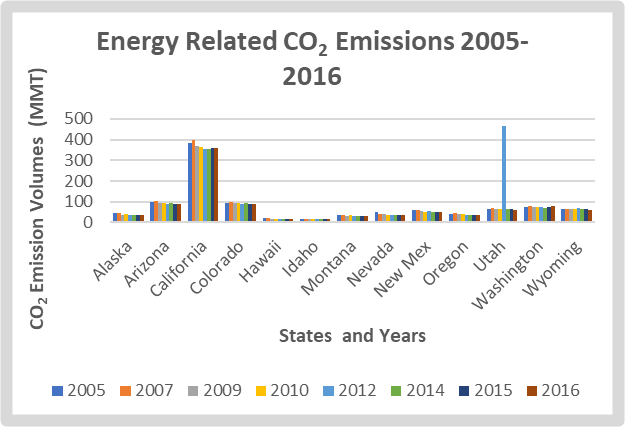 | Figure 2.2. Energy Related CO2 Emissions 2005-2016 Pacific Northwest |
3.1.2. The Incidence of Elevated Temperature Patterns 1980-2022 County and Regional Level
Climate change risks made up of sea level rise, wildlife fire and the 10000-year heat waves that rattled the zone remains major scars on the landscape. Having wreaked havoc across states and cities from Southern California, Washington and Oregon and other places amidst record breaking temperatures and many casualties. From 06-26 to 07-2 of 2021, Washington state reported 100 heat-related deaths. As such, Portland Oregon, saw record breaking highs of 112 degrees Fahrenheit that exceeded 108 F set in previous day. Just as all these outpaced the old record of 107 F in 1981 and 1965. The hotness in Salem, Oregon surged to 113 F, breaking the record 108 F record set in 1941 and 1927. Elsewhere, dozens of counties from Puma to Mora County in Arizona and New Mexico exceeded national global warming perception averages of 80-81% at +8% and 9%.
3.1.3. The Outbreak of Wildfires Across the States 2017-2021
The outbreak of wildlife fire incidents (Figure 2.3) and the acreages burnt in 13 states has intensified all through 2017-2021 in the region, with 7million plus acres in 2017-2018 2020. The pattern is followed by the highest level of 9.5 million acres in 2020 as the zone saw additional burnt areas of 4,088,085-6,151,501 acres torched by the wildfire. This represents average levels of 6,861,290 acres for the entire region of the Pacific Northwest from 2017-2021. Thus, among the states, California emerged with the highest cases as expected. For that, from the data in place, given the state’s vast size in green spaces and the nature of its desert ecosystem, the Golden state saw over 1–2-million-acre (1,266,2241,823,153.20) losses in 2017-2018. This continued with a sudden drop to 259,148 acres in 2019 clearly below the subsequent size of areas 4M plus acres (4,092,150.50) gushed by wildlife forest fire in 2020. The same pattern held firm through additional incident over vast swat of areas measuring 2,233,666 acres in 2021. From all those years, characterized by the outbreak of raging fire, the Golden state saw an average level of 1,934,868 acres far higher than the other individual states. Elsewhere, the summations, among the states puts Alaska and Oregon each with similar average acreages of 799,278,-732,381 over Montana, Nevada, and Washington where areas torched by wildlife fire were in neighborhood of ½ million acres (599,248,529,292,-505,878 acres) all the years from 2017-2021 (Figure 2.4). Among the other group of states, Idaho, and Arizona experienced more fire incidents at combined mean values of 400,000 acres plus, with the Colorado and Utah at 200,000 acres while Wyoming and Hawaii had 60,897 acres to 15,052 acres in average size of areas gushed by wildfires in similar category average. From a regional average of 23,163 from 2017-2021, California not only toped the ranking ahead of the trio of other 2nd tier states (Oregon, Arizona, and Montana) at 9,104 in the number of fire incidents, but the state’s all-time high of 10,431acres in areas destroyed by wild forest fire in 2020 emerged as the deadliest throughout the entire years of the incidents of active wild forest fires in the region. Of the other states in the zone as mentioned, and where the average combined forest wildfire acreage totals stood at 2,100, finished at a total of 6303. The respective tallies for these states reached 2,156 acres, 2,097, to 2,049 acres correspondingly for Oregon, Arizona, and Montana (Figure 2.3- Figure 2.4).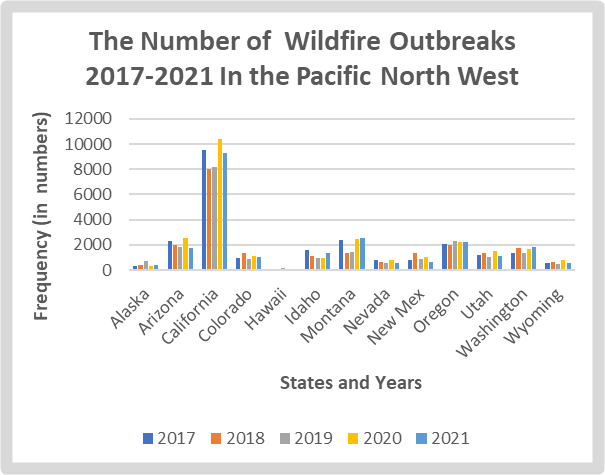 | Figure 2.3. The Number of Wildfire Outbreaks 2017-2021 |
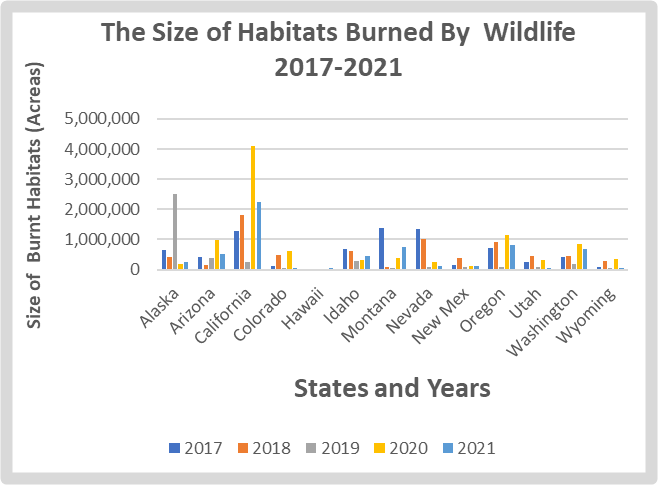 | Figure 2.4. Size of Habitats Burned By Wildfire 2017-2021 |
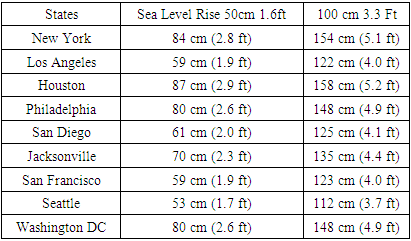
3.1.4. Sea Level Rise Flooding and Water
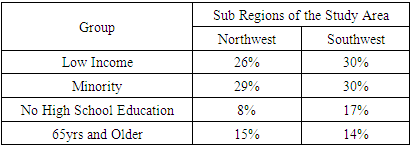
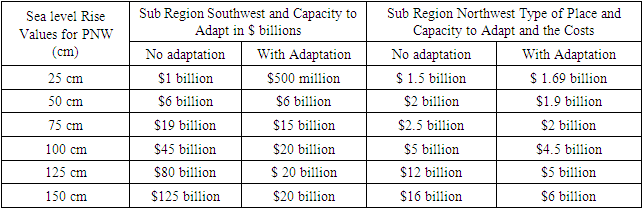
Amidst the threats of aridity in the US western region, many areas are experiencing drought conditions as lakes and rivers face dryness. Ground water resource areas are being depleted and aquifers shrinking considerably due to changing climate impacts. The major case in point touches on the Ogallala aquifer, Central Valley, and the others. Added to those risks is the issue of sea level rise which now threatens many low-lying coastal communities in the Pacific Northwest region enormously. In fact, the projected sea level rise of 50 cm and 100 cm for the 10 most populus cities show 4 western cities of Los Angeles, San Diego, San Francisco, and Seattle at risk levels of 59 cm (1.9 ft) -122 cm (4.0 ft) to 53 cm (1.7 ft)-112 cm (3.7 ft) (Table 2). When broken down along socio-economic groups across the subregions perceived as at risk of serious exposure to coastal flooding. At least 26-30% and 29-30% of low income and minority groups coupled with 8-17% to 15%-14% of those with no high school and 65 and older remain at risk of coastal flooding in the Northwest and Southwest axis of the region. Even though there are little difference in values regarding the demographic indicators or groups at risk, in the individual places, the only major outliers are those classified as having no high school education where Northwest had only 8% compared to the 17% in the Southwest. This seems to imply that the southeast sub region of the study has more folks in that category threatened by coastal flooding at risk (Table 2.1). This comes at huge damage costs in places with no adaption and those with adaptation and non-adaption on the 150cm levels -125 cm levels faced with liability exposures estimated at $125 billion- $80 billion- $20 billion respectively in the subregional Southwest side. In the next order of environmental damage expenditures, the costs in the no adaptation portion of the Northwest further escalates to $16-$12 billion and $6-5$billion along the northwest axis (Table 2.2).Table 2. Projected Sea Level Rise for the Ten Most Populous Coastal Cities in the U.S. with Global Average Sea Level Rise of 50 cm and 100 cm
 |
| |
|
Table 2.1. Distribution of Socially Vulnerable People in Coastal Flooding
 |
| |
|
Table 2.2. Cumulative Damages Costs From Global Warming In the Sub Regions of The Study Area In $billions
 |
| |
|
3.2. Impact Assessment
Looking at the recurrent risks from climate change in the Pacific Northwest region. The built and natural environment in the form of real estate, community neighbourhoods and fragile ecosystem particularly the hydrology were at the receiving end of sustained and future impacts of varying proportions.
3.2.1. Real Estate Properties Threatened by Fire Outbreaks/ the Economic Liabilities
The pressures from changing climate stressors and how it impacts on community neighbourhoods in social environment within urban centres occur in many ways. They include periodic risks from fire perils unleashed on the stocks of household assets, homes, and commercial real estate during such disasters. By the time overwhelming liabilities were sorted out of the rubbles of destruction meted on properties by the intense fire eruptions in 2021 across many states in the Pacific Northwest. People began coming to terms given the transboundary patterns of the disasters amidst the role of shifting climatic forces in the process. Accordingly, climate change induced wildfire destruction of homes and at-risk properties reached 25,429,100, 3,408,400 to 141 for the region in 2021. Unsurprisingly, California outpaced all states with 13,680,100 housing units and 2,040,600 properties gutted by the siege at a price tag of $14 billion. At the same, the trio of other Western states of Colorado, Arizona and Washington ended with over 2 million housing units under threat, coupled with property units in the order of 373,900-242,100 to 155,500 at the damage costs of $530-450 million for the first two states. In terms of the risk percentage distribution of damages, close to 15%, 17 -9% went to California, Arizona, and Washington state as well. Elsewhere in the zone, the mountain states of Idaho, Oregon, Montana, and Utah combined for 3,805,900, -596,300in housing and property units at a rate of 78% in the risks to properties in the zone (Figure 2.5). In the case of natural areas, even though wildfires form part of the natural process in much of Northwest Forest ecozone, hotter and arid surroundings have fuelled the surge in the frequency and forms of wildfires in the pacific Northwest forests from the 1970s. This tendency is projected to persist in potential climate settings. In the 2080s, the average yearly size in area to be destroyed by fire in the Northwest could be 4 times more proportional to the patterns in 1916 to 2007 to 2 million acres based on the technique used in arriving at the numbers (range of 0.2 to 9.8 million acres) under the scenario. When tallied along the mean values regionwide, this raises a possibility that 2.2 million acres would burn away yearly by 5% to almost 50%. 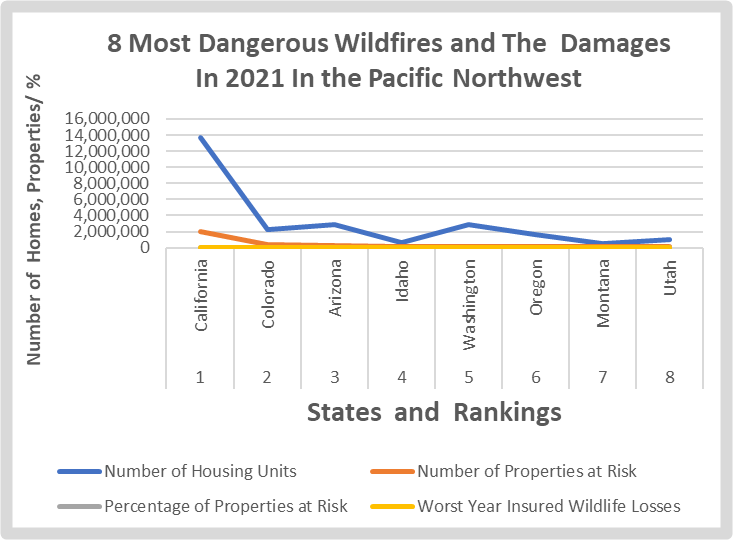 | Figure 2.5. The Eight Most Dangerous Wildfires/Damages |
3.2.2. Ecosystem Disturbance and Sea Level Rise/ Drought and Agri Ecosystem
Climate change induced disturbance brought about by high temperature and heavy rain often accentuates in the degradation of shoreline ecology and agricultural ecosystem. In every geologically unstable ecozone like the study area, whenever the heating of the atmosphere occurs in those circumstances, the ubiquitous effects in the climate can be felt in various sectors. Knowing that water vapor coming from outside into the atmosphere generate fogs that impact the environment in different ways. The concentration of fogs can cause threatening precipitation and floods while variations on higher elevation lands, as common phenomenon on adjoining areas, affects low lying unstable shorelines in the process, as often felt in the zone. By the fragile nature of zone’s geology and ecosystem, the scale of such a shift can affect species existence, particularly where there is a heavy dependence on shoreline line plants. At the same time, since most of the areas in the Northwest have minimal yearly rainfall, where variety of farm crops rely on irrigation. The decreases in summer stream in snow filled waterways, together with the warming that may possibly raise farming and other needs, possibly creates irrigation water deficits. The dangers of a water-scarce period in places where water access hinges on eligibility to water rights reserved to solely ¾ of their assigned water right value. Given that such transaction was projected to rise by 14% during closing decades of 20th century to 32% in 2020 and about 77% in 2080 in the absence of little mitigation measures. The monetary impacts on Northwest’s farm sector in those circumstances are not only shaped by market behaviour and the volatility in international capital and exchange. But they are at the mercy of changing climate stressors. Furthermore, from its assorted landscape (such as beaches, rocky shorelines, bluffs, and estuaries), shoreline and maritime environments, and social habitats (such as rural communities, dense urban areas, international ports, and transportation), the Northwest coastline will encounter a variety of shifting climate effects. Considering the projected increase in water volumes in oceans amidst global warming, rising seawater and the meltdown of ice sheets and glaciers. Global sea levels are anticipated to surge notably by 0.66 to 6.6 feet in 2100 in ways that threaten the coastline communities in the PNW zone. Additionally, the continuing climate-driven changes in sea level as predicated for the Northwest, can accelerate regional sea level by about 4 to 12 inches over several months. Since the coastal waters of the Northwest have shown extremely shifting physical and ecological conditions, shoreline exterior temperatures have risen, while summer period fog has dropped since 1900-to the 2000s. To that effect, the anticipated variations encompass rising but unstable acidity, surging hotness in surface water temperature and probably cases of shifting windiness.
3.2.3. Hydrological Related Challenges
Monitored local heating has been associated with variations in the measurement of the amount of water accessibility in estuaries containing substantial water from fallen snow supply or input to river flow. For that, as far back as mid-20th century, the area-average level of floating water from snow as at the first day in April around the Cascade Highlands dropped by almost 20%. Having said that, much of this will rely on the overwhelming patterns of rainfall in specific major rivers as well as local and other regional parameters. Nevertheless, this is occurring amidst the declines in ground water levels and local aquifers in the zone over the years due to drought and the rising temperatures across some of the states in the Pacific Northwest region of the US.
3.3. GIS Analysis and Spatial Mapping
The GIS analysis covers the visual display of spatial patterns highlighting varying climatic stressors driving the interactions with the fragile environment. In as much as the shifting pathways reflect evolving risks from climate change in the study area over specified periods. The hazard parameters pertaining to the zone embody generic rainfall and temperature distribution, wildfires and monetary damage costs, changes in energy related CO2 emissions, acreages burnt, number of wildfires, and drought intensity. Added to these are geo-visual expressions highlighting historical annual precipitation, historical average summer temperature, number of wildfires, average temperature and precipitation values for cities and the clusters in space pinpointing spots deemed below normal groundwater level across the states in the region. Drawing from the saddles of these disasters in the region over time, the information as accentuated by the geo visualization of different indicators from fire outbreaks, drought intensity and elevated temperature and heavy precipitation confirms the grim situation and the evolving patterns in space. The capacity to track and show the spatial paths of these issues under a GIS environment as a feasible evaluation tool, offers opportunities in gauging climate change risks in the Pacific Northwest region. Taking a cue from the precedent, note the patterns in a trio of states besieged in the study area. This comprises of Montana, Nevada, and California (in dark red colors), where over 1 million acres were burned by wildfires in 2017. Based on that, these states not only remained in the mix in terms of further risks, but they surpassed the other neighbors in the zone for the wrong reasons as the states with more natural habitats ravaged by fire. Even though the acreages torched by wildlife fire events in the other states from Alaska, Arizona, Idaho, Oregon to Washington fall below the size of burnt areas in the 3 leading states devastated by wildlife fires. The intensity of the incident in the 2nd tier states in the map were quite damaging enough given the capacity to alter ecosystem composition. The same goes for the low-end states of Wyoming, Colorado and New Mexico in yellow areas faced with the wildlife fire dilemma hovering in the study area (Figure 2.6). In as much as in 2018 Colorado represented (in dark red colors) accounted for more burnt acreages through wildfires, there does not seem be to any monopoly of that record either for California during the same period (Figure 2.7). By 2019 a new spatial pattern indicating the dispersion of more burned acres emerges with Alaska in the prime spot-on acres burnt by wildfire followed by California, Arizona, and Idaho (Figure 2.8). However, by 2020-2021, California as displayed in dark red colors in both years lost much acreage of natural habitats to wildlife fire. The next or 2nd categories in burnt acreage in space extends to Arizona and Oregon in both periods until Washington and Montana saw more land areas consumed by fire in 2021 as well (Figure 2.9-2.10). Granted the recurrent nature in the number of wildlife fire outbreaks in California as identified in red color, and at levels higher than the others. Considering the nature of such a surge in liability, it is unsurprising to see the Golden state as the place with most fire outbreaks throughout 2017-2021. However, the frequency of same fire incidents across Oregon and Arizona repeatedly occurred on a back-to-back basis in which the damaging spatial patterns in Montana and Washington over the periods 2017-2021, raised serious concerns due to the risks to biodiversity and loss of assets in the respective states (Figure 2.6-2.10).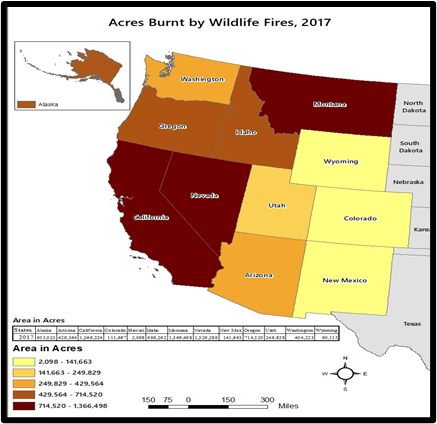 | Figure 2.6. Acres Burnt by Wildlife Fire 2017 |
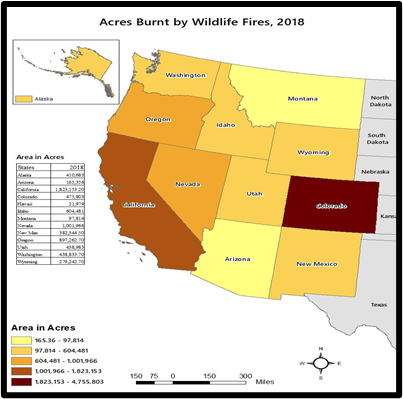 | Figure 2.7. Acres Burnt by Wildlife Fire 2018 |
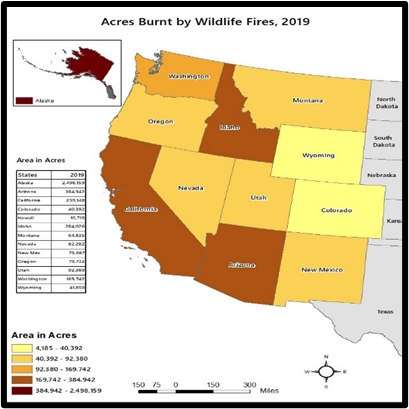 | Figure 2.8. Acres Burnt by Wildlife Fires 2019 |
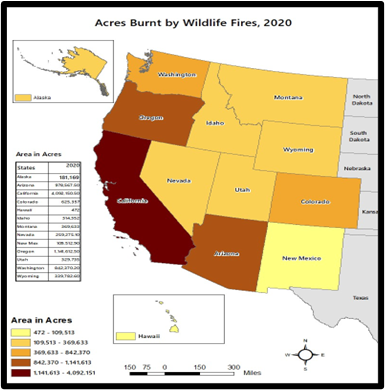 | Figure 2.9. Acres Burnt Wildlife Fires 2020 |
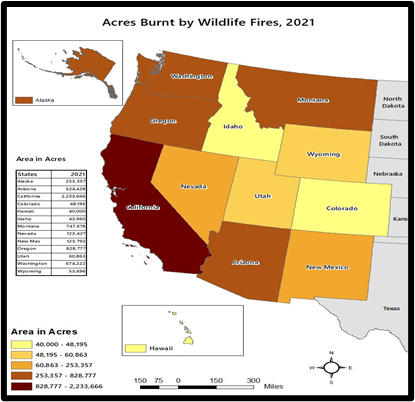 | Figure 2.10. Acres Burnt By Wildlife Fires 2021 |
Bearing in mind the intensity of drought and the effects it is having in the region over the years. The picture painted particularly in 2022 December reflects what really transpired in space. Accordingly, the info from the map legend identities multiple conditions of drought in diverse colors (of red, orange, yellow, green, and pink). With the drought categories classified as exceptional, extreme severe to abnormally drought. It is evident that these patches had a visible presence across parts of Oregon in the North and California in the southwest desert with further extensions into Nevada, Utah, and Colorado. Aside from the mix of extreme and severe drought events in the upper parts of the map from Montana and Wyoming to Colorado and New Mexico in the Desert South ecozone. These conditions faded gradually in nearby Arizona and up in the Northwest within Washington and Idaho in the center and other states in the presence of other clusters of spots, classified as moderate and abnormally dry conditions in green or beige. During the month of June 1-8 in the year 2021, similar conditions of drought resurfaced again with situations deemed severe, extreme, and exceptional reverberating deeply. With these initial warning signs evident from parts of Oregon, Washington, California to the hot spots in Arizona, and New Mexico in the humid Desert Southwest. The abnormal and moderate class of the drought conditions appears fully concentrated along the Northwest areas of the study area. (Figure 2.11-2.13). In seeing the distribution of historical summer temperature levels, displayed in red, light red, light, orange, and white in the legend box and the map. Note the relative closeness with the first four categories measured at 30-38°F – 27-29°F, 24-26°F and 21-23°F. Aside from the dispersion on the next three categories of temperature. The remaining spots on the map classified under the lower scale temperature levels of 19-20°F, 16-18°F and -0.84-15°F in mild orange and white (or milk colors) has a broader spread from the upper Northwest of Washington – Oregon axis to parts of California onto Idaho, Montana, Wyoming, Colorado, and upper New Mexico as well (Figure 2.14). Turning to the temperature levels across selected coastal cities, in the states of California, Oregon and Washington in the Pacific Northwest zone, over the periods 1980-2022. The fact that the different temperature levels (in colors of green, yellow, blue, brown, and purple) stood firm in several cities most notably Los Angeles, San Diego, and Sacramento in parts of California. The ratios of the temperature during the set periods in those cities consists of the values that surfaced in 1980 at 50.7-57.4, 57.4-62.24°F, to the 1990 levels of 51.8-58.0, 58.0-66.5. By the following periods 2000-2022, the temperatures in those trio of cities went from 52.7-60.5 to 60.5-64.7 to 52.4-59.9 to 59.9 -64.2°F. These temperature patterns in space across the study area supersedes the figures along the upper Northwest portions of the map in the states of Oregon and Washington where the temperature figures vacillated from upper 40s to 50°F all through the period 1980 through 2022 (Figure 2.15).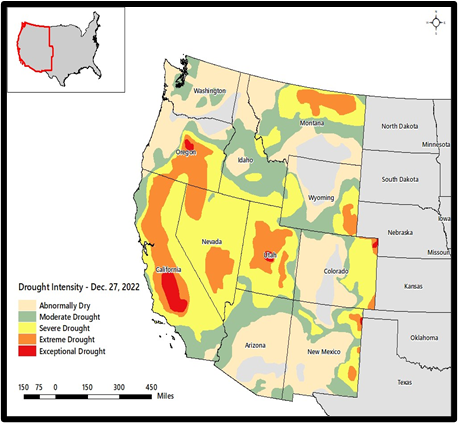 | Figure 2.11. Drought Intensity 2022, December 27 |
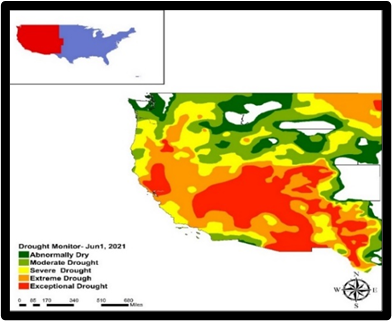 | Figure 2.12. Drought Monitor 2021 June 1 |
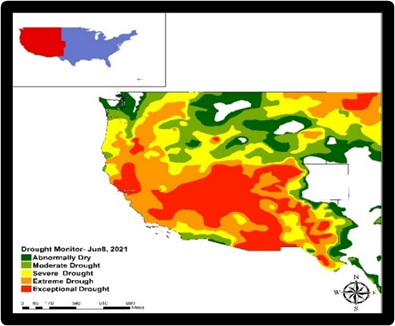 | Figure 2.13. Drought of 2021 June 8 |
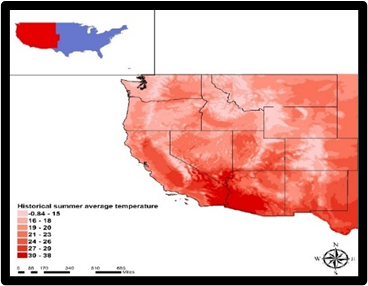 | Figure 2.14. Historical Summer Average Temperature |
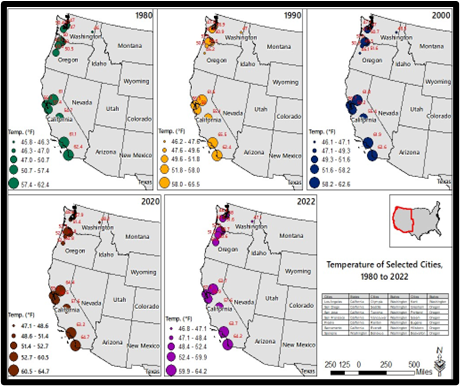 | Figure 2.15. Average Temperature of Selected Cities |
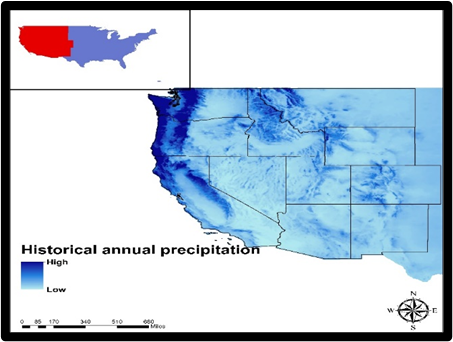
The water or hydrological aspects of climate change impacts in the Pacific Northwest from the map shows the spots on the image denoted by a mix of high and low levels of precipitation under the colors of blue and orange stretched all over the entire study area. For that, based on the significance of water in the Northwest zone and the disparate level of availability across the states with some in the rain belt and others deprived robust access. From the map and the legend content in place, and the rainfall patterns in the month of January 2023. The geographic distribution affirms profound concentration of heavy downpour paths on the higher scale at 231.112 fully steady within the left side of the zone particularly along the Washington, Oregon, and the North central axis of the study area. Notwithstanding the meagre clusters of precipitation in parts of Idaho and Northern Montana. The lower scale of the precipitation patterns at 1.829 in orange colors hangs all over central Oregon and Washington, southern California, the entire Nevada, all through Utah, Arizona, New Mexico with further spreads onto Colorado and Wyoming (Figure 2.16). In the context of historical annual precipitation along these lines, on the blue hydrological map, emerges the same dual phases of high and low with the thicker blue location highlighting Washington, Oregon, and north central California chiefly in the heavy rain corridors. Elsewhere, in the zone from central Idaho, ¾ of Montana all the way to the Southwest Desert ecozone of Arizona and New Mexico, comes again a softer spread in rain intensity in the areas. This involves lower historical rainfall patterns together with other islands in the South Pacific side of the map in same levels as well (Figure 2.17).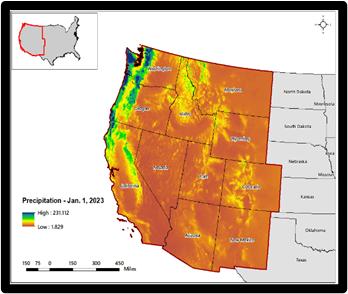 | Figure 2.16. Precipitation Patterns 2023 June |
 | Figure 2.17. Historical Annual Precipitation |
From the strong correlation between precipitation and ground water volumes with wells in the study area. The trends in the month of May 2022 show the distribution of points in space within the states under the different colors of green, yellow, and red representing areas categorized as below normal groundwater levels and the all-time high spots. Looking at the legend metrics and the unfolding patterns, the places categorized as having a mix of much below normal < at 10%, and the below normal level of 10-24% in red and yellow seemed heavily concentrated in Southwest Utah. This is followed by some clusters of spots in Southern California and patches in Nevada together with couple of states made up of Colorado and the states of New Mexico where the geographic patterns stood firm (Figure 2.18). When it comes to the spatial distribution in the patterns of rain fall events that occurred across the host of five selected cities in five states (Alaska, California, Hawaii, Oregon, and Washington) in the Pacific Northwest zone between 1980-2022. One thing that emerged in the changing patterns of rain is the dominance and steadiness of the cities in Alaska, Oregon, and Washington. Being the core rain belt where the highest levels of heavy downpours occurred, the cities in California and Hawaii finished at the lower levels in rainfall across the various years. In the process, beginning in the 1980 rainy season, both the cities of Anchorage Alaska and Everett Washington saw more rain measured at 84.4 inches to 78 inches. From thereon came a major shift that manifested notably in the precipitation intensity, during which the 1990 period emerged as the time of highest levels in rainfall volumes across 5 cities in the state of Washington. During that year, Everett city again, soaked in 106 inches of rain while the others including Bellview, Renton, Kent, and the city of Seatle were drenched in another record high of 99 inches of rainfall respectively as Tacoma finished with 81.7 inches. Aside from the drops in precipitation levels to 66.17-71.1 inches in the year 2000 for Everett and Anchorage. Most cities in the state of Washington saw increases in rainfall volumes during the periods 2010-2022 than the others (Figure 20.19). 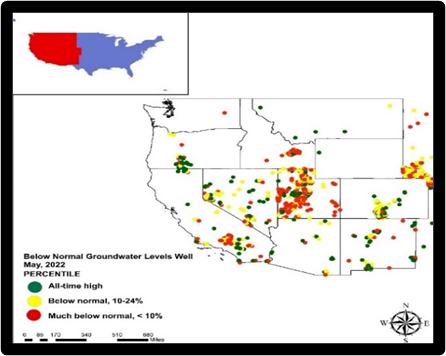 | Figure 2.18. Below Normal Ground Water Levels Well |
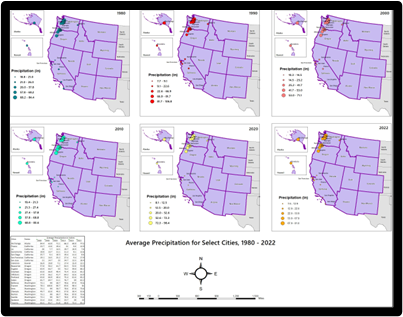 | Figure 2.19. Average Precipitation of Selected Cities |
3.4. Factors Responsible for Changing Climate
Regarding the factors fuelling the changing climate impacts in the US Pacific Northwest region over the years. From all the available information in place, in the zone, they do not occur in isolation. They are linked partly to a host of socio-economic, policy, and physical-environmental factors. These elements are examined fully in the following paragraphs.
3.4.1. Population, Urbanization and Uncontrolled Growth
Looking at the pace of change in the zone. The rising population and unprecedented development level in the Pacific Northwest region coincides with the occurrences therein. In that light, the study area’s population went from a total of 71,945,639-77,413,991 from the periods 2010 through 2017. At the same time, the state of California’s number of residents surged further by 37,253,956 to 39,536,653. In different areas of the globe, coastal areas contain the most rapidly growing towns and cities. In the process, population pressures in the core coastal zones of the Pacific Northwest continues to drive unparalleled shoreline expansion, requiring cars on the road and intense power supply among utility providers heavily dependent on fossil fuel responsible for the emission of CO2 and Green House Gases. With such concentration of dangerous stressors placing inhabitants, visitors, and assets at widespread peril from colossal storm surges amidst climate change. It is evident that bigger threats lay ahead with the pace at which overall population figures of the region went from over 45 million in-habitants in 2000 to more than 49 to 51 million plus between 2010 through 2014. During these periods (2000-2010 and 2000-2014) some of the states posted double digit growth rates that surpassed the levels for the entire US average. At same the time, the coastal regions of United States have allures as the most attractive locales to dwell in. The fascination offered by coastal beaches of the Pacific Northwest results in additional inflow of people and the pursuit of infrastructural development to meet the needs of a growing population and visitors. As a proof of this pressure, compare the growth rates of the pacific Northwest and the US as whole. When the United States saw 9.7% increase in overall population growth, the region experienced a 10.78% spike from 2000 through 2010, and by 2010 -2014 and 2000 -2014 the entire pacific region did outgrow the US as well by 4.23 to 15.46%. Having such many folks in the area, amounts to widespread use of fossil fuel energy to power daily activities. This raises the carbon footprints therein. In the process, total regional values in energy related CO2 emissions in 2005-2016 for the study area, showed opening budgets of 1053.1-1078.6, 997.4 MMT, hence the heating up of the atmosphere in a setting where cities like Los Angeles air sheds are ranked among the dirtiest air sheds in the US. Seeing that the GHGs budget for the periods 2006-2013, is partly a measure of carbon footprints from population pressure. The economic engine powered by population surge, driving growth indicators (transportation, industrial commercial and households) in the zone, generated significant volumes of GHGs in the states of California and Washington between 2018 and 2021.
3.4.2. Economic and Fiscal Benefits
The states and the cities of the Pacific Northwest region, have economic hubs that are generating new jobs. These hubs draw people and migrants across the country and the globe for conference events, conventions, and real estate speculation. In the process, the entire coasts have been rapidly urbanized with economic advantages. Considering their aesthetic and economic appeal as well as opportunities for boating, outdoor, fishing and swimming, these ecological resources of the zone provide numerous job opportunities and sense of economic wellbeing and access to pristine environments. All these translate into higher prices for beach front homes and properties with huge revenue base for speculators and the tax coffers of cities. Such conventional economic indicator does affirm the advantages of the region [20]. However, the economic benefits presented from fossil fuel dependent sectors of the economy like households, industry, power utility companies, the farming sector, and the use of automobiles on the road and commerce are synonymous with climate change challenges. Accordingly, the tax revenues generated from these sectors seems indicative of their role as essential components in the economic welfare of the state. This makes it very difficult to ignore in the search for factors given the centrality of hydrocarbon usage. Notwithstanding the greening tendencies, and the proactive nature of policy and programs towards mitigation, current economic incentives in place allows knowingly and unknowingly the overindulgence in practices that put communities in harm’s way. Furthermore, the prospects of booming development of new settlements together with business hubs and entertainment districts, require the influx of people into adjoining areas and school districts destined to generate big revenue. This makes it hard to scale back sectoral activities from electricity power firms, transportation, households, new infrastructure design and other catalysts fuelling increases in carbon footprints tied to the emission of GHGs. Knowing how central operations associated with daily living in society at large are powered by fossil fuel energy. Essentially long-distance driving with cars to destinations through and from homes in the west via highways remain major sources of GHGs. The same can be said of household heating and cooling where folks switch power to cool home temperature during the blazing heat generated through elevated temperatures caused by heating of the air because of global warming.
3.4.3. Environment, Physical and Climatic Forces
Another way to explain the reasons behind the ongoing changes in the study area of US Western region revolves around the physical and geological factors inherent in the zone. This comes from the natural pressures mounted from the unstable geology of the region on the adjoining coastal zone ecosystem. Clearly stated, many of the pressures exerted on coastal areas of the study area are part of the natural process in coastal areas that sometimes are compounded by changing climate. As a result, winds and waves that are attributed to extreme climate events move materials that affect coastal landscapes from one period to the other. The Pacific north-west has heated up by an average of 2F (1.1C) over the past century, with growing wildfires, failing coastal fisheries, receding snowpack, and increasing heat taking its toll upon a region historically unprepared for such extremes. Given the study area’s presence in the Pacific ring of fire known in the west form its network of sub terrain thermal reservoirs measured at least 2 mile deep. Over the last century, the mean yearly temperature in the Pacific Northwest rose by 1.3°F amidst water deficits. In that way, temperatures are likely to rise by almost 3°F to 10°F at the end of the century, with much of the biggest surges anticipated in the summer. The coastal waters of the Northwest seen as one of the most valuable in the zone, are often pushed beyond limits by very extremely shifting physical and ecological conditions. As such, coastline exterior temperatures have risen, while summer period fog has fizzled all through 1900 and the opening decades of the 2000s. Much of that might be the effects of lower streaming breeze. In these places, anticipated variations comprise of rising but unstable acidity, surging hotness in surface water temperature, and probably cases of shifting windiness. Even at that, most of the Northwest shoreline is increasing because of geophysical force described as “tectonic uplift,” that lifts the ground outer layer. Due to this, the obvious sea level rise is under the presently stated global average. Nevertheless, with a huge seismic activity roaring along the Cascadian subduction zone, looming in hundreds of years from now. At one end, note that certain places around Puget Sound are presently undergoing subsidence (the sinking of land). Additionally, based on the continuing climate-driven changes in sea level as predicated for the Northwest, limited El Niño situations can accelerate regional sea level by about 4 to 12 inches over several months.
3.4.4. Ineffective Policy
The Pacific Northwest zone is not only always adored as a preferred place in the design and pursuit of innovative environmental policies ahead of others. But given the vulnerability of the ecozone as an area with very active geology where mountains are still being formed and the continental plates pushing each other, knowing the risks. Therefore, the zone tends to be quite proactive in matters pertaining to the mitigation of environmental issues. For that, the state of California compared to the others is said to have better emission mitigation measures, together with Washington and Oregon often seen as leaders in the greening of the environment. To that effect, coastal cities like Oregon and Seattle received past awards as the greenest cities in the nation. While this has been extended further to improved policy infrastructure, together with the historical aspects of growth management in land use within inland and coastal areas. Such attributes make the states in the region far ahead of others in legislations and climate action plans. Seeing these moves together with the regional ones and the comprehensive initiatives by US mayors already in place to contain the perils of shifting climate over time. There have been little headways due to the piecemeal approach often used, coupled with the contradictory and adhoc focus sometimes. There is also the combination of events in other places compounding the dilemma beyond the control of the Pacific Northwest that are transboundary and global. Additionally, the current defects in policy and land use planning seem to be exacerbating the problems. Part of the risk exposure emanates from how communities manage their land and resources in the region. This is especially true in the Pacific coastal zone where land use development is taking place in unsafe areas. Such type of land use regulation known for its risks falls within the domain of local government because it is site specific. The frequency of flooding, earthquakes and mud slides, fire outbreaks both past and present coupled with the proximity of developments in hazard prone areas indicates, current policies support behaviours capable of putting more people and property at risk from coastal hazards in the region. Surely, the federal flood insurance often cited as an example of how hazardous development is subsidized, embody the wrong kinds of incentives available to homeowners. From the availability of various types of hazard insurance that encourages development in coastal areas. Coastal development subsidies are provided in the form of tax expenditures and deductions with benefits to cities and land speculators. This often accentuates the inherent risks, hence the vulnerability. Additionally, given the adhoc nature of mitigation measures in public discourse where some downplay the gravity of climate change. The recourse to contradictory statements on the climate in public discourse in that way, keep places deemed in danger and at risk, unprepared for catastrophes in a setting where negation of climate change is often promoted.
4. Discussions
From its attributes, location, and other dimensions the Pacific Northwest region in the last years remains a model and envy of many. Accordingly, the zone has overtime surpassed, the other places in the US in many socio-economic markers. Granted the zone’s tapestry and depth in enviable physical and geological features of high montane ecosystem and warm climate throughout the year. Couple of places under the ecozone contain vast network of habitats highlighting flourishing biodiversity dispersed around the San Francisco Bay and the Pungent Sound areas in Washington and natural areas in coastal Oregon and the others. The region’s position as among the fastest growing areas in the nation under vast swaths of land with large population concentration in big cities has made it the perennial destination for many. Aside from all these, in the last several years, the zone continues to be the epicenter of the most dangerous natural disasters prompted by the changing climatic parameters from high aridity and bush fires. Sometimes isolated patches of irregular heavy rainfall and periodic snowstorms, subzero and elevated temperature, and the warming of the atmosphere persists uninterrupted. Since all these are threatening the links of society, economy, and the surrounding ecosystem, amidst sectoral vulnerability. In the last century, the mean yearly temperature in the Pacific Northwest rose by 1.3°F amidst water deficits. The temperatures are likely to rise by 3°F to 10°F at the end of the century, with much of the biggest surges anticipated in the summer. As such, the latest heatwave that baked the US Pacific region is still fresh in the mind of many. Yet, the use of mix scale methods tools of descriptive statistics and GIS remains quite effective in pinpointing the scope and patterns of these climate change induced disasters.Furthermore, based on the assessment carried out, the enquiry highlighted the vulnerability of the zone to the mayhem often unleashed in shifting climate settings. From the gravity of what transpired all these years whether it was from the Imperial Valley to San Francisco Bay, the Cascadian Subduction Zone of Washington and Oregon, the basin and geo-logic provinces in Nevada and Idaho, and mountain west sub zone. The sets of climate induced risks faced in the zone in the face of interactions between range of parameters seems compounded by the unpredictability of climatic stressors. This can be seen by the intensity of heatwaves, forest fires, storms, high temperature, droughts, and irregular patterns in rainfall delineated earlier in the methods. Climate change risks made up of sea level rise, wildlife fire and the current 10000-year heat waves that rattled the zone left major scars on the landscape. Having wreaked havoc across states and cities from Southern California, Washington and Oregon and other places amidst record breaking temperatures and many casualties from 06- 26 to 07-2 of 2021. The manifestation of the threats remains real. In the process, Washington state reported 100 heat-related deaths. While Portland Oregon, saw record breaking highs of 112 degrees Fahrenheit that exceeded 108 F set in previous day. With no break in sight to the recurrent disasters, the spate of fire outbreak in 2021 across the region added more salt to injury as climate induced wildfire destruction of homes and at-risk properties reached 25,429,100, 3,408,400 to 141 for the region in 2021. California’s losses exceeded neighbouring states by 13,680,100 homes, and 2,040,600 properties estimated at $14 billion. Having seen the Golden state factor, California’s Greenhouse Gas emission levels, and energy related CO2 emissions from the state exceeded those of the states as well. While these are expressive of the complexities embedded in the intersection within the larger regional ecological -geologic structure and variability in global climate. There is no denying of the fact that the ecology of the Pacific Northwest region in general, makes it vulnerable to inclement weather events. This seems evident as the footprints magnify ferociously across many spots in space through climate change. Furthermore, the extent of emergent liabilities and the stressors can be gleaned from the frequency, concentration and rankings of the affected areas from the dispersal of a set of indicators from percentage of properties at risk, change in energy related CO2 emissions, percentage change in emissions, acres burnt in wildlife fire, heat wave, fatalities from disasters, number of wildlife fire outbreak by state, drought intensity, abnormally dry spots, moderate dry, severe drought, extreme drought, exceptional historical summer average temperature, and heavy precipitation, and totals of the indices.Seeing that the study area on the one hand faces the threats of mega floods currently and more to surface. On the other, the US western region had at one point seen the menace of very violent 100 wildfires, ravaging vast swaths of areas in the Pacific Northwest coastal zone in fume. Noting that the GIS mapping of the patterns pinpointed the risk pathways from changing climate and the concentration in space in different places. The efficacy of GIS mapping was in full display as it assumed greater importance in highlighting the geographic spread of climatic parameters in the form of mean average temperature across the years, monthly average precipitation and the vulnerability to drought and flood. Worthy of note in the GIS mapping is the spatial display of evolution of the indicators from changes in energy related CO2 emissions to precipitation levels and others. The calibration of geospatial information also added into the mix critical indicators like the projected sea level rises and damage costs across the region, deemed germane to understanding the scope and scale of inclement climate events in a changing ecozone like the Pacific Northwest region of the US. The GIS mapping of the trends pinpointed clusters of stressors and the spots at risk dispersed over time due to socio-economic, physical, and ecological elements located within the larger ecological structure. To remedy the situation, the paper proffered numerous solutions ranging from the adoption of effective policy, growth management, monitoring to the design of a regional climate information system and the education of the public and others.
5. Conclusions
This inquiry assessed the dangers from changing climate impacts in counties along Pacific Northwest region with several important outcomes listed as follows a) Pacific Northwest epicentre of natural disasters; b) the impacts of climate change on the rise; d) climatic shift triggered by multiple factors; e) mix scale approach quite effective. In general, the unfolding climate change induced disasters peculiar to the Pacific Northwest region has been recurrent over the years. To that effect, the zone is fast becoming the epicentre of inclement weather events like the multi states heat wave debacle that wreaked havoc in 2021 and the others. For that, from the impacts of extensive destruction and catastrophic damages on built and natural ecosystem across the states in the region deemed by many as outdoor paradise is making folks think twice given the vulnerability levels of citizens and other life forms. Accordingly, the recurrency, flow and concentration of the dreaded extreme weather stressors and the attendant events on the ecology of the zone occur with ubiquity as evidenced by the frightening scales it has assumed lately. Knowing that, the region has had its full share of frequent disasters than other regions in the country with sizable destructions over the years. In all that, the states in the study area, experienced many dangerous climate events including substantial floods, wildlife fires, winter storms, blizzards, heat waves, intense drought, and irregular precipitation patterns. This is resulting in the destruction of properties and infrastructure, the loss of lives and displacement of citizens from their homes. Seeing the severity in previous events, current, and imminent risks, the enquiry formulated pathways for enhancing climate change mitigation actions in a geologically active ecozone. Pinpointing the risks in the region and the vulnerability of 70 million people. There is no doubt, that an eco-zone with vast opulent landscape of mountains, lakes and sanctuaries for biodiversity and economic allures, has now become the epicentre of climate change induced risks. In offering a better approach, the belief is that the findings will sharpen the plans of cities to better anticipate and respond to the eventual signs of extreme events. This will help minimize the impacts on an already fragile ecosystem being stretched beyond the thresholds by continual extreme climate events. Therefore, the regional analysis of climate change risks herein, ushered fresh template for managers to draw from in containing ensuing threats. In the last several years, the effects of climate change continue to be fully identified as a concern throughout the states in the Pacific Northwest. While such worries encompass the exposure of vast swaths of natural ecosystem and developed areas within the coastlines to risks over time. Presenting the mounting pace of such dangers faced in the environment (from flooding, irregular rainfall, CO2 in the atmosphere, GHGs emissions and others) is timely and on target. Against that background, the unending warming of the ecosystem caused partly by elevated temperature has been also implicated in the melting of the Arctic ice carp and together with the escalation of heavy floodings. This is triggering the dumping of huge volumes of water into the oceans with spillovers to low lying areas along coastlines. Highlighting all these as the study indicates, is of great significance. In that way, the study adds an ecological safeguard dimension critical in tracking dangers. Considering the fallout from coastal life coming to standstill amidst catastrophic heat waves and the spate of forest fires hovering over the atmosphere in the west. Acquainting people with the extremities offers those at risk much needed insights on the epicentres of climate change induced hazards in their midst. Emphasizing these climate impact indicators considering the hazards, makes mitigation the priority of recovery plans in the region in the coming years. The changing climatic risks that occurred in the zone stems from a combination of policy, socio-economic elements of population, urbanization and uncontrolled growth and physical forces. The urbanization/ population factor cannot be refuted seeing the pressures from uncontrolled growth patterns in opulent coastlines and influx into beach fronts in the Pacific Northwest. The same applies to the give aways that accrued economic benefits, ineffective policy, and the limitations from physical forces. Seeing the research emphasis on the analysis of changing climate risks, the results in the context of the factors will shape to a certain degree how the states and region and policy makers react to the dangers posed by inclement events in coastal areas. The compilation of the environmental indices highlighting extreme climate events in this enquiry are not only essential devices designed to sustain policy, but they do inject a fresh start vital in strengthening current mitigation plans for protecting vulnerable states in the region in the event of a big climatic disaster. Considering the essence of identifying elements fuelling the dangers to the environment from extreme climate. From all indications, such measures provide suitable template to containing the threats posed by irregular patterns in extreme events ahead before the impacts become permanent. In seeing the factors behind the recurrent risks to the region’s environment and the associated climate induced problems. The research thus, generated a road map for tracking the behaviour of these factors as outlets for improving response mechanisms. Surely, managers are afforded ample opportunity to assess the attributes over available periods by measuring their effects with readiness in the suppression of hazards to the adjoining ecosystems of the zone. Since this is a forward leap to containment and safeguard, the assemblage of these factors, quickens the focus of decision makers in monitoring shifting climate risks and the role of limiting forces in hampering environmental mitigation amidst outbreak of mega climate events. This would enable states and communities develop the appropriate schemes for decreasing the impacts of climate disaster in a turbulent environment. Altogether, the study provides policy makers a better insight of unfamiliar risks that can materialize. Highlighting it herein, the study not only affirmed the essence of socio-economic and physical forces in the region’s climatic variability index, but it shows how the environment can be affected by these elements. Underlining these links seeing the omission in past studies, keeps a major regional policy concern at the center of climate change and coastal planning.Furthermore, the applications of mix scale methodology as analytical tool stood out significantly. Utilising a mix-scale approach of descriptive statistics and GIS mapping as working devices added further understanding to the issue of climate change risks. Because the result-oriented nature in the analysis requires a mixscale orientation as shown. The model was very effective in delineating the study area and recognising epicentres of climate risks, the intensity and risk levels of droughts, precipitation patterns, temperature variations, populations, cities at risk, the ecological and economic impacts. As such, the techniques remain quite fundamental in serving the needs of researchers undertaking geo-spatial analysis of the regional effects of climate change impacts in ecologically fragile and diverse environment like the Pacific Northwest zone. Pertaining the spatial spread of eventual dangers in the states of the Pacific Northwest, the GIS mapping as a management tool emerged quite valuable in showcasing the nature and magnitude of risk indicators, the scale of their dispersion and the extent of impending risks across space. This benefit represents a significant stride cowards effective planning and mitigation of impacts. Pinpointing these dangers strengthens the capacity of managers and agencies in ordering mitigation in susceptible areas on the verge of exposure to impending effects of disasters. Just as the model provides operational benchmarks for assessing extreme settings on the corridor of uncertainties in the zone. The practical applications of a mix scale approach involving spatial mapping along with climate info, as analytical devices raise the grasp of climate change challenges faced in the Pacific Northwest region. Consequently, managers in the zone will be fully forced to seek immediate responses to numerous waiting questions germane to climate change. The questions are as follows: How will climate change parameters affect subterrain hydrology? What scale will climatic stress assume in low lying coastal area? What form will the geographic distribution of climatic risks take in the zone? What other socio-economic and physical elements will be influencing global warming? In drawing from the questions, full opportunities exist for those in practice and research to refocus the goal on regional climate change mitigation with guidelines stressing containment, protection, and rehabilitation. This will allow the key stakeholders in the sector; the region and state and cities increase their dedication to climate change mitigation with improved results.
References
| [1] | Merem, E. C. (2020). Analyzing Organic Food Farming Trends in The US Western Region. Public Health Research. 10: 41-57. |
| [2] | United States Bureau of the Census. (2011). Census Quick Facts. Washington, D.C: US Bureau of Census. |
| [3] | United States Bureau of the Census. (2010). Census Quick Facts. Washington, D.C: US Bureau of Census. |
| [4] | United States Bureau of the Census. (2008). American Community Survey. Washington, D.C: US Bureau of Census. |
| [5] | Merem, E. C. (2016). Assessing The Vulnerability of the US Pacific Northwest Region to Tsunami Hazards. American Journal of Environmental Engineering. 6:1: 1-19. |
| [6] | Intergovernmental Panel on Climate Change (IPCC). (2013). Working Group 1, Summary for Policymakers. Retrieved 2023 March 28th From http://www.climatechange2013.org/images/uploads/WGIAR5-SPM_Approved27Sep2013.pdf. |
| [7] | Walsh, J. (2014). Our Changing Climate. Chapter 2 In the Draft 2014 U.S. National Climate Assessment. Retrieved 2023 March 28th From http://ncadac.globalchange.gov/. |
| [8] | Kunkel. K. (2013). Regional Climate Trends and Scenarios For the U.S. National Climate Assessment: Part 9. Climate of the Contiguous United States, NOAA Technical Report NESDIS 142-9. Washington, D.C. NOAA National Environmental Satellite, Data, and Information Service. |
| [9] | Mote, P.W. (2003). Trends in temperature and precipitation in the Pacific Northwest during the twentieth century. Northwest science, 77:4: 271-282. |
| [10] | Kunkel, K.E. (2013). Part 6. Climate of the Northwest U.S., NOAA Technical Report NESDIS 142-6. Washington, D.C: NOAA. |
| [11] | Bumbaco, K. A. (2013). History of Pacific Northwest Heat Waves: Synoptic Pattern and Trends. Journal of Applied Meteorology and Climatology. |
| [12] | USGCRP. (2014). Mote, P. Chapter. 21: Northwest. Climate Change Impacts In the United States: The Third National Climate Assessment. Washington, D.C: U.S. Global Change Research Program.487-513. |
| [13] | Philip S. Y. (2021 July). Rapid Attribution Analysis of the Extraordinary Heatwave on the Pacific Coast of the US and Canada June 2021. World Weather Attribution. |
| [14] | Berwyn, B. (2021 July). A Week After the Pacific Northwest Heat Wave, Study Shows it Was Almost Impossible Without Global Warming. Inside Climate News. |
| [15] | Flaccus, G. (2022 March). Heat Wave In Pacific Northwest Offers a Glimpse of Climate Change Impact in North America. Associated Press. |
| [16] | Gramling, C. (2017 April). How is the Climate Crisis Affecting the Pacific Northwest? Retrieved 2023 March 28th From Sea level riseclimaterealityproject.org/blog/how-climate-crisis-affecting-pacific-northwest. |
| [17] | Brady, D. (2021 November). Climate Change Threatening Things Americans Value Most, U.S. Report Says. Washington Post. |
| [18] | Wuebbles, D. (2017 November). How Will Climate Change Affect the United States in Decades to Come?’EOS. |
| [19] | Associated Press (2019 August). Residents In The Pacific Northwest Are Getting Ready For Another Heat Wave. AP. |
| [20] | Mcsweeney, R. (2021 July). Heat Waves Pacific North-west Heatwave Shows Climate is Heading into Uncharted Territory. |
| [21] | Merem, E. C. (2023 March a). Assessing Climate Change Impacts In The US Pacific North West Region. Paper Presented at the 97th Annual Louisiana Academy of Science Conference. LSU Alexandria, LA. March 4th, 2023. |
| [22] | Abatzoglou, J.T (2017). Climatic Influences On Interannual Variability In Regional Burn Severity Across Western US Forests. International Journal of Wildland Fire, 26: 269-275. |
| [23] | Abatzoglou, J.T. (2016). Impact of Anthropogenic Climate Change on Wildfire Across Western US Forests. Proceedings of the National Academy of Sciences, USA. Retrieved 2023 March 28th From https://doi.org/10.1073/pnas.1607171113. |
| [24] | Folger, T. (2012 February). Tsunami Science The Calm Before the Wave When and Where Will the Next Tsunami Hit. National Geographic Magazine. pp 1-2. |
| [25] | Merem, E. C. (2019). Assessing Water Resource Issues in the US Pacific Northwest Region. International Journal of Mining Engineering and Mineral Processing. 8:1:1-19 |
| [26] | Howard, P. (2022). Wildfire Statistics: Which U.S. States Have The Most wildfires? Polygenous. |
| [27] | Milman, O. (2021 July) Nowhere is Safe’: Heat Shatters vision of Pacific North-west As Climate Refuge, Climate crisis. The Guardian. |
| [28] | McKinnon, K (2021 September). How Unexpected Was the 2021 Pacific Northwest Heatwave? Geophysical letters. 10: 20. |
| [29] | Mulkern, A. (2021 June). Unprecedented Heat Wave in Pacific Northwest Driven by Climate Change. E & E News |
| [30] | USDA. (2021). Northwest Heat Dome: Causes, Impacts and Future Outlook. DC: Washington, USDA Climate hubs. |
| [31] | Merem, E. C. (2023 March b). Assessing Climate Change Impacts In The US Pacific North West Region. Unpublished Manuscript. Jackson, MS: Jackson State University, Urban Planning Dept, College of Science and Engineering. |
| [32] | Di Liberto, T. (2021 June). Astounding Heat Obliterates All-time Records Across The Pacific Northwest and Western Canada. DC: Washington, NOAA, US Department of Commerce. |
| [33] | Samayoa, M. (2022 September). Scientists Say Last Summer’s Heat Wave Was Extremely Rare and Made Worse by Climate change. OPB. 7:18. |
| [34] | NASA. (2021). Astounding Heat Obliterates All-time Records Across The Pacific North West. DC: Washington, NASA. |
| [35] | CMOR. (2021). Evidence of Drought On Public Grazing Land in Malheur County, Oregon, during summer 2021. Retrieved 2023 March 28th From https://www.nature.org/en-us/about-us/where-we-work/united-states/oregon/stories-in-oregon/how-climate-change-will-impact-the-pacific-northwest/. |
| [36] | US Department of Energy (2016). EIA State Energy Data and EIA Calculations Energy Related Carbon Dioxide Emissions By State 2016. DC: Washington, US DOE Energy Information Administration. |
| [37] | Merem, E C. (2019 January). Evaluating Geothermal Power Use in the East African Region: The Case of Kenya. Paper Presented at the 15th International Symposium on the Recent Advances in Environmental Health. Jackson, MS. January 29. |
| [38] | Merem, E. C. (2019 March). Assessing Geothermal Energy Potentials In The Western Region of the US With GIS. Paper Presented at 27th Annual AEHS Conference. San Diego, CA., March 2019. |
| [39] | Merem, E. C. and Twumasi, Y. A. (2020, March). Assessing The Risks From Changing Climate In South Texas Region. Paper Presented at 94th Annual Meeting of The Louisiana Academy of Science (LASC). Louisiana State University -Alexandria, Louisiana, March 14, 2020. |
| [40] | Merem, E.C. (2022 March c). Assessing Climate Change Risks In The US Midwest Region’s Environment. Abstract Submitted at the 86th Annual Mississippi Academy of Science Conference. Biloxi, MS. March 31-April 1, 2022. |
| [41] | Merem, E. C. (2021). Assessing the Risks from Changing Climate in South Texas Region. Resources and Environment, 11:1:18-34. |
| [42] | Merem, E.C. (2017). Regional assessment of energy trends in West Africa using GIS. International Journal of Energy Engineering, 7:1: 1-27. |
| [43] | Merem, E.C. (2017). Analyzing water management issues using GIS: The case of Nigeria. Geosciences. 7:1: 20-46. |
| [44] | Merem, E. C. (2017). Assessing ecosystem liabilities of oil and gas activities in southern Nigeria. Public Health Research, 7:1: 3-26. |
| [45] | Merem, E. C. (2023 March c). Assessing Climate Change Impacts In The US Pacific North West Region. Draft paper For the 97th Annual Louisiana Academy of Science Conference. LSU Alexandria, LA. March 4th, 2023. |
| [46] | Merem, E. C. (2020). Evaluating Geothermal Energy Potentials In The US Western Region With GIS. International Journal of Engineering. 10:2: 23-40. |
| [47] | Svoboda, E. (2015). Americas 50 Greenest Cities. Popular Science. Retrieved November 22nd, 2015, From http://www.popsci.com/environment/article/2008-02/americas-50-greenest-cities?page=1. |
| [48] | US Census (2022). Census Quick Facts. Washington: DC, The US Department of Commerce. |
| [49] | US. Bureau of the Census. (2014). Census Quick Facts. Washington, DC:, US Bureau of the Census |
| [50] | US Environmental Protection Agency. (2017). Climate Impacts In the Northwest. The EPA, DC: Washington. |
| [51] | Mote, P.W. (2008). Has Snowpack Declined in the Washington Cascades? Hydrology and Earth System Sciences. 12: 193–206. |
| [52] | Hamlet, A. F. (2005). Effects of Temperature and Precipitation Variability on Snowpack Trends in the Western United States. Journal of Climate. 18:21: 4545-4561. |
| [53] | Pierce, D.W. (2008). Attribution of Declining Western U.S. Snowpack to Human Effects. Journal of Climate, 21:23: 6425–6444. |
| [54] | Merem, E. C. (2019, February). Assessing Organic Farming Trends in the West Region of the United States”. Paper Presented at the 2019 Mississippi Political Science Conference (MPCC), Hattiesburg, MS. |
| [55] | Merem, E. C. (2011). Regional assessment of Tsunami hazard management plans: the case of the pacific northwest. Proceedings of the Disaster Resistance Workshop, New Orleans, LA, 16th February 2011. |
| [56] | Merem, E. C. (2019). Regional Assessment of Climate Change Hazards in Southern Nigeria with GIS. Journal of Safety Engineering, 8:1: 9-27 |
| [57] | Merem, E. (2018). Analyzing Tragedy of Illegal Fishing On The West African Coast. Paper Presented at The 18’ NAAAS Conf, Dallas. TX. |

 Abstract
 Reference
 Full-Text PDF
 Full-text HTML