E. C. Merem1, Y. Twumasi2, J. Wesley1, D. Olagbegi1, M. Crisler1, C. Romorno1, M. Alsarari1, P. Isokpehi1, A. Hines3, G. Hirse3, G. S. Ochai4, E. Nwagboso5, S. Fageir6, S. Leggett7, J. Offiah1, S. Emeakpor8
1Department of Urban and Regional Planning, Jackson State University, 101 Capitol Center, Jackson, MS, USA
2Department of Urban Forestry and Natural Resources, Southern University, Baton Rouge, LA, USA
3Department of Public Policy and Administration, Jackson State University, 101 Capitol Center, Jackson, MS, USA
4African Development Bank, AfDB, 101 BP 1387 Avenue Joseph Anoma, Abidjan, AB, Ivory Coast
5Department of Political Science, Jackson State University, 1400 John R. Lynch Street, Jackson, MS, USA
6Department of Criminal Justice and Sociology, Jackson State University, 1400 John R. Lynch Street, Jackson, MS, USA
7Department of Behavioral and Environmental Health, Jackson State University, 350 Woodrow Wilson, Jackson, MS, USA
8Department of Environmental Science, Jackson State University, 1400 John R. Lynch Street, Jackson, MS, USA
Correspondence to: E. C. Merem, Department of Urban and Regional Planning, Jackson State University, 101 Capitol Center, Jackson, MS, USA.
| Email: |  |
Copyright © 2022 The Author(s). Published by Scientific & Academic Publishing.
This work is licensed under the Creative Commons Attribution International License (CC BY).
http://creativecommons.org/licenses/by/4.0/

Abstract
Water resources use in the West African region plays an essential role in the daily lives of communities. Being a region that spans across different ecozones, access to water and scarcity recurrence in some places are common. In the process, the extent of imbalance in the distribution patterns continues to fuel water insecurity and hydrological stress in the Sahel portion. This contrasts deeply with the abundance in the coastal lower South along the Gulf of Guinea. In as much as the current policy did little to ensure continual access in the zone over the years, water allotment across sectors like agriculture, industry and domestic households are on the uptick compared to the others. Even as access to potable water resources dropped in some places, meeting the stipulated global thresholds on water quality under the Millennium Development Agenda remains elusive in some of the nations. With that has come widespread pollution, degradation, depletion of the resource, limited rainfall, and the menace of drought. Hence, the problem is further compounded by several ecological (physical), and socio-economic elements located within the larger regional hydrology. This includes the changing climatic parameters, ineffective policy, rising demands, and lack of monitoring. Notwithstanding these challenges, very little has been done in the literature to analyze the issues in water resources use across the study area using the mix scale model. For that, this paper will fill that void by focusing on the challenges in a select group of countries in West Africa. Emphasis is on the issues, trends, impacts, and factors. For the purposes of analysis, the paper uses mix scale methods connected to the techniques of GIS and descriptive statistics. In applying the techniques, the results show widespread use of water and changes, the appearance of degradation, pollution, and water stress due to a set of socio-economic and physical elements. To remedy the situation, the paper proffered some solutions ranging from the education of the public on water use, the enactment of efficient policy, periodic monitoring, and the design of a regional water management information system.
Keywords:
Water resources, GIS, West Africa, Region, Use, Impacts, Changes
Cite this paper: E. C. Merem, Y. Twumasi, J. Wesley, D. Olagbegi, M. Crisler, C. Romorno, M. Alsarari, P. Isokpehi, A. Hines, G. Hirse, G. S. Ochai, E. Nwagboso, S. Fageir, S. Leggett, J. Offiah, S. Emeakpor, Assessing Issues in Water Resources Use within Countries in West Africa, International Journal of Ecosystem, Vol. 12 No. 1, 2022, pp. 1-19. doi: 10.5923/j.ije.20221201.01.
1. Introduction
The essence of regular use of water resources remains undeniable [1-3], as over 300-260 million sub-Saharan Africans face limited access to increased water for domestic use. In the zone approximately 550 million citizens do not even have improved sanitation [4]. This represents up to 40 and 70%, to 60% correspondingly, of the overall population. As such, the water deprivation burdens in the countryside ranked higher over the others, continues to exact a huge toll on community welfare [5]. Yet, agriculture represents the key economic activity in rural areas of West Africa, and the foundations for food security as well. Being an area where water resources assets play an essential role in the daily lives of communities through multiplicity of ways as manifested in the continual sustenance of sectorial entities of industry, households, and farming. The hydrological assets in the region are not only vital to the daily activities germane to distribution and exchange in the economy. But the surrounding ecosystem and its moist biodiversity endowments cannot thrive in the absence of a regular inflow of water onto the major head waters [6]. For that, farming as a major user of water is built on the reliance on rainfed agriculture that is often seen as a very important mechanism necessary for earning the much-needed revenues and conquering deprivation. While the zone is endowed with abundant water assets [7], the area suffers from frequent shortfalls arising from uneven rainfall and overflows, poor usage, and poor management practices. In the process, during the past 50 years, water supply in the major rivers of West Africa fell because of the changes in climate (rainfall), variations in land use and land cover, as well as population surges [7]. In as much as the enquires on climate predictions solely indicate the declines of river flows by another 20-40% by 2050, the extent of future change remains unclear and may hinge on the interactions of many elements. Accordingly, the scope of imbalance in the distribution patterns continues to fuel water insecurity and hydrological stress along the Sahel portion [9]. In a zone with many rivers [10], by 2030-2050, changes in temperature and precipitation due to climate change will have variable impacts on surface water levels in some areas [1]. As such, the Sahel water resources will be the most vulnerable in the region because of higher temperatures and lower rainfall. Also, current levels of groundwater resources and their exploitation are shaped by many forces from physical to socio-economic variables as characterized by climate change predictors like increased temperatures, erratic, and variable rainfall. During the present century, these are likely to lead to a decrease in recharge, as more water will be lost to transpiration and evaporation. With that has come widespread pollution, degradation, depletion of the resource, limited rainfall, and the menace of drought. Accordingly, the problem is further compounded by other forces located within the larger regional hydrology. This includes ineffective policy, rising demands, and the lack of monitoring. This contrasts deeply with the recurrent water abundance in the coastal lower South in the rainforest axis along the Gulf of Guinea area of the region [11-18]. Given that the current policy overlooked continual access in nations in the zone over the years, water demands across sectorial levels with allotment to agriculture, industry and households saw variations [19]. Even as access to potable water resources dropped in some places, meeting the stipulated global thresholds on water quality under the Millennium Development Agenda remains elusive in some of the nations [20]. With all that, changes in the availability of surface water due to climate change will further drive up the demands on groundwater as more potable water will be needed in 25 years, with much of that destined for urban populations [21]. Just as the increasing promotion of powered wells, particularly on large business farms, creates extra strain on the zone’s non-renewable aquifers. Technological changes probably pose the greatest threat to groundwater sustainability given the additional stress placed on aquifers from the growing use of motorized pumping [22]. Further, the demand has increased significantly since 2001 due to growing populations and the efforts to improve the availability of drinking water. Thus, changes in surface water owing to climate change will further increase the demands on groundwater as much drinking water will be required in 25 years, with the highest needs for urban populations [23]. Regrettably, it sems that the current water management framework which mostly embodies national priorities, usually overlooks local levels, where water assets are consumed and managed. For that, water issues have emerged as management concern in the zone due to many factors [24]. In these places, the databases that do exist are generally kept by national institutions and are not available to those who manage water while the institutional capacity to manage water, especially at the subnational and local level, remained generally weak [25]. Surely, the key threat that cannot be overlooked in West Africa is the linkages among the nations for water assets [26]. Just as these resources represent a large potential, but the region continues to be confronted with situations detrimental for its development [27]. Considering that water resources are subject to increasing demands in the absence of a regional water policy. The problems therein emanate through pressures from rising use, access to drinking water and sanitation. Despite the concerns in those settings for respectively 40% and 60% of the population, irrigated agriculture remans marginal [28]. Furthermore, while the potential for hydroelectricity is enormous, just only 16% of this capacity is exploited [29]. Surely, the scale of climate change stressors with negative effects, pose increasing threats to water resources as well [30]. Since West Africa also faces institutional uncertainty which undermines the execution of water related policies and laws within the countries [31], the zone suffers from the scarcity of qualified personnel to undertake basic testing, and limited capital for amenity upgrade in the face of scarce water assets and the unprecedented dilapidation by elements like contamination, invasive aquatic flora, silting, and the non-maintenance of existing water infrastructure [32]. There is also little or no public enlightenment campaign directed at those whose behaviours affect water use. Because water is essential [33], any step ahead, requires how to balance out water allotments for industrial and ecological usages over time [34]. Notwithstanding the scope of these challenges, very little has been done in the literature to analyze the issues in water resources use across the study area using the mix scale model [35-40]. For that, this paper will fill that void in research by focusing on the challenges in a select group of countries in West Africa. Emphasis is on the issues, trends, impacts, factors, and environmental analysis. For the purposes of analysis, the paper uses mix scale methods connected to the techniques of GIS and descriptive statistics together with secondary data [41-44]. The paper has five objectives and sections. Of the five sections in the paper, parts one to three cover the introduction, methods, and the results along with the factors, impacts, and initiatives. Sections four and five cover the discussions and conclusions. Accordingly, the initial two objectives cover the recent issues in water resources management and assessment of the risks of water depletion. The third and fourth aims appraises water use and the impacts, as well as the limiting elements. The last and fifth objective is to design a decision support tool for managers.
2. Methods and Materials
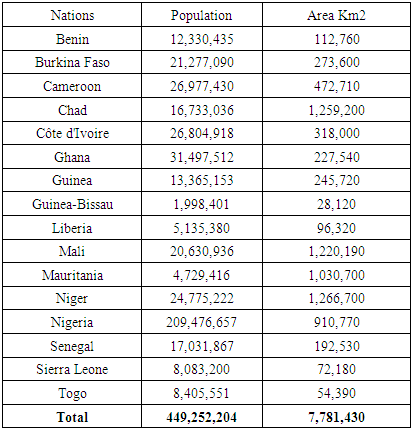
The Study Area (Figure 1) with a population of 450 million people occupies a land mass of 7,781,430 km2 in West Africa (Table 1). Situated in the Sub-Saharan Africa region, the area consists of 16 member countries of the Economic Community of West Africa States (ECOWAS). The countries range from Benin, Gambia, Ghana, Liberia, and Mali to Nigeria. With a vast population, the region accounts for just about one-third of sub-Saharan Africa under a diverse eco-system where dominant conditions vary from desert to tropical rainforests [45]. The zone stretches from the Gulf of Guinea to the Atlantic and the Northern Desert ecozone with shorelines of major rivers rich in biodiversity where many depend on surface H2O fonts like lakes to meet potable water needs [46]. While the West African region’s hydrology is dominated by the river Niger which drains much of the area. Several of the region’s river paths contain catchments and dams linked to reservoirs, such as the Senegal basin, the Niger basin, the Volta basin, and the Chad basin that are essential sources of water [47-48]. In a zone where the groundwater demands have risen notably going back to 2001 as result of population increases, the area boasts of 28 major river basins that extends across national borders. The main watercourses take their source in well-watered regions before crossing the Sahel zones where there have been chronic shortages of rainfall since the early 1970s [49]. Regardless of the marked contrasts between the wetlands and arid areas, these transfers still show the interdependence of West African nations in the use and management of freshwater [50].Table 1. The Population and Size of The Study Area West Africa
 |
| |
|
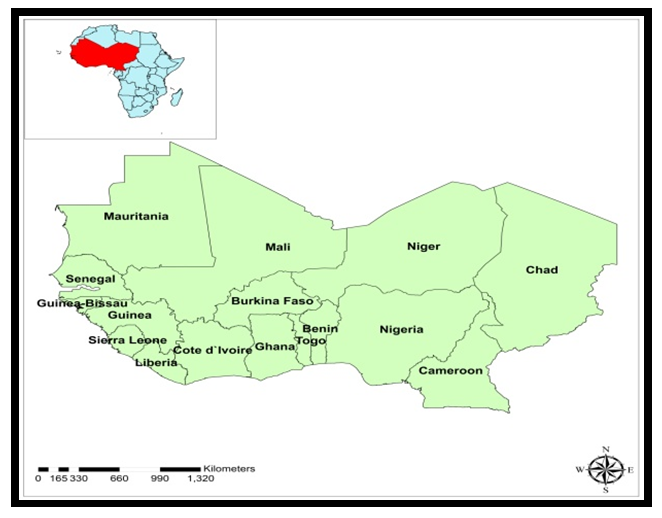 | Figure 1. The Study Area South Africa |
Considering the fluctuations in water assets involving surging groundwater demands. There are several non-renewable aquifers and renewable water resources in the West African zone, where the projected increments in temperatures and variabilities in the precipitation levels, because of changing climate, would probably limit aquifer recharge while growing the need for more water consumption. Still, the region faces H2O stress, degradation, risks from pollution amidst regular threats from climate change, population surge and flow regime shift by dams [51-52]. With the potency and recurrency of aridity fully visible within much of these multinational head waters. The challenges of water deficits are so rampant that, tensions do occur sometimes between the riparian nations. Given the potentials for different uses, the water assets of the zone are still not fully exploited. From regional statistics, the allocation of water resources in the region (minus Cameroon and Chad) sits as presently at 11 billion m3 annually for an existing 1,300 billion m3, that is below 1%. Of these, farming takes out 75% of the allocations, households use 17%, and industry accounts for about 7% of the total. Even though it accounts for certainly the largest share, agricultural water use allocation remains quite meagre. The mater is further compounded by the underdeveloped nature of irrigation systems despite the potentials compared to the other sub regions of the continent. In fact, of the 75.5 million hectares of arable land that are available in West Africa, just 1.2% (917,000 ha) is set aside for irrigation, and the other 0.8% (635,000 ha) is utilized efficiently. In the face of such anomalies, the distribution proportions of freshwater assets continue to rise quite fast. There are also ample possibilities of a six-fold surge from 2000 and 2025, should West Africa’s present potable water and food sufficiency levels persist. Even at that, the water use could grow by 11 billion to over 65 billion m3 annually coupled with the incidence of pollution risks. In the face of all the challenges, the ECOWAS zone, which put into place many programs, has marshalled out strategies to improve current approaches to water management at the national levels. For the good of effective decision making and better understanding of the trends, this should be assessed to determine the state of water usage regionally. Given the gaps in previous studies in West Africa and the capacity of the region, the current study provides ample chance to analyze the trends from a temporal spatial perspective using GIS.
2.1. Methods Used
The method used in the study stresses the applications of GIS and descriptive statistics in the analysis of water resource issues in a mix scale with GIS mappings to display the trends spatially. The spatial information for the research was obtained from the Federal Ministry of Water Resources of Nigeria, The Food and Agricultural Organization (FAO), The African Development Bank (ADB), The United Nations Economic Commission for Africa (ECA), The World Bank, the United States International Development Agency (USAID), The United States Geological Survey (USGS), the United Nations Environment Program (UNEP), and the state archives of many of the West African nations. All in all, the data on freshwater withdrawal by industry and the percentage of population with access to safe water, and the regional distribution of water by hydrological units was obtained from the World Bank Group and the Food and Agricultural Organization (FAO) water information network. Elsewhere, miscellaneous information on regional trends were procured through Non-Governmental Organizations (NGOs) and the USAID for the periods of 1980 to 2017, while the Federal Government of Nigeria along with the states and multilateral agencies and other entities such as Canada’s International development Research Council (IDRC) and the Canadian International Development Agency (CIDA), and Partnership for Environmental Governance in West Africa – PAGE, West Africa Programme of the International Union for Conservation of Nature (IUCN-PACO), offered information on the critical nature and prospects of water access. Just as the national geographic identifier codes of the countries were used to geo-code the information contained in the data sets. This information was processed and analyzed with basic descriptive statistics, and GIS with particular attention paid to the temporal-spatial trends at the national and regional levels in a mix scale. The relevant procedures consist of two stages outlined below.
2.2. Stage 1: Identification of Variables, Data Gathering and Study Design
The initial step involves the identification of variables needed at the national and regional from 1980-2017. This is intended to analyze the temporal-spatial aspects of water resource use and the factors shaping access. The variables involve socio-economic and environmental data including the quantity of fresh water, urban population with safe drinking water access, rural population with potable water and total population access to clean water. Added to that are the volume of total renewable water resources, renewable water resources per capita and total water withdrawal per capita. The other hydrological indicators encompass the average annual precipitation, the national rainfall index, sectoral water transfers under the aegis of industry, municipal, and the agricultural sector. In the same order, are the variables made up of agricultural land area, average agricultural land areas, agricultural water withdrawal as percent of total, industrial water withdrawal as percent of the total, municipal water withdrawal as percent of the total, the dept of water, volume of water, population and area, long-term average annual precipitation in depth. Other indicators of importance range from percentage change to potable water access rates, totals, averages for urban and rural populace and the averages. Additionally, access to databases that are accessible within the national and regional repositories in West Africa and other NGOs and multilateral agencies quickened the search process. The process continued with the design of data matrices for socio-economic and environmental variables covering the periods from 1980-2017. The design of spatial data needed for the GIS analysis required the identification of applicable digital national, regional watersheds and boundary lines covering the study periods of 1980-2017 and others. This entailed the gathering of electronic version of available hydrological and land cover maps containing water profile, trends encompassing water stress, and deficits, ground and surface water, and water distributions in the countries, basins, region, and other spatial units of West Africa for the periods of 2002-2011. As mentioned earlier, some of the information came from the FAO Aqua stat information system, The Nigerian Federal Ministry of water Resources, The United States Geological Survey (USGS), the USAID, United Nations Environmental Program (UNEP), the Network of African Science Academies (NASAC) – the ‘African Ministers’ Council on Water’ (AMCOW) and the ‘African Water Facility’ (AWF) as well as the Senegal River Basin Organization (OMVS) and the Niger Basin Authority (NBA). This was made possible by the retrieval of spatial data sets of shape and grid files from the Aqua stat, The Food and Agricultural Organization Global Water Resource Information System in digital form using Arc GIS 10.4 and SPSS 20.0. With boundary lines unchanged, a common geographic identifier code was assigned to each of the units to ensure analytical coherency.
2.3. Stage 2: Step 2: Data Analysis and GIS Mapping
In the second stage, descriptive statistics and spatial analysis were employed to transform the socio-economic and water data into relative measures (percentages/ratios). This process generated the parameters for measuring the volumes, differences, water usage by industry, agriculture, households, agricultural water withdrawal as percent of total, industrial water withdrawal and the other variables. This was facilitated by measurements and comparisons of the trends over time. While this approach helps track the levels of use, the tables and graphics highlight potentials, availability, the total population access to clean water, and total water withdrawal per capita. The remaining steps involve spatial analysis and output (maps-tables-text) covering the study period, using Arc GIS 10.4. The spatial units of analysis consist of states, regions and the boundary and locations where water usage and other activities is occurring. The geographic data for West Africa which covered its boundaries and states, also includes ecological data of land cover files, and paper and digital maps from 1980-2017. The outputs of the spatial data were mapped and compared to see the dispersion of the trends, usage, deficit, and the socio-economic factors fuelling the proliferation of water management challenges in the study area. Given that the official boundary lines between several states in the region stayed stable, it was possible to assign consistent geographic identifier code to the respective units to maintain robust analysis. With its relevance, descriptive statistics was quite instrumental in processing the raw data on environmental variables into final forms. The process helped delineate the spatial locations and patterns of flow, usage, the sectoral distribution, and other indicators associated with water use and quality in the study area.
3. The Results
This part of the research focusses on the temporal and spatial analysis of water use trend in the study area. In using descriptive statistics there is a prime focus on the analysis of water use trends, overall water withdrawals per capita in the nations at the regional level, coupled with the current state of sectoral water removal levels and ratio of the population with safe drinking water access across the west African region. The other segments cover the accumulated effects of water use over the years in a host of places in the study area. Much of the focus covers the interactions between environmental indices and other climatic parameters from aridity, temperature, rainfall patterns and depletion risks in the zone. This is followed by the remaining parts of the section encompassing GIS mappings, and the acknowledgement of factors associated with the changes in West Africa’s hydrology and the efforts of stakeholders actively involved in the happenings.
3.1. Renewable Water Use Trends 2002-2017
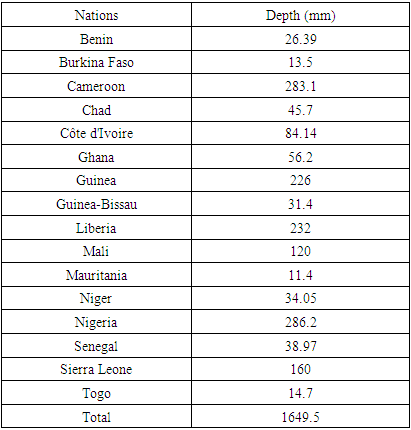
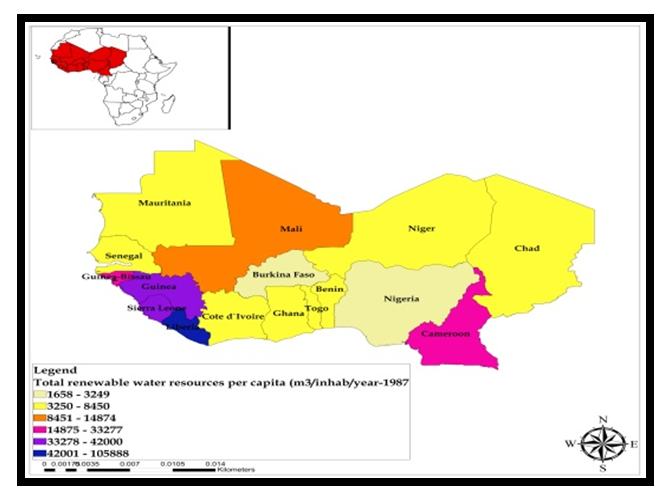
The overall renewable water resources depth for study area at 1,649.5 mm again unveils a familiar pattern with some low-lying Atlantic states holding more stock in the resource in 1977-2017. Accordingly, the table highlights the primacy of neighboring Nigeria and Cameroon with over 280 mm at average of 284 values in depth followed by a duo of countries (Guinea and Liberia), who held about 226-232 mm in the same resource. Under the medium ranking, comes Sierra Leone and Mali under identical volumes in renewable water resources measured at 160-120 mm all through 1977-2017. Even though the lower coastal states are characterized by abundant hydrological stock, five of them (Benin, Côte d'Ivoire, Ghana, Guinea-Bissau, Togo) possessed minimal values in total water resources of 26.39 mm-84.14, 56.2 mmm to 31.4-14. 7mm.The Southwest Desert nations of Burkina Faso, Chad, Mauritania, Niger, and Senegal also saw much lower values in total renewable water resources estimated at 13.5, 45.7mm, 11.4mm to 34.05 mm to 38.97mm (Table 2).Table 2. Total Renewable Water Resources (10^9 /year), 1977-2017
 |
| |
|
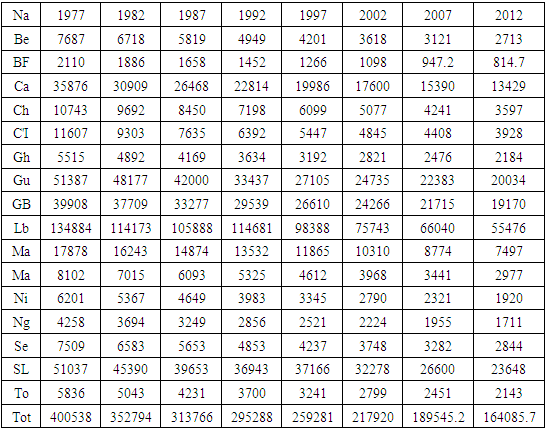
The values for per capita water resources as at 1977-2012 involves an overall average of 263,523.81 for the entire region of West Africa. Beginning at an opening maximum volume of 400,538 m3 in 1977 fiscal year, but over time during 1982 through 1987, the water shares for the inhabitants dropped from 352,794 m3 to 313,766 m3. The downward trend in per capita water uses not only went unbated again at similar values of 295288 m3, 259281m3 to 217920 m3 in 1992, 1997 and 2002. In the last 5 years of 2007-2012, the region’s per capita water resources total fell further by 189,545.2m3 to 164,085.7 m3. Of the nations in the region within the lower coastal zone, Liberia which outpaced all others saw its per capita water assets of 134,884 m3 in 1977 fall to 55,476 m3. Even if Liberia’s distribution levels stayed firm and somewhat stable at 114,173 m3, -105,888 m3, 114,681 m3 between 1997-1992, in the face of mounting fluctuations therein, the nation’s per capita water assets plummeted further at different scales of 98,388m3, 75,743m3 to 66,040m3 -55,476 m3. The two other nations Guinea and Sierra Leone much closer in per capita water ranking, had identical opening values (of 51,387-48,177 m3, 42,000m3, 33,437 m3 to 51,037-45, 390m3 to 39,653m3-36,943 m3) by 1977 to 1992 correspondingly with notable deficits in those periods. In 1997 through 2012, the individual total renewable water resources per capita averages in those periods reached 22,858 m3 to 28,668 m3 at combined mean value of 25,763 m3 (Table 3).Table 3. Total renewable water resources per capita (m3/inhab/year, 1997-2012
 |
| |
|
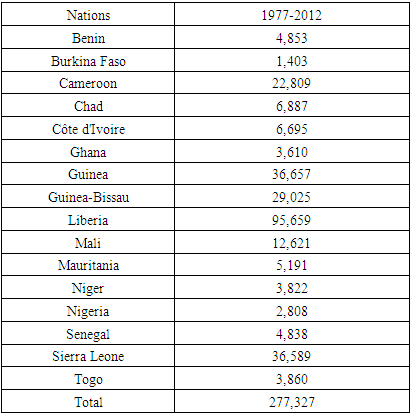
Elsewhere in the third category of ranking Guinea-Bissau, Cameroun and Mali stood apart from those nations below in renewable water resources per capita at appreciable levels. Guinea-Bissau’s water accounts of 39,908 m3, 37,709 to 33,277 at a combined average of 36,964 m3 in the initial 3 periods of 1977, 1982, 1987 dropped to 24,260 m3 all through 1997, 2002, 2007 and 2012. On the one hand, Cameroon on its part maintained similar quantities (35,876 m3, 30,909 m3 to 26,468 m3 – 22814 m3) from 1977 to 1992 coupled with back to back drops in the same order of 19,986 m3, 17,600 m3 and 15,390 m3 to 13,429 m3 (Table 3). On the other total renewable water resources, the per capita for Mali in the first four periods of 1977 to 1992 ranged from 17878 m3, 16243 m 3 to 14874 m3 and 13532 m3. In the remaining years of 1997 to 2012, Mali again posted visible declines of 11,865 m3 -10,310 m3 and 8,774 m3 -7,497m3. With these trends evident in most of the nations from Burkina Faso to Togo. One thing worthy of note in all these is the situation in Nigeria from 1977 to 1992 where the initial renewable water assets of the country at 4,258 m3, slid to 3,694 m3, 3,249 m3 to 2,856 m3 and continued by 2,521 m3,-2,224 m3 to 1,955m-1,711m3 (Table 3). Out of a regional total and average of 277,327 m3 to 17,333 M3 (Table 4). See that the individual averages reflective of the actual rankings in place among the nations between 1977-2012 sets one of them apart. Accordingly, Liberia held on to the largest per capita value of total renewable water resources of 95,659 m3, as Guinea and Sierra Leone posted identical quantities of over 36,000 m3 together with Cameroon, Guinea-Bissau and Mali who averaged between 22,809 m3 to 29,025 m3 to 12,621m3. Aside from over 6,900 m3-5,191 m3 in average per capita renewable water resources for Chad, Côte d’Ivoire, and Mauritania. The leading nations of Nigeria and Ghana finished far below with values estimated at 3,610m3 - 2,808m3 all through 1977-2012 (Table 4).Table 4. Renewable Water Resources Per Capita (m3/inhab/year Average
 |
| |
|
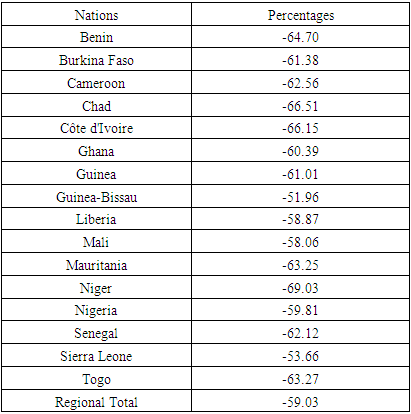
Considering the mounting fluctuations as witnessed among the nations in the region, the study area saw overall declines at a rate of -59.03% between 1977-2012. While nations like Liberia and Mali experienced declines of over -58% coupled with Nigeria and Sierra Leone whose rates of declines stood at -59.81% -53.66%. The group of 11 other nations from Benin to Togo posted renewable water resources per capita average losses of over 60%, with Niger, Chad, and Côte d'Ivoire as those with the highest losses of -66.51% to-69.03% from 1977-2012 (Table 5).Table 5. Total Renewable Water Resources Per Capita (m3/inhab/year Percentage Change, 1977-2012
 |
| |
|
3.1.1. Overall Water Withdrawal Per Capita 1980-2002
The total withdrawal average per capita in 1980-1991 through 2000-2002 for the entire region at 97.43m3 to 107 m3, exemplifies the extent of water use among the countries in the study, and the availability in place to some degree. Taking a cue from the distribution patterns, both Mauritania and Senegal do boast of the largest total per capita water transfers with the former using up 449.2-557.3m3 and the later just about 197.3-213.6 m3 in the same periods. There is also the case of other places like Guinea whose total per capita water transfers moved from 137.5 m3 to 60.56 m3. The same thing goes with the strong showing of Nigeria and Côte d'Ivoire as both maintained identical total withdrawals of over 50% respectively (at 63.45 m3-80.13m3 to 64.34-81.13) enough to serve their demands, considering their various population levels. From the temporal trends between 1980-2002, the volume of total per capita water transfers in these first group of states continued to be on the rise apart from Guinea where it dropped by -55.95%. In the 2nd group as shown by Chad, Cameroon, and Guinea Bissau. The individual water transfers reveal a surge of 33.47 m3-94.33 m3, 37.02 m3 -60.08 m3 to 15.62 m3-135.2 m3. Given that this represents increases at rates of 181.18%, 62.29% to 765.55% for these three countries correspondingly. The recurrent skids in Benin, Burkina Faso, Liberia, and Sierra Leone in per capita water distributions, involves 24.26 m3-17.82 m3, 35.63m3-58.22 m3, 59.33-36.24 m3, to 59.33-36.24 m3 and 91.7m3-38.11 m3 during 1980-2002.
3.1.2. Sectorial Water Withdrawal Levels
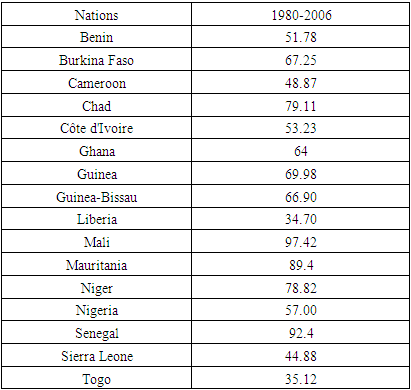
The extent of water withdrawals within sectors is of great relevance in the audit of the state of water use in the region. This extends to agriculture, industry, and municipal domains in the different periods 1980-1991,2000-2002 to 2005-2006. During those years, agriculture as the largest consumer at the regional level with an average of 63.2% in total water withdrawal used up 69.60%, 58.74 to 61.13% of the asset. In as much as, such level of usage far exceeds the pace among the two other sectors (industries and municipalities) across the study area. Municipal water allocation average of 26.97% ranks second while industries at 9.82% finished 3rd on the regional listings. With time, the percentage of municipal water allocation which changed from 23.54, 29.10 to 28.19 outpaced the industrial levels of 6.84%, 12.23% to 10.39%. In breaking the percentages of sectoral water allocations across subregional lines and ecozones among those nations over the years. Some of the upper northwest Sahel states with high thirst for water and frequent aridity, diverted more water towards agriculture. In other words, these nations guzzled more water assets.In showing the urgency of water use in the farm sector in the zone especially the upper Sahelian part in 1980-2006. As mentioned earlier, the quintet of nations in the area (Mali, Senegal, Mauritania, Chad, Niger) emerged with the largest proportions of water allocation towards farms. Of these states in Northwest areas, both Mali and Senegal used up over 90% (97.42) for farming, whereas Mauritania, Chad and Niger also diverted enormous volumes (89.4%, 79.11%-78.82%) to the sector individually at the same time. When water transfers for agriculture all through similar periods of 1980-2006 exceeded over 60%-50% in a mix of seven other countries (of Burkina Faso, Ghana, Guinea, Guinea-Bissau, Benin, Côte d’Ivoire, and Nigeria). In the trio of lower West African water abundant states of Sierra Leone, Liberia, and Togo, farm water use, therein accounted for 44.88, 34.70, to 35.12 (Table 6).Table 6. Agricultural Water Withdrawal As % of Total Water Withdrawal (%)
 |
| |
|
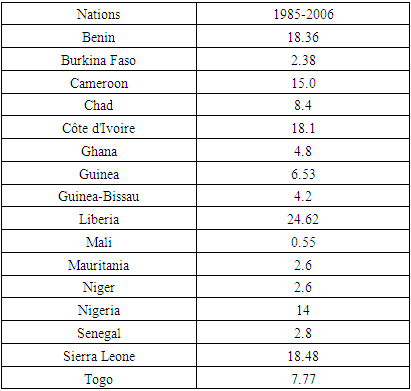
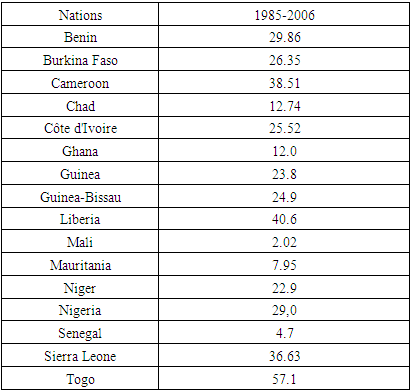
With most of the industrial water withdrawals during 1985-2006 more pronounced in the Lower West region. Liberia outpaced every other nation considering the 24.62% in sectoral water use while Benin, Côte d'Ivoire and Sierra Leone and Nigeria followed closely with over 18% -14% correspondingly. Being arguably the lowest users in the zone, the allotment proportion for Mali, Mauritania, Niger, Senegal, and Burkina Faso estimated at 0.55% -2.00% plus stood below those of the nations in that category (Table 7). Aside from the low proportions of water allotment of mostly single percentage digits (2.02%-7.95% to 4.7%) for municipal usage in Mali, Mauritania, and Senegal by 1985-2006. In the lower Atlantic region, hydrological diversions to municipalities in Togo, Liberia, Cameroon, and Sierra Leone surged to upper double-digit levels of 57.1 to 40.6%, 38.51-36.63% with the first two nations as highest municipal water users. The 9 other nations where municipal water use found ample use at the medium levels of 12.0 to 29.0 as percentage of the total consists of a group of three of Northwest Desert nations of Burkina Faso, Niger and Chad with the proportions at 26.35, 22.9-12.74% and some six others (Benin, Côte d'Ivoire, Ghana, Guinea, Guinea-Bissau, Nigeria) in the Lower Atlantic zone whose use levels of 12.0-29.0 amounts to the percentage of the overall (Table 8).Table 7. Industrial Water Withdrawal As % of Total Water Withdrawal (%)
 |
| |
|
Table 8. Municipal Water Withdrawal As % of Total Water Withdrawal (%)
 |
| |
|
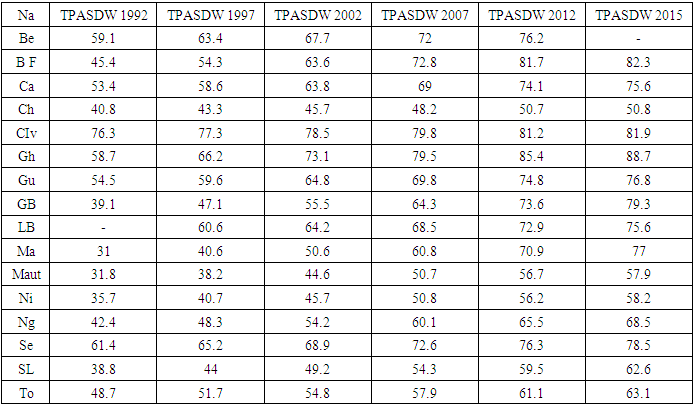
3.1.3. Population with Safe Drinking Water 1992-2015
Assessing the state of water use in the study area requires an in depth look at the regional averages under the three prevailing categories of total, rural and urban population highlighting hydrological security over the years in the area (Table 9-10). The total average in population access to potable water in the region went from 47.18-53%, 56.06, 64.4% in 1992, 2002 and 2007. In following periods of 2012-2015 the penetration of clean water extended far deeper to the region’s overall population at rate of 69.8 to 67.3%. In terms of clean water access within the nations from 1992-2015. Given that a trio of nations (Ivory coast, Ghana, and Senegal) in the Lower Atlantic accounted for higher penetration levels than the others. Of these areas, Ivory coast went from 76.3%-81.9%, Ghana followed up with 58.7%-88.7% and Senegal finished at 61.4%-78.5% from 1992-2015. Nigeria on its part, stood at a much lower level (Table 9). Seeing the variances in the display of the classifications, the proportion of the total population with clean water access in Nigeria between 1992 seems dismal, knowing the size of the nation and the annual budget compared to the nations ranked ahead of her. With no disrespect to those nations who meritoriously are deserving of their spots in the ranking, even though limited by the population size of Nigeria which is not an excuse. There are opportunities for the geopolitical zones in Nigeria to prioritize access as policy endeavor in the design of an efficient water action plan befitting to the nation in the 21st century.Table 9. Total Population With Clean Access to Drinking Water
 |
| |
|
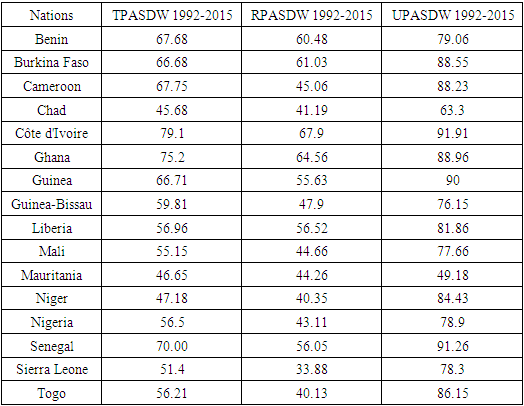
At the country level, the proportion of complete availability of clean water at over 79.1-75.2% to 70% in a trio of nations comprising of Côte d'Ivoire, Ghana, and Senegal as a success story worthy of mention stands as the highest-level pertaining to the zone during the periods. Under the next classification of total clean water access involving the second tier of states identified as Benin, Burkina Faso, Cameroon and Guinea, the group averaged 67.20%, as the separate allocations amounted to 67.68%, 66.68%, 67.75% to 66.71%. Similarly, the third group of six nations (Guinea-Bissau, Liberia, Mali, Nigeria, Sierra Leone, Togo) also combined for 56% in overall rate of population with drinkable water access far ahead of the trio of upper west African desert ecozone nations (Mauritania, Niger, and Chad) listed in the fourth and the last group at combined access rate of 46.5% (Table 10).Table 10. Water Access Rates For Total, Rural and Urban Populations, 1992-2015
 |
| |
|
Granted the consistency of Côte d'Ivoire and Ghana’s primacy in rural population access to clean water at 67.9%- 64.56% in 1992-2015, the identical levels of 60.48- 61.03% for Benin and Burkina Faso in the same period seemed within the reach of Guinea, Liberia, and Senegal who posted a group average of 56.6%. With the third group of eight nations’ (Cameroon, Chad, Guinea-Bissau, Mali, Mauritania, Niger, Nigeria, Togo) water access average at 43.33%. The nation of Sierra Leone in the number four group solely maintained 33.88% in rural population water availability below her other neighbors from 1992-2015. From the pace of urbanization in West Africa over the years, there exists an overwhelming gap between rural and urban dwellers in the proportion of water access with cities far ahead. Based on the table, a trio of francophone nations of Côte d’Ivoire, Senegal, and Guinea at over 91% -90% rates held the top spots in the urban category while 6 nations Burkina Faso, Cameroon, Ghana, Liberia, Niger and Togo dominated strongly in the second pole at 86.36% as five others including Benin, Guinea-Bissau, Mali, Nigeria, and Sierra Leone at 78% rounded out the third position in regional rankings in the urban population water access rate. Within the same periods, the two desert ecozone nations of Chad and Mauritania in the upper side of the region at 63.3-49.18% averages in urban population water access, occupied the bottom of pile during those years (Table 10).
3.2. Impact Assessment
From the rise in water resource use in the face of mounting issues throughout the host of nations in the study area. Surely, there are wide ranging impacts as demonstrated in the various sectors of the economies at various scales regarding the emergent risks, the differences and patterns peculiar to the Sahel and the Gulf of Guinea ecozones. Due to the obvious differences and the way water insecurity in one zone has historically affected the other. The coverage in this section is directed solely to physical effects, despite the economic and technological implications.
3.2.1. Physical and Ecological Effects
Even though the complicated links shaping the West African climate makes it hard to forecast with precision. The effects of changing climate will exact heavy strain on the water resources of the zone. For that, most climate model projections agree that temperatures will rise over the next 35 years, but the scope and proportions vary. Under those circumstances, the general predictions differ even more regarding changes in precipitation, but it appears likely that rainfall will become less reliable and more variable, with increases during extreme events. The changes in temperature and rainfall will likely have negative effects on the availability of groundwater and surface water, and thus create challenges for the equitable allocation of water in transboundary river basins. To that effect, rising sea levels, violent storms, and higher storm surges associated with climate change will negatively affect coastal populations and natural resources, especially in the low-lying areas. With all these attributed to problems of uneven distribution, population boom and poor management of existing supplies. Current enquiries reveal that by 2030-2050, changes in temperature and precipitation due to climate change will have variable impacts on surface water levels in some areas of the region as the arid Sahel water resources will be the most vulnerable in the region because of higher temperatures and lower rainfall. Furthermore, the region’s river flows are expected to drop by 15-20 percent in (2020) and 20-40 percent during (2050). Surely, climate change seriously threatens water-dependent sectors in West Africa like agriculture, livestock production, and fishing given the stress on water.
3.3. GIS Mapping and Spatial Analysis
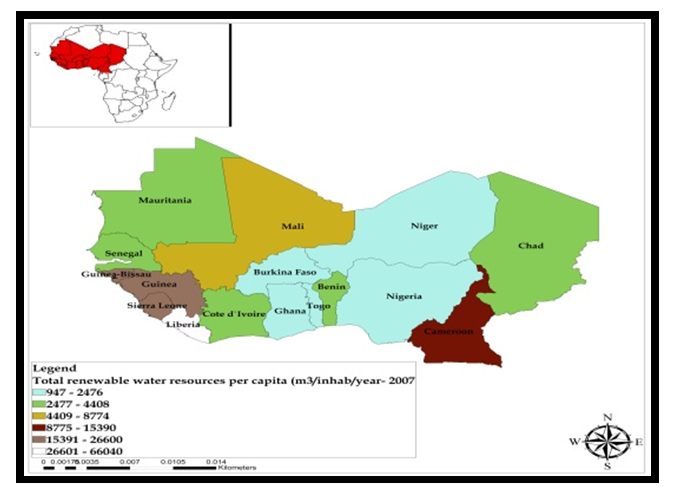
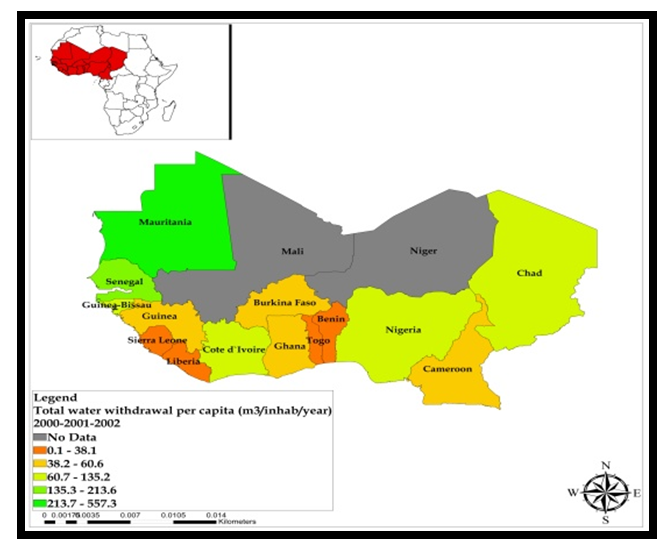
The GIS analysis highlights spatial patterns of water use, sources, availability, and distribution. This entails the various parameters of water use trends and flows throughout the sectors reflective of source type, scale, landuse, and climate. The indices include clean water access among urban, rural, and general population, rainfall volumes and national rainfall index deemed critical in water security in West Africa. From the portrayals across points in space, such water parameters like industrial, municipal, agricultural water withdrawals and the allotment of water to cultivated land areas in the various countries did standout. The information as expressed via geo-analytics of various scales and colors symbolize the evolving nature of water uses in the region. The ability to identify spatial-temporal features of these transactions with GIS, is very important in illustrating the state of water resources, and the capacities, despite the current issues and forces driving changes in the hydrology. The volume of total renewable water resources between 1977-2017 appears fully concentrated in the Lower Southeast areas of Cameroon and Nigeria coupled with some presence in Guinea and Liberia estimated at 160.1-286.2 m3. Even at that, and nearby in the Southwest, the nation of Sierra Leone denoted in blue, together with a duo of other nations (Cote d’ Ivoire and Mali) in light blue, still held on to water assets estimated at 120.1-160.0-56.3-120.0 m3. In the remaining places, Ghana and Chad in opposite geographic directions posted total renewable resources of 39.1-56.2 m3 at levels ahead of the quantity of the last batch of water assets on the lower scale measured at 11.4-14,7 to 14.8-39.0 in half a dozen nations (Niger, Mauritania, Burkina Faso, Togo, Benin, Niger, Senegal, Guinea Bissau) scattered in the North and Southerly directions in the zone. In as much as, a quintet of lower south nations (led by Liberia, Sierra Leone, Guinea, Cameroon, and Guinea Bissau) in the colors of blue, purple, and pink outpaced the others in the distribution of total renewable water resources per capita in 1987. By 2007 a slightly similar pattern emerges again with Liberia in white as Sierra Leone, Guinea and Guinea Bissau held on to a much larger share of renewable water resources in the area. By the period 2000-2002, a contrasting scenario emerges along the upper northwest part in which Mauritania and Senegal in green outpaced the other nations in total water removal per capita by 217.7-557.3 to 135.3-213.6 m3 (Figure 2-Figure 5).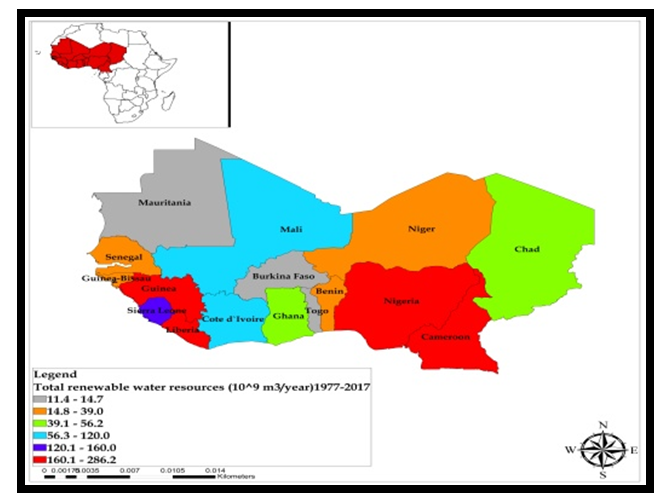 | Figure 2. Total Renewable Water Resources, 1997-2017 |
 | Figure 3. Total Renewable Water Resources Per Capita, 1987 |
 | Figure 4. Total Renewable Water Resources Per Capita, 2007 |
 | Figure 5. Total Water Withdrawal Per Capita, 2000-2002 |
The spatial distribution of the percentage of people in urban areas with safe drinking water access in the respective nations of the west African region in 2007 are distinguished under different colors of blue, yellow, green, orange to red. From the map, the locations in space with the highest values of 87.6-90.9% to 91-92.3% in the access index extends from Ivory coast, Burkina Faso, and Senegal as represented in blue, coupled with the back, and forth spread out of the lower South nations of Guinea, Cameroon to the upper North nation of Niger. In the second category identified in green and yellow colors, the rate of city populace with potable water availability in the order of 80.1-82% to 82.7-87.5% starts in the upper desert nation of Mali followed by firm clusters along Guinea Bissau, lower zones of Libera up to neighboring Benin and Togo in the Southeast corridor. Another dimension to the geography of clean water access in urban population in the 2007 fiscal year as displayed on the map, consists of the dispersal of a third group availability ratios of 52.4-66.7 to 68.8-80% in both orange and dark red or blood colors scattered from Sierra Leone, Nigeria to Mauritania and Chad in the Northwest and Northeast sides of the study area (Figure 6). 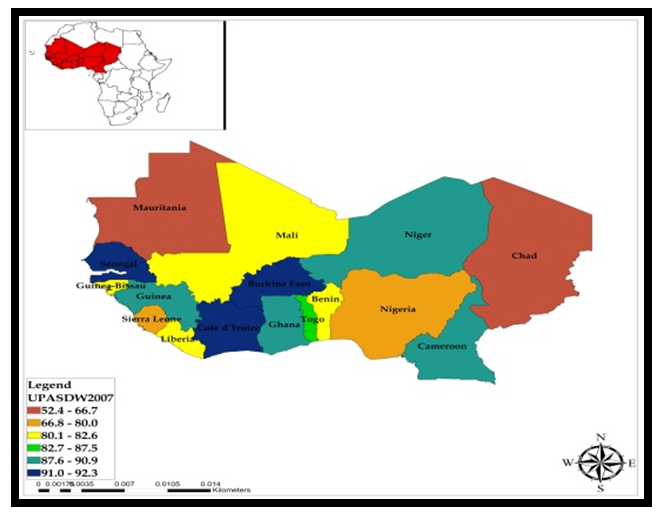 | Figure 6. Urban Population Access to Safe Drinking Water, 2007 |
The spatial distribution of urban population with access to safe drinking water in 1997 presents contrasting scales under different colors (green, red, yellow, and orange) and scenarios. Since much of the spots with the high percentages of 77. 7-83.3 to 83.4-91.1in water access stayed visibly firm under green colors in mostly 6 of 7 coastal belt nations (Senegal, Guinea, Cote d Ivoire, Ghana Burkina Faso, and Cameroon). The medium percentage (65.3-74.6 to 74.7-77.6%) levels in potable water availability represented in the areas stretches between neighboring Sierra Leone, Liberia in the South Atlantic to up North in Niger, and further South again towards Nigeria and Benin Republic. Besides that, note that a trio of the other places (Mauritania, Mali, and Chad) in orange and red colors that endured slightly lower access percentage seemed largely present along the upper Sahelian zone compared with Guinea Bissau in the lower southwest (Figure 7). 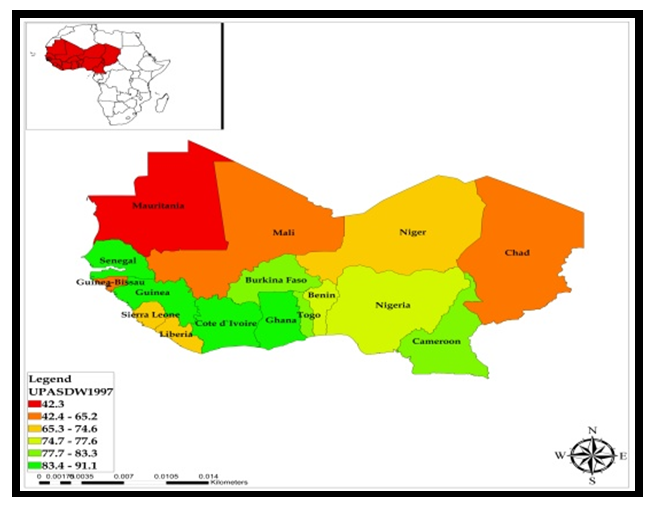 | Figure 7. Urban Population Access to Safe Drinking Water, 1997 |
Considering the scope of spatial disparity pertaining to water availability in 2007, out of the three categories of activities, see that the highest levels in the percentages (56.8-59.2 to 59.3-69.17) in the distribution of safe drinking water availability in rural communities were more pronounced in the middle of the region. This entailed large presence of the highest points in that capacity as symbolized in the light and dark blue locations in Senegal, Guinea, Cote Ivoire, Ghana, Benin, and Burkina Faso. In the second cadre of index categorized by 43.1-51 to 51.2-56.1% in countryside water availability, the geographic patterns of the trend run through a couple of nations like the low-lying coastal states of Liberia, Guinea Bissau, Togo, Nigeria, and Cameroon to the duo of Upper Sahelian states of Mauritania and Mali. Additionally, the underserved places in the access to potable water under the yellow and light green colors consists of Sierra Leone in the Lower South as well as the northmost areas of Niger and Chad (Figure 8). 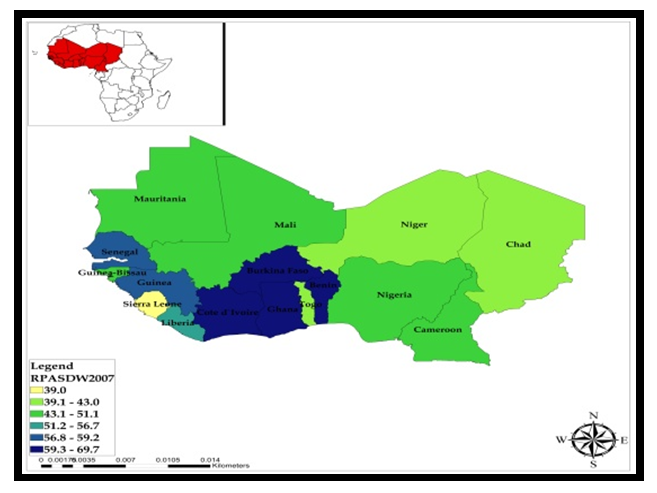 | Figure 8. Rural Population Access to Safe Drinking Water, 2007 |
The degree to which rural population in west Africa obtained safe drinking water in 1997 can be better observed by looking at the classification levels of the various nations in the zone. With the index predicated on the high to low access points in space, the presence of higher access points of 60 plus -51% starts from Cote d’Ivoire in the first place. Furthermore, therein in the study area, about 55.7-67.3% of the rural populace enjoy the luxury of safe drinking water availability alongside Benin republic at 51.8-55.6% where access to drinkable water stands relatively high by rural standards in West Africa. In the places where the ratio of water availability ranged from 34.8%-39.7 to 39.8-51.7%. Note that they stretched deeper from Senegal, Guinea Bissau, Guinea, and Liberia in the lower Southwest to those in the center comprising of Togo, Ghana, Burkina Faso to Cameroon and Chad. Elsewhere in the third water access levels of 28.0%, 28.1%-34.7% comes the heavy presence of Sierra Leone in dark green and Nigeria and a trio of upper Sahelian nations of Mauritania, Mali, and Niger (Figures 9).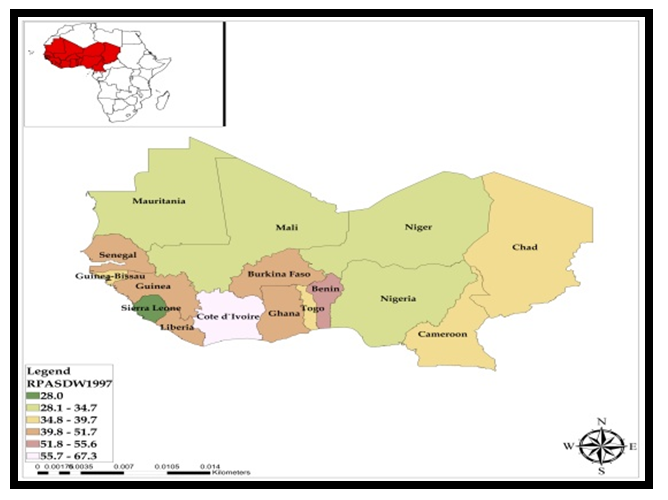 | Figure 9. Rural Population Access to Safe Drinking, Water 1997 |
In 2007, the spatial distribution patterns of total population access to clean water appears to reflect the previous period with the prime spots in space. It is exemplified by high indices (69.9-72.8% to 72.9-79.8%) denoted in dark and mild red evident in Cote d’Ivoire, Ghana, Senegal, Burkina Faso, and Benin mostly in the lower south zone. The second group of nations in mild orange colors under the overall water access scales of 58.0-64.3-64.4 - 69.8% embody neighboring southwest states of Guinea Bissau, Guinea, Liberia, and Cameroun followed by a network of other spots in yellow headlined by a trio of lower South nations of Sierra Leone, Togo, Nigeria, and the quartet of others (Mauritania, Mali, Niger, and Chad) in the upper North in group 3. In these places, see that the water availability percentages consist of 48.2-50.8% to 50.9-57.9% (Figure 10). 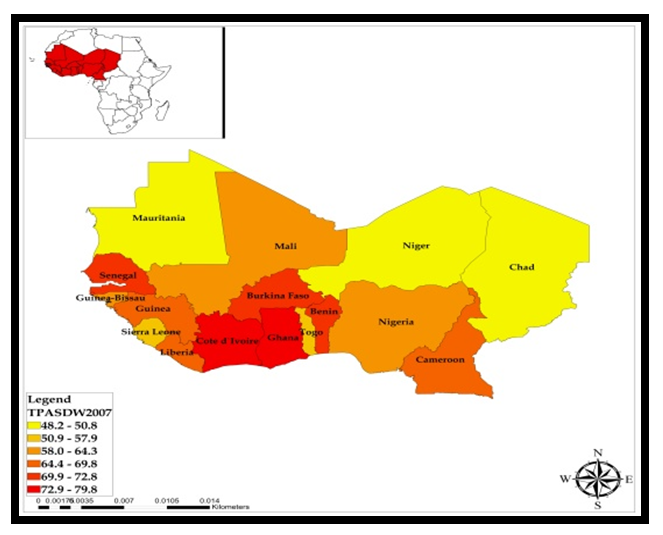 | Figure 10. Total Population Access to Safe Drinking Water, 2007 |
The map on total population with clean drinking water access in 1997 pinpointed the presence of the initial availability in elevated index of 60.7-66.2% to 66.3-77.3%. This pattern hovered consistently around the core nations in the center like Cote d’Ivoire, Ghana, Benin, together with Senegal and Cameroon. In the couple of places in the study area where the overall clean water availability flourished in the medium order of 48.4-54.3 to 54.4-60.6%. The countries of Guinea, Liberia, Burkina Faso, Liberia, and Togo held firm in the rankings. This was closely followed by those nations represented in the lower clean water access ratios of 38.2-40.7 to 40.8-48.3%. These includes a combination of upper Desert ecozone states of Mauritania, Mali, Niger, and Chad as well as Lower south nations of Sierra Leone and Nigeria where access levels stayed below the 50%-mark (Figure 11).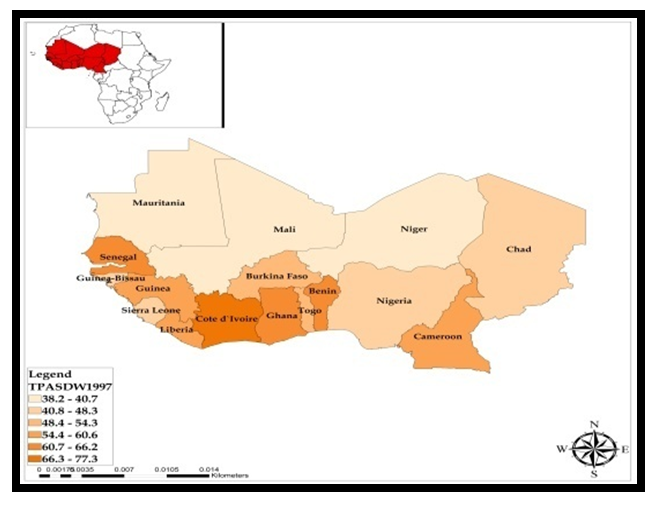 | Figure 11. Total Population Access to Safe Drinking Water, 1997 |
Considering the attributes of the Southwest as a rain belt it came as no surprise that Sierra Leone and Liberia, Guinea and the Guinea Bissau axis showed their capacities. This is buttressed by the progression of climatic parameters of long-term average annual precipitation, and national rainfall index all through 1977-2017, 1983-1987 to 1993-1997 (Figure 12-Figure 14). Elsewhere, the sectoral water transfers for industry and municipal areas shows the prominence of Sierra Leone, Libera, Cote Ivoire, Guinea, and a couple of other nations between 2000-2002. However, the trends in the agricultural sector, indicates that Mauritania and Senegal did dominate as the leading nations in farm water withdrawals from 2008-2012 (Figure 15-17). On the agricultural land use side, note that the cultivated spaces of both Nigeria and Benin heavily dependent on water, surpassed the entire nations in the zone in that category from 2008-2012 (Figure 18).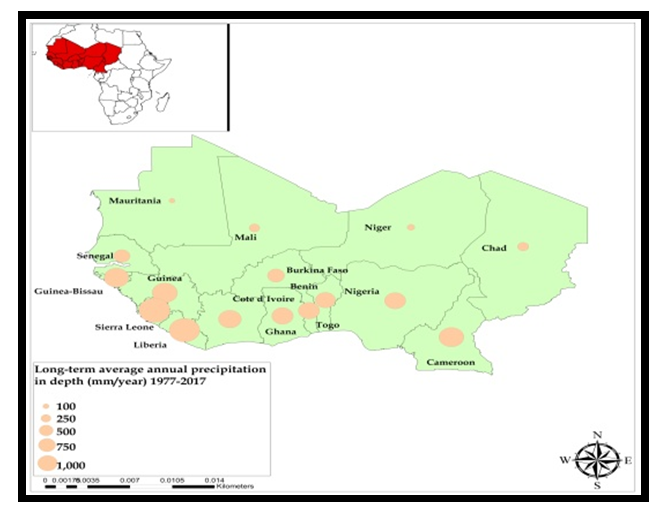 | Figure 12. Long term Average Annual Rainfall, 1977-2017 |
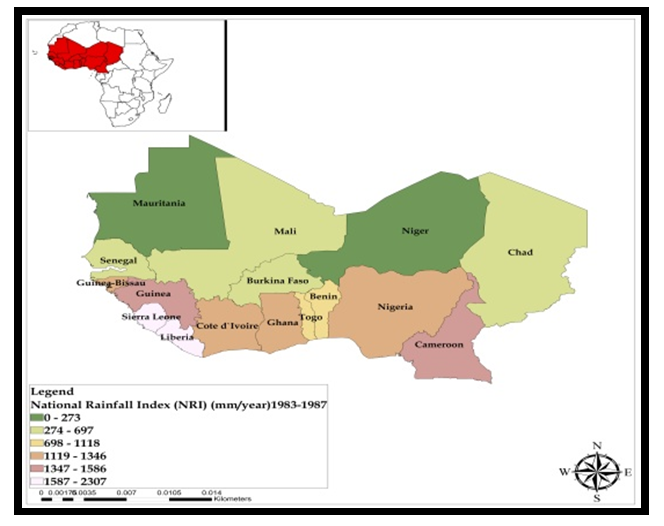 | Figure 13. National Rainfall Index, 1997 |
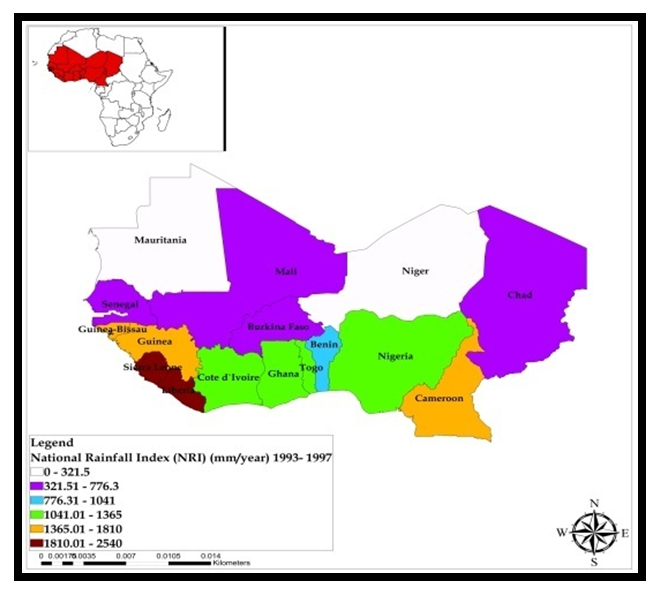 | Figure 14. National Rainfall Index, 1993-1997 |
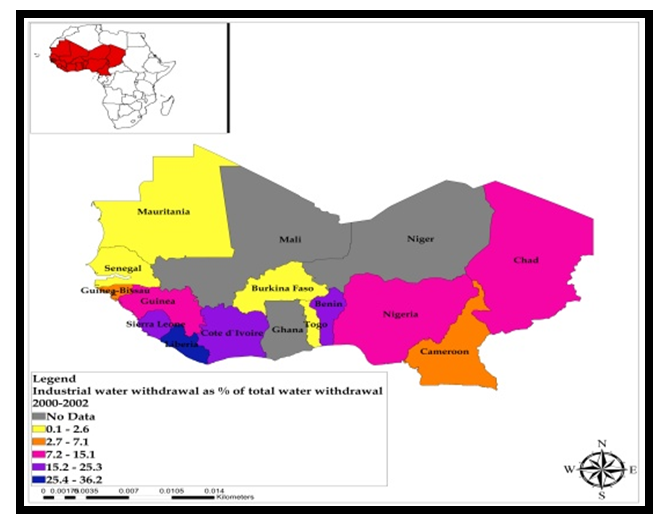 | Figure 15. Industrial Water Withdrawal, 2000-2002 |
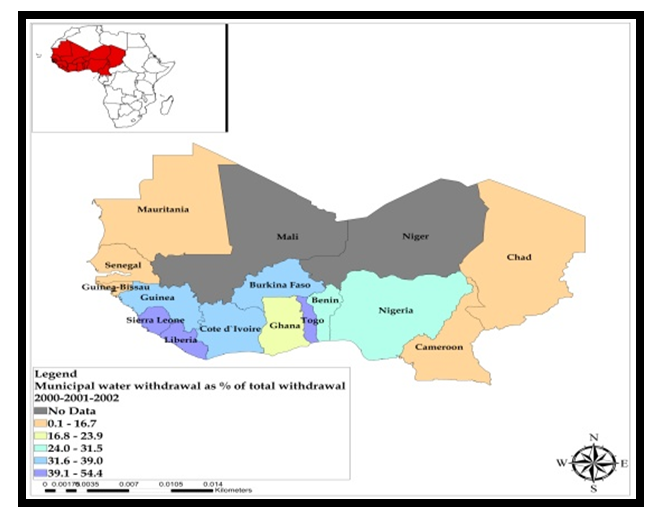 | Figure 16. Municipal Water Withdrawal, 2000-2002 |
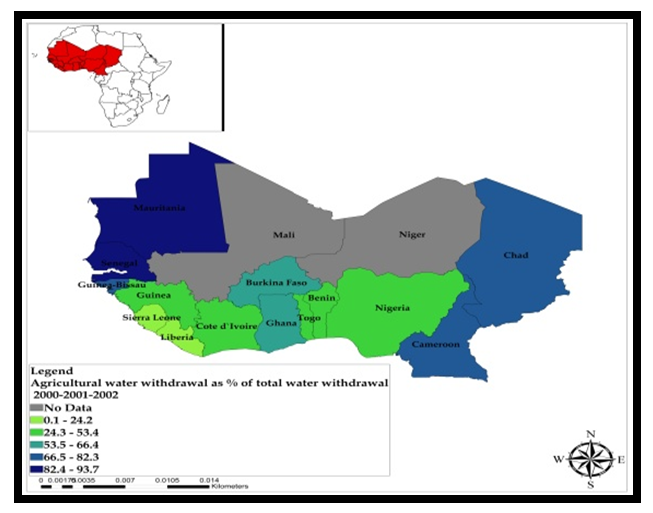 | Figure 17. Agricultural Water Withdrawal, 2000-2002 |
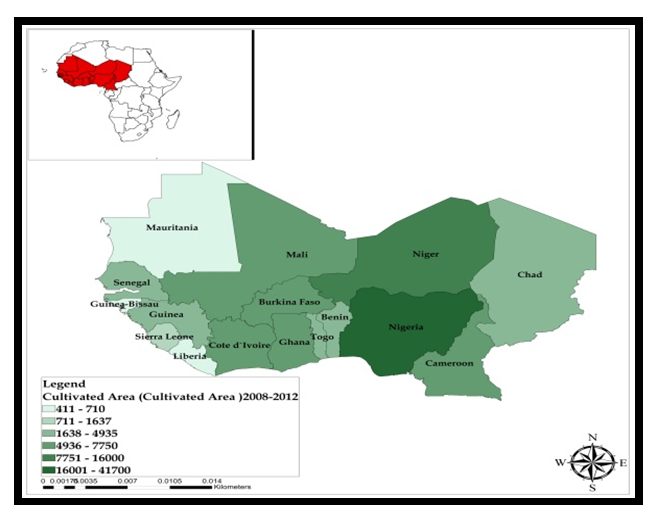 | Figure 18. Cultivated Land Area, 2008-2012 |
3.4. Factors Influencing Water Resources Use
The key factors shaping the rising use of water resources in terms of quantity, volumes, potentials and deficits, risks, availability, and anticipated consumption trends in West Africa did not occur in a void. They are associated with different policy, socio-economic, and physical and environmental factors. These elements are described below one after the other.
3.4.1. Socio-Economic and Policy Elements
In the context of water issues in the study area, several socio-economic elements in the form of economy, demography and policy seems to influence the usage. Being a place where poverty constitutes a vital factor shaping water access. The burden limits awareness, information, and scientific expertise needed in the mitigation of water crises. Saddled with the existence of subpar amenities to sustain water supply for domestic and industrial use. The pollution of rivers, and lakes, and the water bodies in metro centers creates serious health effects. This situation remains compounded by issues associated with the demands of many transboundary River basins where disputes in water sharing formular are recurrent among the nations. Added to that, are unsustainable policies, lack of hydrological data, and limited capacity from inadequate training and rising population. The manifestation of rural-urban divide in the delivery of water plans is also a sign of the policy bias. This system favors greater access and more potable water to citizens in metro areas than the countryside in most countries of the region. Within the metro area, the delivery of water surged by 66%-77% from 1980 to 1990, while rural areas saw upticks of barley 22%-26%. Although there are still places where affluent rural communities enjoy up to date water supply amenities. But most metro water facilities are reasonably well managed and equipped since policy makers residing therein often prioritize their water infrastructure needs prior to focusing on rural entities. Such disparity is very evident in overcrowded metro areas and the largely forgotten rural spaces.
3.4.2. Land Use Forces
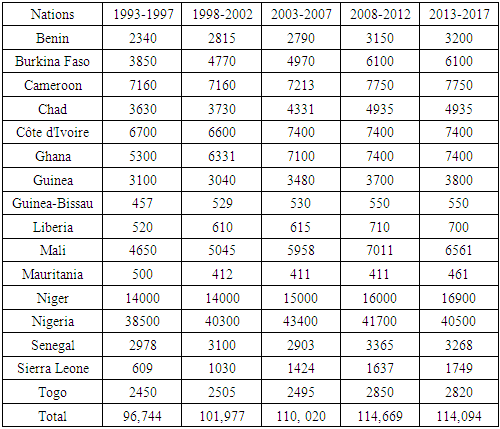
When it comes to cultivated land areas consistent with water use over the years. The tabular display of the distribution shows the study area held 96,744-101,977 hectares of land between 1993 to 2002. This was followed by recurrent fluctuations of 110,020 hectares, 114,669 hectares 114,094 all through 2003 to 2017. Among the nations, the averages for Nigeria and Niger at 40,492-15,542 hectares over the years, represents the highest levels among the 16 nations in the region. During the separate periods, except for 1993-1997 when Nigeria’s total cultivated area stood at about 38,500 hectares, by the ensuing periods of 1998-2017, the nation’s tilled land area reached the 400,000 mark as much of the numbers for Niger went from just 14,000-15,000 to 16,000 plus. Of the third-tier group of nations (Cameroon, Ivory Coast and Ghana posted slightly identical average values of 7,504, 7,185 to 6,861 hectares in farmland from 1993 through 2017. Along those lines, the cultivated land in another group of lower south states most notably Guinea-Bissau, Liberia and Mauritania finished in the lower levels of hundreds of hectares (523, 631 and 539) at a combined average of 531. Putting vast swaths of farmlands of these magnitude into operation remains a big drag on the ecology and hydrology of region with a history of deadly spells of famine and drought especially, with Sahel hot spot in Niger ranked as the second largest nation with more land devoted to farming (Table 11).Table 11. Cultivated Area In West Africa, 1993-2017
 |
| |
|
3.4.3. Physical Environment
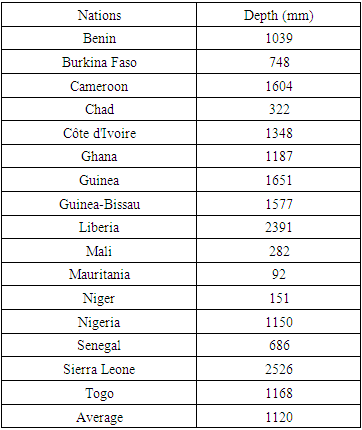
Looking at the ecological history over the last 40 years in west Africa, the study area is not a stranger to the wide range of physical factors shaping water access. In a zone where the interactions between changing climate and hydrology are problematic. West African has seen a strong drop in rainfall and lower tide levels in most waterways. From the frequency of such risks and uncertainty. This same pause in the rainfall pattern surfaced in the periods 1968-1972 as the situation in 1970 coincides with an era in which the drop in average rainfall fell from 15% to 30%. Because unreliable rainfalls and large deficiencies in water resources planning knowledge mars usage. The Sahelian sub region faces some of the worst conditions like extreme aridity. Under water surplus side, the region has vast network of transboundary waters where the conditions of the three largest river basins (the Niger, the Lake Chad, and the Senegal) shapes access. Moreover, the depth of long-term average annual precipitation from 1977 to 2017 reveals a regional mean value of 1120 mm with a huge difference among the coastal nations and the Sahel states. Seeing the relative variability in the intensity of rainfall in the past four decades, the Atlantic nations of Sierra Leone and Liberia and the Gulf of Guinea side saw the highest precipitation levels of 2526-2391 mm all those years. This again affirms the level of water stress in the upper part of the west African region compared to the lower Atlantic where the individual national average surpasses the regional levels all through 1977- 2017 (Table 12).Table 12. Long-term average annual precipitation in depth (mm/year) 1977-2017
 |
| |
|
3.5. Efforts and Initiatives
Seeing the large-scale use of water from various sources and the high sectoral consumption levels and demands that occurred over time to drive the economy. The recent environmental and fiscal benefits of water security and policy changes towards conservation, protection and regional safe water access created the quest for more initiatives. Consequently, measures are being taken by states, multilateral, international agencies, and other actors in the water sector to improve quality, access, and the eradication of some of the known risks fuelling water insecurity.
3.5.1. Multilateral and Regional Efforts
In the West Africa region, international and regional entities are not really sitting on the lines but are involved in many projects to ensure continual access to water. For that, the United States government, under the auspices of the Agency for International Development (USAID) has contributed to river basin development by financing technological oriented programs focused on water resources management. In the same area, The UNDP and multilateral donor nations like France, West Germany, the Netherlands, and the United States, remain poised in aiding African multinational water resources development agencies on lakes and river basins for 4 decades ago. With over 300 schemes pitched toward implementation under the vision type portions of the Operating Plan 2016-2024 of the Niger Basin Authority (NBA). The projects contain a plethora of ventures: infrastructure design, large dams; irrigation gear and steering pathways for socioeconomic growth. There is also the protection of the basin’s environments, like the Interior Niger Delta; and involvements aimed at managing the common natural capitals in the watershed. Convinced about the inadequacies in management. The USAID West Africa (WA) Mission’s WASH actions focused on rural parts of Benin, Côte d’Ivoire, Burkina Faso, Ghana, Niger, Sierra Leone, Guinea, and Liberia where water distribution and public health facilities are ineffective.
4. Discussion
The enquiry stressed the growing incidence of water issues, the pace of usage and cases of shortfalls, coupled with the worries over quality and unequal allotment. One significant thing that emerged in the assessment, involves the present links between water usage, water security, and socio-economic and physical factors. Drawing from the results, the state of water use, and the issue in the West African zone reflects a mix of availability, richness, and depletion risks amidst the vulnerability to climate change. Stretching from the Atlantic to the Northern Desert ecozone with shorelines of major rivers rich in biodiversity, alongside vast arable land spread across and surrounded by lakes to meet potable needs. In West Africa, H2O has a vital role in the daily lives of communities. With the zone endowed with H2O in at least 22 basins, it still suffers from frequent shortfalls due to uneven rainfall and overflows, poor usage, and bad management practices. Accordingly, the pace of disparity in the distribution continues to fuel water insecurity and hydrological stress along the Sahel portion. This contrasts deeply with water abundance in the coastal lower South of the region. Given that current policy negated continual access in the zone over the years, H2O use across sectorial levels with allotment to the leading user agriculture, industry and households saw variations.To locate the extent of water allocation, and trends in the sectors. The enquiry used mixscale tools of descriptive statistics and GIS with data involving variety of socio-economic and ecological and hydrological variables from ground and surface water sources, overall renewable H2O resources, to per capita H2O resources. Of great importance in the analysis is how the overall renewable H2O resources held firm in a quartet of coastal states (Nigeria and Cameroon, Guinea, and Liberia) ranked above others from 1977-2017. In the context of per capita water use, the West African region posted visible changes that were mostly declines. All in all, the study area saw overall decline at a rate of nearly 60% from 1977-2012 as 4 nations Liberia and Mali, Nigeria and Sierra Leone averaged 57% in losses. This is a wake-up call for users that are unaware of the gravity of the deficits in the study area.Seeing that the GIS analysis of the patterns among other things provided insights into the spatial dispersion of water use trends, the distribution over time, and the rainfall index. The paper shows that the scope of H2O use does not operate in a vacuum. This is due to a host of socio-economic and physical elements located in the larger hydrology and ecosystem of the region. While part of it centers on the rapid growth in population and urban development, climate change and ineffective policies and land use. The results point to changes in usage among sectors in the form of gains and declines, big gap between rural and urban dwellers in the proportion of water access with cities far ahead. The GIS mapping also pinpointed spatial dispersion of the trends across nations, the risks of pollution (potable H2O deprivation) and climatic stress. With these changes tied to many factors, the paper offered solutions ranging from education and monitoring to the enactment of sound policies.
5. Conclusions
The study assessed the state of water resources use and the common challenges with valuable findings highlighted under the ensuing headings: a) mix-scale technique efficient; b) changes caused by many factors; c) water deficit evident; d) consumption on the rise; e) impacts of the crisis apparent.In highlighting the challenges of water resource use in West Africa from 1977 and 2017, mix-scale approach showed various dimensions not fully utilized in the past by planners. The uses of descriptive statistics in the model, presented sparks of innovation in the capacity of the technique to pinpoint the intensity of use in nations faced with a combination of surpluses and deficits together with the risks of water stress. Equally, the complete spatial analytics built on GIS was extremely effective in mapping the evolving patterns of most indices ranging from climate change parameters in the form of annual rainfall precipitation instrumental in predicting scarcities and emergencies coupled with temporal shifts in total renewable water, in terms of the depths, the per capita, percentages of change and the others. In that way, planners have the capacity to craft efficient plans for tackling any eventualities. With these scenarios today handy, scholars, practitioners and water resource consumers have at their disposal, information on the prospects and dangers to the hydrological assets as a model for sustainable use in the places prone to recurrent stress.The important factors shaping water use in West Africa in the enquiry stems from socio-economic and ecological elements rooted in inefficient policy, growing population, irregular precipitation, and climate change risks. In the process, many of these elements influenced the common allocation formats pertaining to access. For that, under policy, note that the deep-rooted bias in the design of modern water infrastructure, works against most poverty-stricken areas in the high-density urban localities and rural areas, in favour of affluent communities. With such disparity in a setting already burdened by water scarcity driven by rising population and exorbitant water tariffs, obsolete amenities, and contamination risks. The land use aspect of the policy ensures the cultivation of vast swaths of land heavily dependent on water diversion in a scarcity riddled region. Since huge gap in water management expertise hinders usage, the nations in the Sahelian zone still face the harshest situations such as extreme dryness known to limit water flow. While the region’s propensity to climate change risks accentuates stress. By recognizing these indices, the study injected the much-needed understanding of those forces vital for monitoring stressors threatening water security in the study area. Seeing the string of water crises in 2001, the trends, and the changes through transfers, and the risks of water scarcities. The concerns over such shortages as indicated by the loss of drainage networks and the falling levels at key rivers, extends to the Sahel zones known for the acute shortages of rainfall. Since this involves changes in water assets involving growing groundwater demands, the situation in many aquifers and renewable water resources in West Africa created conditions for the mounting deficits. In the process, as the anticipated warming of the atmosphere and shifts in rainfall takes shape. The spill overs would limit aquifer recharge while driving up water use amidst drought and stress in the region. From the scale of such pressures, the drops in the volume of per capita water resources by 1977-2012 offers some clues for West Africa. Aside from the declines as witnessed across the board, the study area saw overall drops at a rate of -59.03% by 1977-2012. From the enquiry, there is no denying the fact that, the region’s unstable ecosystem is at risk given the deficits in water use. In showcasing such patterns in H2O shortfalls, the study offers a template for the nations to draw from, as they embark on crafting effective plans for addressing water issues.Basically, in a zone besieged by unprecedented development and changes over time. The distribution of ground and surface water to serve sectoral needs, accelerated the surge in extraction. With these occurrences clear at the regional, national, and municipal scale. The largest users comprising of agriculture, municipalities and industry took out more H2O from 1980-2006 estimated at the highest percentage levels. From the water use levels in the zone over a period of 2 decades. The study showed how the region not only guzzled more water, however the intensity of usage in the farm sector, puts the upper Sahelian part on top of the ranking. Elsewhere, in the Lower Atlantic axis, water allotments to municipalities jumped to higher levels in a quartet of nations (Togo, Liberia, Cameroon, Sierra Leone). Crafting water index of this scale in the study as analytic device, increases the readiness of planners to track usage across time by keeping regional stakeholders aware of the eventual surpluses and likely shifts, should sudden crises creep in. Drawing from the outcome of this research, the study recognised the extent to which water usage in West Africa precipitated impacts. This includes declines, socio-economic-policy questions, and ecosystem uncertainty. With the vast network of water assets in the region, the consumption in the nations was so much that sectors like agriculture and residential/urban areas used up more. In that light, the growing search for scarce water resources accelerated deficits, the occurrence of disparate allocations and the exposures of the urban-rural divide pertaining access to potable water. With the zone saddled by projected temperature rise over the coming three decades and the scale expected to shift. In such scenarios, the frequency of irregular rainfall patterns coincides with the surge in severe climatic disasters. Accordingly, most expanding shorelines and violent rainstorms, linked to changing climate will threaten the populace, the quality of water and the ecosystem in low lying communities of the zone. Revealing such dangers in lieu of the scope of water stressors and the deficits, and the inherent environmental hazards in the paper, remains highly crucial towards the attainment of water security. Considering the utilization volumes in surface and ground water sources in the past years, and the alarms raised by the shortfalls in common water resources as indicated in this enquiry. Planners and researchers will be required to elicit crucial answers to several queries that are essential to water security. The questions are as follows: How would future consumption levels shape water security? What are the regional implications of transboundary water problems? How will climate change affect water security? How will the current growth levels in sectoral allocations in the municipal, industrial, agricultural influence access? How will the nations address the growing threats of water scarcity? Based on these queries, ample possibilities exist for rigorous enquiry and practice to strengthen the focus on sustainable regional water use.
References
| [1] | Cooperation in International Waters in Africa (CIWA). (2020). Water Issues In Africa. Retrieved September 20th, 2020, From http//www.worldbank.org. |
| [2] | The United Nations. (2016). World Water Development Report 2016: Water and Jobs. Paris, FR: UNESCO |
| [3] | USAID. (2013). Climate Change and Water Resources In West Africa Transboundary Basins. Washington, DC: USAID. |
| [4] | McClain, Michael. (2013 September). Balancing Water Resources Development and Environmental Sustainability in Africa: A Review of Recent Research Findings and Applications. Ambio. 42:5:549–565. |
| [5] | International Union for Conservation of Nature. (2008). The West Africa Water Resources Policy. Ouagadougou, Burkina Faso: WAWRP, IUCN. Central and West Africa Programme. |
| [6] | USAID. (2015 February). An Introduction to The ARCC Adaptation In the Sahel Series. Washington, DC: The USAID. |
| [7] | USAID. (2014). Transboundary River Basins in West Africa; Climate Change, Washington, DC: The USAID. |
| [8] | CIFOR. (2005). Natural Resources, Communities and Climate Change in West Africa: Impacts, Vulnerabilities and Responses. Ouagadougou, Burkina Faso: Center for International Forestry Research. |
| [9] | The International Development Research Centre. Water Imbalance and Insecurity. (2009). Ottawa, ON Canada: The IDRC. |
| [10] | Nwamaka, Chigozie Odili, (2018 January). Shared Water Resources In West Africa; Relevance and Application of the UN Watercourses and the UNECE Water Conventions. Brill Research Perspectives in International Water Law 3:1: 1–98. |
| [11] | Lekan, Oyebande. (2009 Dec). Water Problems In Africa — How Can The Sciences Help?, Hydrological Sciences Journal, 46:6, 947-962. |
| [12] | Oyebande, L. (1990) Drought policy and drought planning in Africa. Int. J. Wat. Resour. Devel. 6:4: 260-269. |
| [13] | Walsh, Bryan (2013). See The World’s 10 Most Polluted Places (and Learn How They Got That way. Time. ISSN 0040-781X. Retrieved 2020-11-26. |
| [14] | Ndehedehe, Christopher E. (2019 January). The Water Resources of Tropical West Africa: Problems, Progress, and Prospects. JActa Geophysica. |
| [15] | Marlene, Elias. (2018). Searching For Pathways Towards Equitable and Sustainable Reservoir Management. Rome, Italy: Biodiversity International. |
| [16] | Panda. The Facts On Water In Africa. Retrieved September 20th, 2020 From https://wwfeu.awsassets.panda.org/downloads/waterinafricaeng.pdf. |
| [17] | Gould, S. Michael. (1989 November). An Overview of Water Resources Planning In West Africa. World Development 17: 11: 1717-1722. |
| [18] | Gachanja, Anthony. (2010). Africa's Water Quality: A Chemical Science Perspective. London, UK: Pan Africa Chemistry Network, Royal Society of Chemistry. p. 8. |
| [19] | Merem, E. C. (2006). Hydropolitics: Case of the Niger River Basin. GIS Development: Africa. 24-28. |
| [20] | Rutten, Marcel. (2012 March). Water In Africa. Leiden, Holland: University of Leiden, The Library of the African Studies Centre. |
| [21] | Debevec, Liza. (2017). Local People Hold The Key To Solving Burkina Faso’s Water Challenges. Accra. Ghana: International Water Management Institute and CIGAR Research Program on Water, Land and Ecosystems (WLE) |
| [22] | Ringler, Claudia. (2018 June). Achieving The Niger Basin Shared Vision by Drawing on Its Cross-sectoral Strength. Accra. Ghana: International Water Management Institute and CIGAR Research Program on Water, Land and Ecosystems (WLE). |
| [23] | USAID. (2019). Global Waters: West Africa Regional. Washington, DC: USAID. Retrieved September 20th, 2020, From https://www.globalwaters.org/WhereWeWork/Africa/west-africa-regional. |
| [24] | ECOWAS. (2006). Transboundary River Basin: The Atlas of Regional Integration. Abuja, Federal Capital Territory, Nigeria: ECOWAS Secretariat. |
| [25] | Merem, E.C. (2017). Analyzing Water Management Issues Using GIS: The Case of Nigeria. Geosciences. 7:1: 20-46. |
| [26] | Russell, Nathan. (2017). Land Water Solutions Mediation of Longstanding Conflicts In Volta Basin. Accra. Ghana: International Water Management Institute and CIGAR Research Program on Water, Land and Ecosystems (WLE). |
| [27] | Pare, Samuel. (2013 July). Understanding Freshwater Quality Problems In a Changing World IAHS Publ. 361, 2013 Proceedings of H04, IAHS-IAPSO-IASPEI Assembly, Gothenburg: Sweden. July 2013. |
| [28] | Marcel, Rutten (2012 March). Web Dossier on Water in Africa. Leiden, Holland: University of Leiden, The Library of the African Studies Centre. |
| [29] | United Nations Economic Commission For Africa (ECA). (2000). The Africa Water Vision for 2025: Equitable and Sustainable Use of Water for Socioeconomic Development. Addis Ababa, Ethiopia: UNECA. |
| [30] | Naga, Coulubaily. (2018). The Impact of Climate Change on Water Resource Availability In a Trans-Boundary Basin in West Africa: The Case of Sassandra. Hydrology. 5:1:12. |
| [31] | Augusto, Getirana. (2020). University of Maryland, College Park West Africa Ldas For Forecasting Extreme Hydrological Events (walfehe) Retrieved September 20th, 2020, From https://www.oecd.org/swac/publications/38409569.pdf. |
| [32] | Merem, E. C. (2014). Analyzing Water Issues In The State of Mississippi. British Journal of Applied Science & Technology. 4:2: 3179-3216. |
| [33] | Water Resources West Africa. (2019 May). The New “ITTAS” Launching of the Project That Aims at "Improving IWRM, Knowledge-Based Management and Governance of The Niger Basin and the Iullemeden-Taoudéni / Tanezrouft Aquifer System. Niamey, Niger: May 20 to 22, 2019. |
| [34] | World Bank. (2013 March). Collective Water Management in Western Africa. DC: Washington, The World Bank. |
| [35] | Merem, E. C. (2018, February). Analyzing the Tragedy of Illegal Fishing By Foreign Vessels On The West African Coastal Region. Proceedings of The 26th Joint Conference of National Association of African American Studies (NAAAS). Dalla: TX. February 2018. |
| [36] | Merem, E. C. (2019). Regional Assessment of the Food Security Situation in West Africa with GIS. Food and Public Health. 9:2: 60-77. |
| [37] | Merem, E. C. (2019). Analyzing the Tragedy of Illegal Fishing on the West African Coastal Region. International Journal of Food Science and Nutrition Engineering. 9:1: 1-15. |
| [38] | Merem, E. C. (2017). Regional Assessment of Energy Trends In West Africa using GIS. International Journal of Energy Engineering. 7:1: 1-27. |
| [39] | Merem, E. C. and Twumasi, Y. A. (2008). Geospatial Information Systems Analysis of Regional Environmental Change Along The Savannah River Basin of Georgia. International Journal of Environmental Research and Public Health. 5:1: 281-294. |
| [40] | Merem, E. C. and Twumasi, Y. A. (2006). GIS and Remote Sensing Applications In The Assessment of Change Within a Coastal Environment In The Niger Delta Region of Nigeria. International Journal of Environmental Health and Public Health. 3:1:98-106. |
| [41] | Merem, E. C. (2020). Exploring Cocoa Farm Landuse Trends in The West African Region. International Journal of Agriculture and Forestry. 10:1:19-39. |
| [42] | Merem, E. C. (2017). Assessing The Ecological Effects of Mining In West Africa: The Case of Nigeria. International Journal of Mining Engineering and Mineral Processing. 6:1: 1-19. |
| [43] | Merem, E. C. (2021). The Assessment of China’s Scramble for Natural Resources Extraction in Africa, World Environment. 11:1: 9-25. |
| [44] | Merem, E. C. (2021). Analyzing the Environmental Risks from Electronic Waste Dumping In The West African Region, Journal of Health Science. 11:1:1-16. |
| [45] | Merem, E. C. (2021 April). Appraising Issues In Water Resources Use Among Nations In The West African Region. Proceeding of 12th National Monitoring Virtual Conference. Providence: Rhode Island. April 19, 2021. |
| [46] | Merem, E.C. (2018). Appraising Variations In Climate Change Parameters Along The Lower West African Region. Journal of Safety Engineering. 7:1:1-19. |
| [47] | Merem, E. C. (2007). Using GIS and Remote Sensing In the Analysis of Ecosystem Decline Along The River Niger Basin: The Case of Mali and Niger. International Journal of Environmental Health and Public Health. 4:2: 278-289. |
| [48] | Merem, E. C. (2008). Using Spatial Information Technologies As Monitoring Devices In International Watershed Conservation Along The Senegal River basin of West Africa. International Journal of Environmental Research and Public Health. 5:5: 464-476. |
| [49] | Merem, E.C. (2012). Visualization of the rangeland resources from space: A case of Sahel region, West Africa. International Journal of Geomatics and Geosciences. 3:1: 259-267. |
| [50] | Busari, Toyin Isiaka (2020). Water Resource Management: IWRM strategies for Improved Water Management. A Systematic Review of Case Studies of East, West and Southern Africa View. ORCID. Retrieved September 20th, 2020, From http doi: https://doi.org/10.1101/2020.07.17.208413II). |
| [51] | Mouhamadou, Bamba. (2018 September). Climate Change To Severely Impact West African Basin Scale Irrigation In 2 °C and 1.5 °C Global Warming Scenarios. Published Scientific Reports. 8:14395. |
| [52] | Merem, E. C. (2017). Assessing Ecosystem Liabilities of Oil and Gas Activities In Southern Nigeria. Public Health Research. 7:1: 3-26. |

 Abstract
 Reference
 Full-Text PDF
 Full-text HTML