-
Paper Information
- Paper Submission
-
Journal Information
- About This Journal
- Editorial Board
- Current Issue
- Archive
- Author Guidelines
- Contact Us
International Journal of Ecosystem
p-ISSN: 2165-8889 e-ISSN: 2165-8919
2021; 11(1): 8-16
doi:10.5923/j.ije.20211101.02
Received: Apr. 1, 2021; Accepted: May 17, 2021; Published: May 28, 2021

Wetland Degradation Status and Conservation Challenges in Murang’a County, Kenya
 Abstract
 Reference
 Full-Text PDF
 Full-text HTML
Benson M. Mwangi
Department of Physical and Biological Sciences, Murang’a University of Technology, Murang’a, Kenya
Correspondence to: Benson M. Mwangi, Department of Physical and Biological Sciences, Murang’a University of Technology, Murang’a, Kenya.
| Email: |  |
Copyright © 2021 The Author(s). Published by Scientific & Academic Publishing.
This work is licensed under the Creative Commons Attribution International License (CC BY).
http://creativecommons.org/licenses/by/4.0/

Unregulated human activities have resulted in massive degradation and eventual loss of wetlands despite their importance in providing various ecosystem services and habitat to important species of fauna and flora. In Murang’a County, Kenya, wetland degradation has increased at an alarming rate since the 1980s, with no data on their degradation status and challenges facing their conservation. This study aimed to examine the trend of wetland degradation and the main challenges impacting their conservation in Murang’a County between 1986 and 2018. The challenges were identified in a stakeholder workshop involving 39 key stakeholders and ranked in order of importance using the pair-wise ranking technique. Trends in wetland degradation status were assessed through analysis of land use maps obtained from Landsat images of 1986, 2001, and 2018. The most critical challenges affecting the conservation and management of wetlands in the County were inadequate legislation followed by poor planning, lack of community empowerment, scarce resources, corruption, encroachment, and pollution. Correlation analysis between wetland and water areas showed a significant but negative relationship at (P<0.01), indicating that decreasing wetland areas resulted in a significant reduction of water areas. The wetland area in the County decreased by about 48% between 2001 and 2018 and to arrest this trend of declining wetland area, the stakeholders recommended the amalgamation of all laws and policies touching on conservation and management of wetlands in the County. Further, there is a need for community involvement and empowerment to create awareness of the roles of wetlands for their well-being.
Keywords: Wetland policies, Wetland encroachment, Land-use changes, Stakeholder analysis
Cite this paper: Benson M. Mwangi, Wetland Degradation Status and Conservation Challenges in Murang’a County, Kenya, International Journal of Ecosystem, Vol. 11 No. 1, 2021, pp. 8-16. doi: 10.5923/j.ije.20211101.02.
Article Outline
1. Introduction
- Wetlands are among the most important ecosystems in the world due to their high productivity (Constanza et al., 2014; Mitsch and Gosselink 2015). Over the years, numerous goods and services have been derived from wetlands benefiting people, society, and the economy (Mitsch et al., 2015). Wetlands have been known to perform various important ecosystem processes such as decomposition, primary and secondary production, nutrient cycling, and fluxes of nutrients and energy (Millennium Ecosystem Assessment, 2005). Wetland landscapes are permanently or seasonally saturated with water, therefore exhibiting characteristics of distinct ecosystems (Keche et al., 2007). The Ramsar Convention (1971) defines wetlands as areas of marsh, fen, peatland or water, whether natural or artificial, permanent or temporary, with water that is static or flowing, fresh, brackish, including areas of marine water, depth at which low tide does not exceed six meters. Due to their valuable roles in ecosystem functioning, researchers have termed wetlands as the kidneys of the landscape (Ghermandi et al., 2008; Mitsch et al., 2015). In Kenya however, most communities do not understand the passive or indirect benefits of wetlands and often perceive them as wastelands and reservoirs for diseases causing organisms, and should therefore be drained (Muema et al., 2019). Wetlands have therefore assumed center stage in the ever-intensifying debate of environmental conservation versus resource use. Inadequate knowledge is the main driver of wetland destruction and poses an important obstacle in their restoration (Sharma and Singh, 2021). However, since the publication of the Millennium Ecosystem Assessment (MEA) in 2005, wetland conservation has hit a critical high point, with numerous researchers developing interest in these crucial ecosystems, and more so in the developing world. As a result, concerned stakeholders and decision-makers have more inferences upon which sound policies and regulations to control the use of wetlands are being based.Conservation of wetlands is necessary since they buffer impacts from floods and droughts (Sakane et al., 2011). Wetlands play a significant function in water purification, rendering it safe for human use (Rebelo et al., 2018). Wetlands are biodiversity hotspots and they provide habitats to hundreds of wildlife species (Mwangi et al., 2010). Conserving wetlands ensures that habitats to some of the most endangered species are protected (Green and Elmberg, 2014). Species such as Waterfowl and the Lesser Flamingo are birds of international importance and their existence depends on the well-being of the wetlands where they shelter, feed and breed. Carbon sequestration and storage is another major role played by wetlands which helps to regulate the global climate (Bai et al., 2019). Developing countries lack regulations to control the continuous loss and degradation of wetlands (Mitsch and Gosselink, 2015). In Africa, up to 49% of the wetlands do not have management plans (NRSCC, 2014). Inadequate data and challenges in human and institutional capacities, therefore, present an unprecedented constraint on effective management of wetlands in Africa (Dixon et al., 2016). Kenyan wetlands are managed through multi-sectoral laws and policies but their degradation continues unabated and at alarming rates (Mwita et al., 2012; Macharia et al., 2010). Conservation of wetlands in Murang’a County is vital as they are the main sources of water to neighboring towns and cities, especially the capital city, Nairobi. A paucity of data on their degradation status and challenges facing their conservation has resulted in very little effort being focused on their conservation and management. This study, therefore, focused on analyzing the trends of their degradation and the challenges facing their conservation with a view of making appropriate recommendations for reversing the degradation trends.
2. Materials and Methods
2.1. Description of the Study Area
- The study was conducted in Murang’a County, a highland area in the Central region of Kenya located within the latitudes 0° 34' S and 1° 7' S and longitudes 36° E and 37°27' E (Fig.1). Administratively, Murang’a consists of 8 sub-counties (Kigumo, Kandara, Gatanga, Maragua, Mathioya, Kangema, Kiharu, and Kahuro) and 35 administrative wards. The county lies between 914 m above sea level (asl) in the east and 3,353 m asl in the west along the slopes of the Aberdares. The total area of the County is 2558.9 km2 of which 11 km2 is water mass. About 2135 km2 is arable land and 163.3 km2 is non-arable, while 254.4 km2 is composed of gazetted forest and 20 km2 is urban area.
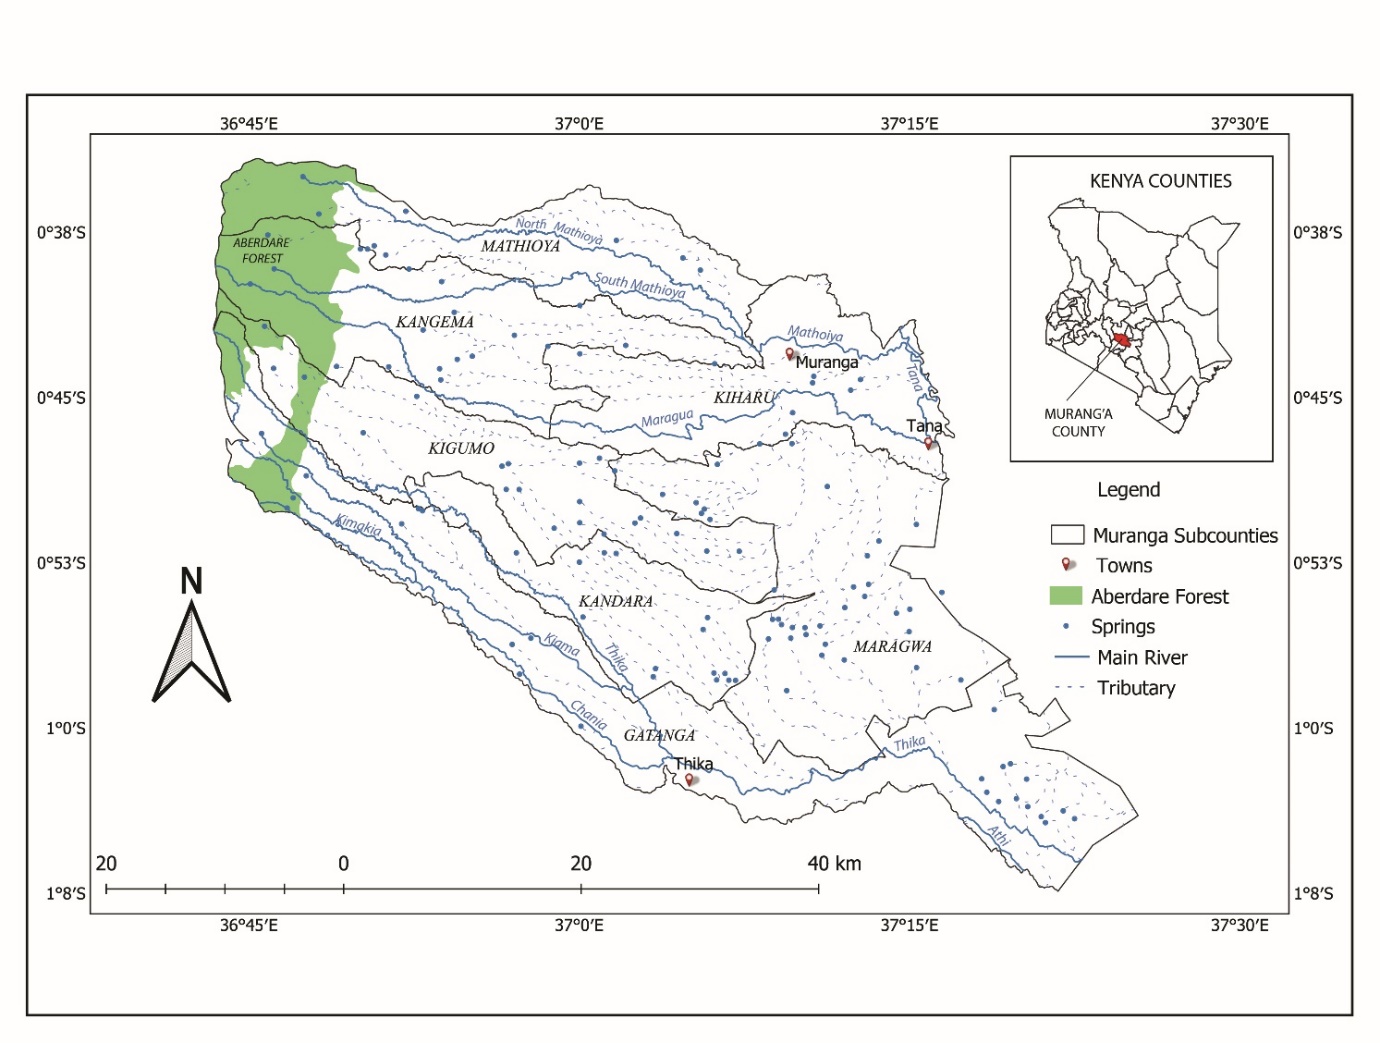 | Figure 1. Drainage map of Murang’a County showing the main rivers (Mathioya, Maragua, and Thika) and their many springs and wells that feed them arising from depressional wetlands. The main rivers arise from the Aberdare forest |
2.2. Data Collection and Analysis
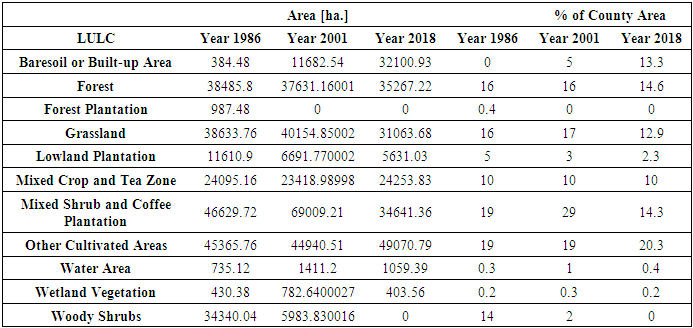
- Stakeholders are those individuals, groups, organizations, and communities involved in or affected by decisions made to conserve and manage wetland resources (Rockloff and Lockie, 2004). This study incorporated national and local government organizations, along with community groups, research institutions, and economic development organizations. A stakeholder analysis was applied as a participatory social research tool to capture the interests, attitudes, and aspirations of stakeholders in enhancing wise use (conservation and management) of wetlands. The stakeholder analysis was conducted through a meeting of 39 key stakeholders who were divided into 5 groups based on their interests. The 5 groups were the County and National Government Administration, Water providers, Environmental Groups, Fisheries, and Water Resource Users Associations (WRUAS). Each group outlined what they thought were the main challenges facing wetland conservation and management in the County and gave suggestions on causes and possible solutions to the listed challenges. Each group then presented its findings in a plenary of all the groups. All challenges presented by the groups were then listed together and classified into 7 broad challenges. The challenges were then ranked in order of importance using the pair-wise ranking technique (Thurstone, 1927).The degradation status of the wetlands through time was assessed by examining Landsat images of 1986, 2001, and 2018. Landsat 5 (TM) was used for 1986, Landsat 7 (ETM+) was used for 2001, and Landsat 8 (OLI) for 2018. From each Landsat image, the ArcGIS was used to generate a land use and land cover (LULC) map, where various land use classes were identified. Groundtruthing was conducted to relate the image data to the real features and material on the ground. Data from the land use maps were computed for area coverage of different land use classes, including wetland cover, baresoil/built-up area, and water area. To analyze trends, Pearson’s product-moment correlation coefficient was computed to compare the relationship between changes in wetland and water areas.
3. Results
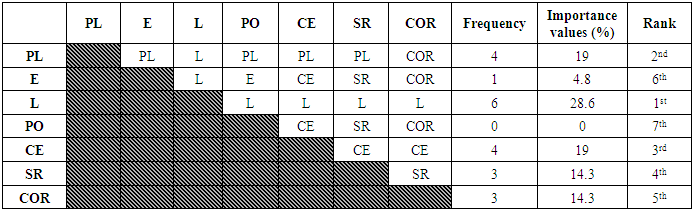
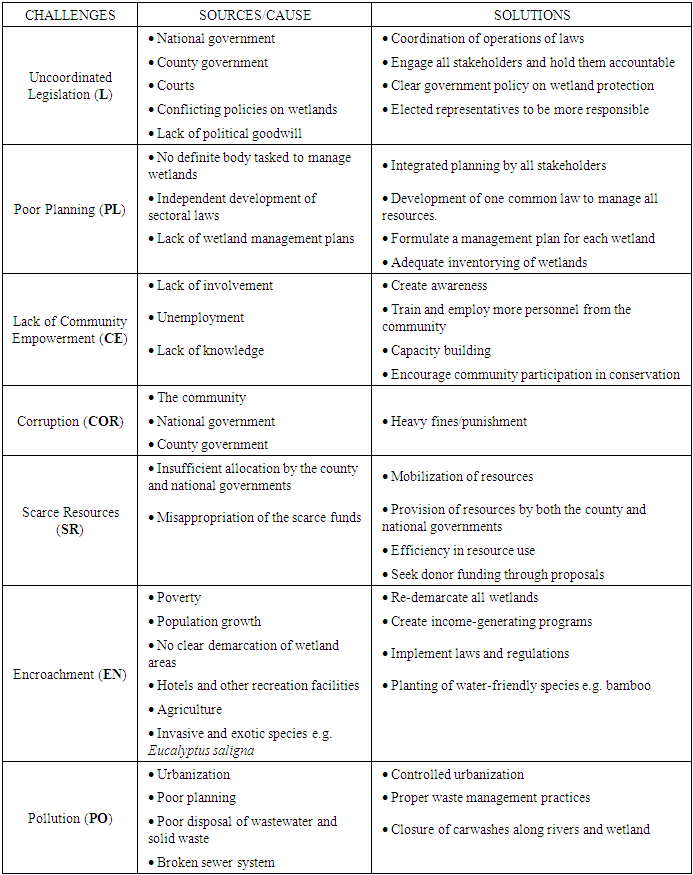
- Stakeholder analysis revealed that the main challenges impacting the conservation and management of wetlands in Murang’a County, ranked in order of importance (Table. 1) included weak and uncoordinated legislation, poor planning, and lack of community empowerment, scarce resources, corruption, community encroachment, and pollution, (Fig. 2). Conflicting policies on wetlands and lack of political goodwill are some of the causes for weak and uncoordinated legislation (Table 2). Such laws and policies include the Registered Land Act Cap 300 (revised 2010), the Environmental Management and Coordination Act (Wetlands, Riverbanks, Lakeshores, and Seashore Management Regulation, 2009), National Wetlands Conservation and Management Policy of 2013, National Environmental Policy of 2013 and the Sessional Paper No 3 of 2009 on National Land Policy. Other laws and policies touching on wetland management in Kenya include the Wildlife Conservation and Management Act of 2013, the Water Act (Cap 372) of 2012, the Agriculture Act (Cap 318) of 2012, Agriculture, Fisheries and Food Authority Act (No 13) of 2013, the National Land Commission Act (No 5) of 2012 and the Survey (Cap 299) of 2012.
|
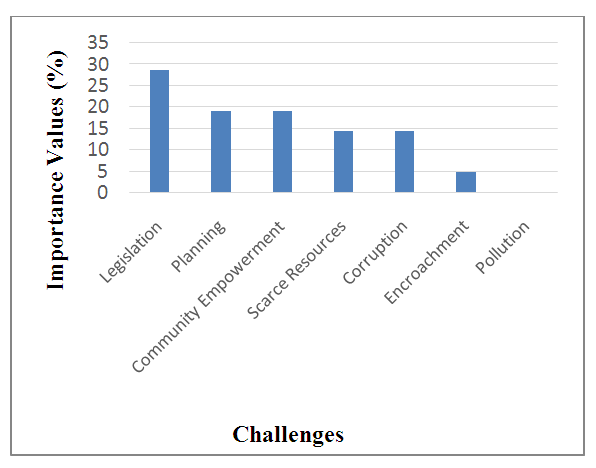 | Figure 2. Main challenges affecting the conservation and management of wetlands in Murang’a County as determined using Pair-wise Ranking Technique by key wetland stakeholders from Murang’a County, Kenya |
|
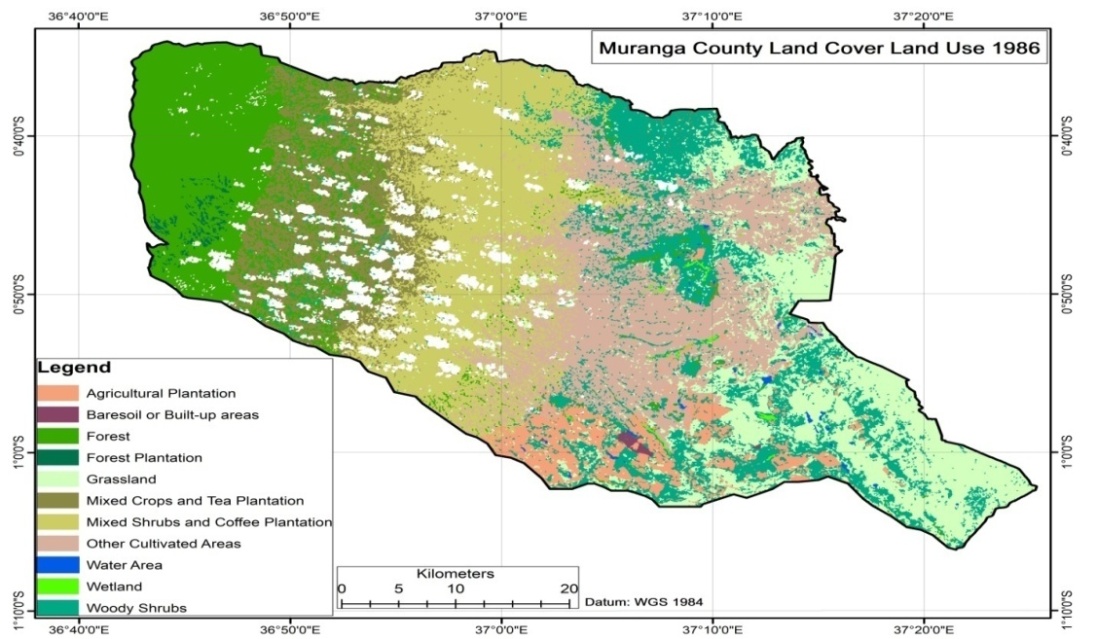 | Figure 3. Murang'a County Land Use Land Cover Map 1986 |
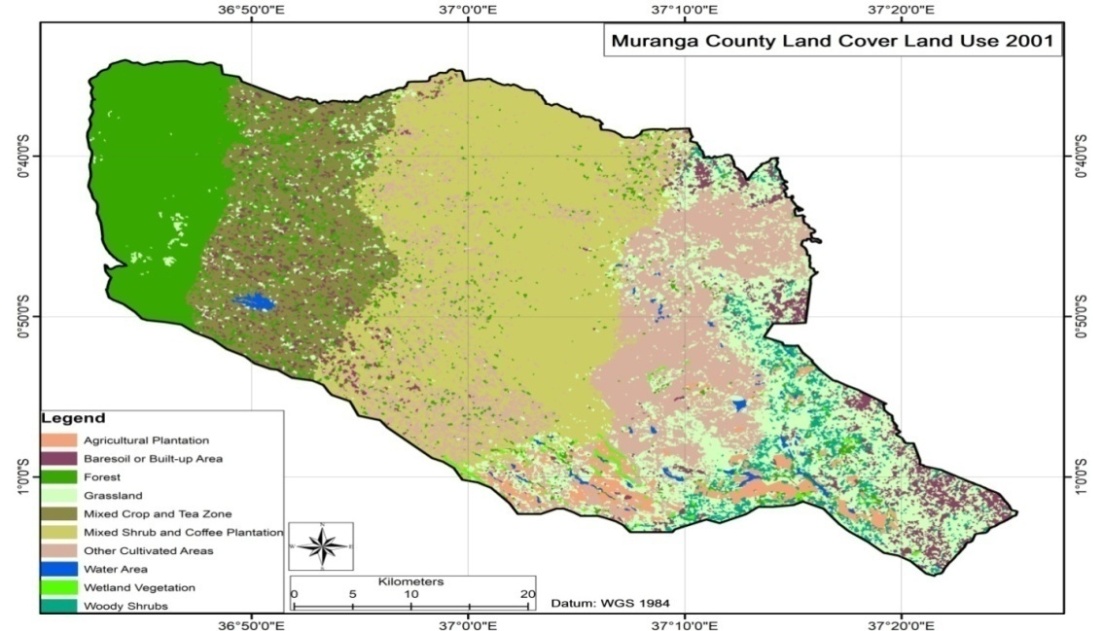 | Figure 4. Murang'a County Land Use Land Cover Map 2001 |
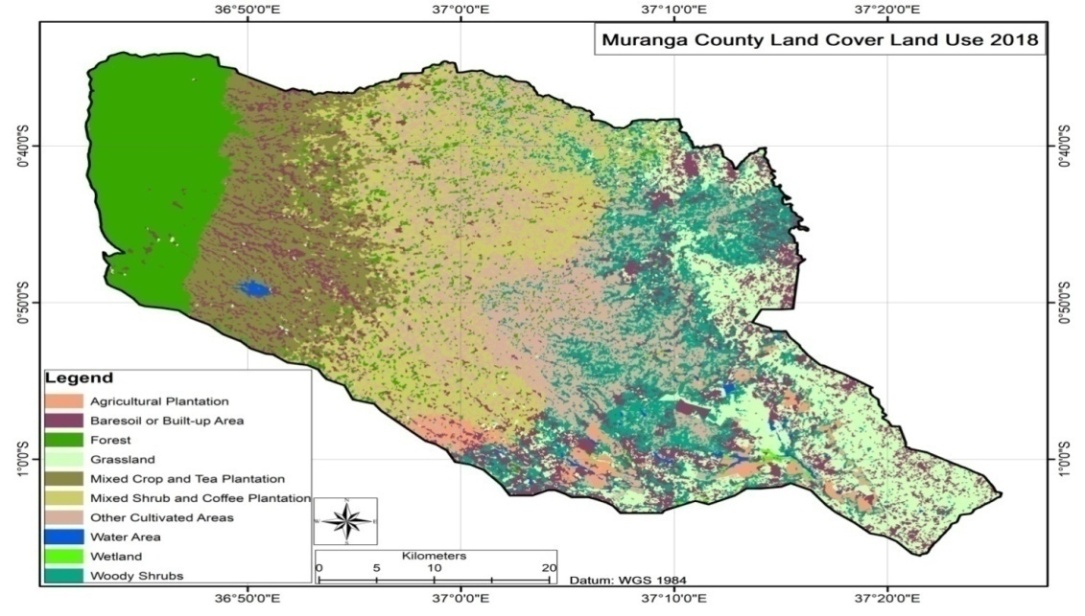 | Figure 5. Murang'a County Land Use Land Cover Map 2018 |
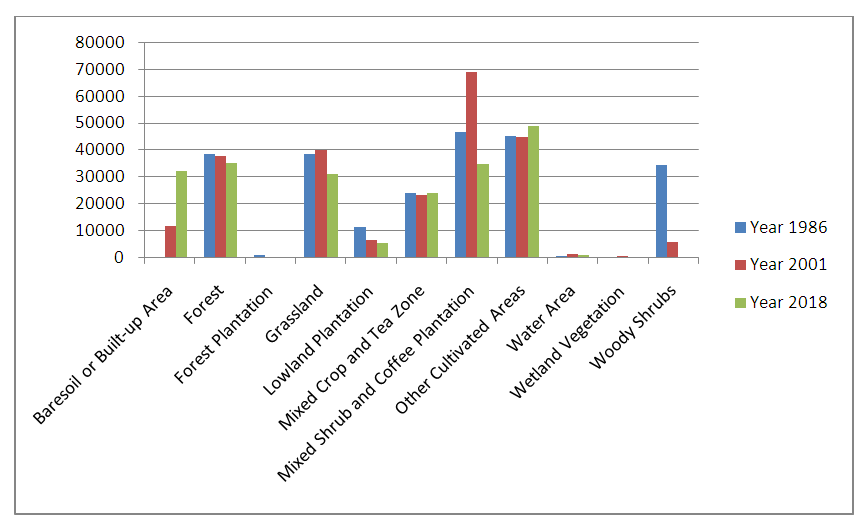 | Figure 6. A chart showing change in LULC classes from 1986 to 2018 |
4. Discussion
- Results from this study have shown that the wetland area in Murang’a County decreased by over 48% from 2001 to 2018, significantly affecting the water area in the County. This finding is in agreement with that of Davidson (2014) who reported that at least 50% of the world’s wetlands have been lost since 1900. Similarly, Muema et al. (2019), while studying the status of wetlands in the Maragua watershed in Murang’a County found wetlands declining by over 58% from 1989 to 2018. Elsewhere, Kruger et al. (2015), while studying the importance of wetlands on water quality observed that wetlands retain large sediment particles, thus preventing sedimentation and siltation within a water body which would otherwise reduce its water carrying capacity. Furthermore, according to Leon et al. (2018) wetlands store floodwater during the wet season and release it to water streams during the dry season.Stakeholder analysis showed that uncoordinated legislation, poor planning, and lack of community empowerment were the main challenges affecting the conservation and management of wetlands in Murang’a County. The issue of wetland conservation and management in Murang’a County is driven by fragmented laws and policies whose implementation mainly relies on political, sectoral, regional, or county interests. According to Joshi (2003), conflicting priorities of different stakeholders discourages sustainable resource management practices. Similarly, Mombo et al. (2011) reported that wetland conservation and management approaches in Tanzania are operated by multi-sectoral organs with diverse interests in wetlands. Wetlands in Murang’a County lack operational management plans, this encouraging encroachment for farming. Mwita et al. (2012), also found small wetlands in Kenya and Tanzania as being encroached at alarming rates owing to lack of management plans. Legal issues are critical in the conservation and management of wetlands as they determine the level of encroachment to wetlands. Materu et al. (2018), while reviewing wetland policies and legislation in Tanzania noted that targeted legislation on wetlands is critical in addressing the problem of human encroachment.
5. Conclusions
- Wetlands in Kenya are managed through multi-sectoral policies and laws which have numerous conflicting interests. It is evident from this study that the lack of specific policies and laws to govern the use of wetland resources and poor planning are the main challenges facing their conservation. As a result, local communities are rarely involved in decision-making processes, and therefore, due to lack of knowledge and awareness wetlands are drained and converted to alternative uses. Urgent interventions are necessary to amalgamate all policies and laws on wetland conservation and management to cut the tide of human encroachment. Further, there is a need to extensively bring on board local governments and communities in all decision-making processes.
ACKNOWLEDGEMENTS
- This research was conducted through a grant from the National Research Fund (NRF), Kenya, for which I am most grateful. I am also grateful to my research assistant, Mr. Geoffrey Kamau for his able assistance in analyzing land use and land cover data.
References
| [1] | Bai, Y., Ochuodho O.T. and Yang, J. (2019). Impact of land use and climate change on water-related ecosystem services in Kentucky, USA. Ecological Indicators, 102, 51-64. https://102.5164.10.1016/j.ecolind.2019.01.079. |
| [2] | Brinson, M.M. (1993). A Hydrogeomorphic Classification for Wetlands. Technical Report WRP-DE-4. U.S. Army Corps of Engineers Waterways Experiment Station, Vicksburg, MS. |
| [3] | Costanza, R., de Groot R., Sutton P., van der Ploeg S., Anderson S.J., Kubiszewski I., Farber, S. and Turner, R.K. (2014). Changes in the global value of ecosystem services. Global Environmental Change 26, 152–158. |
| [4] | Davidson, N.C. (2014). How much wetland has the world lost? Long-term and recent trends in global wetland area. Marine and Freshwater Research, 65, 934–941. http://dx.doi.org/10.1071/MF14173. |
| [5] | Dixon, M.J., Loh, J., Davidson, N.C., Beltrame, C., Freeman, R. and Walpole, M. (2016). Tracking global change in ecosystem area: The wetland extent trends index. Biol. Conserv, 193, 27–35. https://doi.org/10.1016/j.biocon.2015.10.023. |
| [6] | FAO. (2000). Land cover classification system: Classification concepts and user manual. Food and Agriculture Organization of the United Nations. Rome. http://www.fao.org/3/x0596e/x0596e00.htm. Retrieved February 10, 2020. |
| [7] | Ghermandi, A., van den Bergh, J.C., Brander, L.M. and Nunes, P. (2008). The Economic Value of Wetland Conservation and Creation: A Meta-Analysis, Working Paper 79, FondazioneEni Enrico Mattei, Milan, Italy. https://dx.doi.org/10.2139/ssrn.1273002. |
| [8] | Green, A.J. and Elmberg, J. (2014). Ecosystem services provided by waterbirds. Biol Rev, 89, 105–122. https://doi.org/10.1111/brv.12045. |
| [9] | Joshi, K. (2003). Wetland Conservation: A Vision for Sustainable Management. Environmental Management and Sustainable Development at the Crossroad, Ankus, Nepal, pp. 92-105. |
| [10] | Keche, A., Ochieng, G., Lekapana, P., and Macharia, G. (2007). Status of Wetlands in Kenya and Implications for Sustainable Development. Environment and Sustainable Development. |
| [11] | Krüger, F., Scholz, M., Kreibich, M., & Baborowski, M. (2015). Sediment retention in the floodplains of the river Elbe. Hydrologie und Wasserbewirtschaftung 59, 380-395. 10.5675/HyWa_2015,6_7. |
| [12] | Leon, A., Tang, Y., Chen, D., & Yolcu, A., Glennie, C., & Pennings, S. (2018). Dynamic Management of Water Storage for Flood Control in a Wetland System: A Case Study in Texas. Water 10, 325. 10.3390/w10030325. |
| [13] | Macharia, J., Thenya, T., and Ndiritu, G. (2010). Management of highland wetlands in central Kenya: The importance of community education, awareness and eco-tourism in biodiversity conservation. Biodiversity. 11. 85-90. https://doi.org/10.1080/14888386.2010.9712652. |
| [14] | MEA (Millennium Ecosystem Assessment). (2005). Ecosystems and human wellbeing. Synthesis. Washington, DC: Island Press. https://www.researchgate.net/deref/http%3A%2F%2Fedepot.wur.nl%2F45159. Retrieved February 12, 2020. |
| [15] | Mitsch, W.J., Bernal, B. and Hernandez, M.E. (2015) Ecosystem services of wetlands, International Journal of Biodiversity Science, Ecosystem Services &Management 11 (1), 1-4. https://doi:10.1080/21513732.2015.1006250. |
| [16] | Mitsch, W.J., & Gosselink, J.G. (2015). Wetlands. 5th ed. Hoboken, NJ: John Wiley & Sons, Inc. |
| [17] | Mombo, F., Speelman, S., van Huylenbroeck, G., Hella, J., Munishi, P., & Moe, S. (2011). “Ratification of the Ramsar Convention and Sustainable Wetlands Management: Situation Analysis of the Kilombero Valley Wetlands in Tanzania.” Journal of Agricultural Extension and Rural Development, 3, 102–112. |
| [18] | Muema, J.M., Kaluli, J.W., Gathenya, J. M.& Mwangi, B.M. (2019). Evaluation of Wetland Loss in Maragua Watershed, Murang’a County, Kenya. Journal of Sustainable Research on Engineering 4 (4), 160–170. http://jsre1.jkuat.ac.ke/index.php/jsre/article/view/81. |
| [19] | Murang’a County Integrated Development Plan, (2018). https://cog.go.ke/media-multimedia/reportss/category/106-county-integrated-development-plans-2018-2022?download=311:murang-a-county-integrated-development-plan-2018-2022. Retrieved February 15, 2020. |
| [20] | Mwangi, K., Butchart, S. H. M., Munyekenye, F. B., Bennun, L. A, Evans, M. I., Fishpool, L. D. C., Kanyanya, E., Madindou, I., Machekele, J., Matiku, P., Mulwa, R., Ngari, A., Siele, J. and Stattersfield, A. J. (2010). Tracking trends in key sites for biodiversity: a case study using Important Bird Areas in Kenya. Bird Conserv. Internatn, 20, 215–230. |
| [21] | Mwita, E., Menz, G., Misana, S., Becker, M., Kisanga, D., & Boehme, B. (2012). Mapping small wetlands of Kenya and Tanzania using remote sensing techniques. International Journal of Applied Earth Observation and Geoinformation, 21(1), 173–183. https://doi.org/10.1016/j.jag.2012.08.010. |
| [22] | NRSCC. (2014). Annual Report on Remote Sensing Monitoring of Global Ecosystem and Environment (Large Area Wetlands of International Importance); National Remote Sensing Center of China: Beijing, China. https://www.restec.or.jp/geoss_ap7/public/presentation/day1/cr03_nrscc.pdf. Retrieved February 15, 2020. |
| [23] | Rebelo, A., Emsens, W., Esler, K., & Meire, P. (2018). Quantification of water purification in South African palmiet wetlands. Water Science and Technology, 78. 10.2166/wst.2018.389. |
| [24] | Rockloff, S.F., & Lockie, S. (2004). Participatory tools for coastal zone management: Use of stakeholder analysis and social mapping in Australia. Journal of coastal conservation, 10(1): 81-92. https://doi.org/10.1652/1400-0350(2004)010[0081:PTFCZM]2.0.CO;2. |
| [25] | Sakané, N., Alvarez, M., Becker, M., Böhme, B., Handa, C., Kamiri, H.W. and Van Wijk, M. T. (2011). Classification, characterization, and use of small wetlands in East Africa. Wetlands, 31 (6), 1103–1116. https://doi.org/10.1007/s13157-011-0221-4. |
| [26] | Sharma, S., & Singh, P. (2021). Wetlands conservation: Current challenges and future strategies. John Wiley & Sons. ISBN: 978-1-119-69268-3. |
| [27] | Thurstone, L.L. (1927). A law of comparative judgment. Psychological Review, 34 (4), 273–286. https://doi.org/10.1037/h0070288. |