E. C. Merem1, Y. A. Twumasi2, J. Wesley1, D. Olagbegi1, M. Crisler1, C. Romorno1, M. Alsarari1, P. Isokpehi1, A. Hines3, G. S. Ochai4, E. Nwagboso5, S. Fageir6, S. Leggett7
1Department of Urban and Regional Planning, Jackson State University, 101 Capitol Center, Jackson, MS, USA
2Department of Urban Forestry and Natural Resources, Southern University, Baton Rouge, LA, USA
3Department of Public Policy and Administration, Jackson State University, 101 Capitol Center, Jackson, MS, USA
4African Development Bank, AfDB, 101 BP 1387 Avenue Joseph Anoma, Abidjan, AB 1, Ivory Coast
5Department of Political Science, Jackson State University, 1400 John R. Lynch Street, Jackson, MS, USA
6Department of Criminal Justice and Sociology, Jackson State University, 1400 John R. Lynch Street, Jackson, MS, USA
7Department of Behavioral and Environmental Health, Jackson State University, 350 Woodrow Wilson, Jackson, MS, USA
Correspondence to: E. C. Merem, Department of Urban and Regional Planning, Jackson State University, 101 Capitol Center, Jackson, MS, USA.
| Email: |  |
Copyright © 2020 The Author(s). Published by Scientific & Academic Publishing.
This work is licensed under the Creative Commons Attribution International License (CC BY).
http://creativecommons.org/licenses/by/4.0/

Abstract
During the early 20th century when Nigeria was the largest producer of palm oil globally, the South Eastern region accounted for much of the output. Being the chief source of revenue responsible for the development of the zone at that time, the prosperity exuded therein from oil palm trade, spilled over to other parts of Nigeria in varying forms. Considering the large presence of palm trees and the associated plantations in the Southern region. The prominence of Nigeria in the sector was such that the exported items to destinations all over the world penetrated major markets where palm produce drew regular interests from buyers. Added to that, during the civil war in the late 1960s and the discovery of petroleum in the South East region, palm oil plantations were obliterated, and output waned as petroleum emerged as the major export of the nation. Yet, what seems forgotten is that palm oil was instrumental in the economic advancement of the nation, with market access and infrastructure essential to product delivery concentrated in riverine communities along the Delta. However, with the post war slide, no serious effort was made to revive the foundering sector amidst institutional neglect and misplacement of policy priorities. Even with the present scramble to revive it, the amenities for industrial revival and up to date studies on the state of the sector remain elusive. Compounding that, the Southern region still lacks complete georeferenced info on oil palm activities essential for planning under a mix-scale model. For that, this paper will fill that void by assessing the state of the palm oil sector in Southern Nigeria. Emphasis are on the issues, trends, impacts, factors and efforts using mix-scale tools of Geographic Information System (GIS) and descriptive statistics. The results not only reaffirmed the region’s position as the frontier of oil palm with changes in output and cultivated areas from 2006-2012, but Akwa Ibom and Imo state outpaced the other states. Also, from 1961-1965, the former Eastern region stood out in all statistical categories associated with production and usage beginning with 74.08% in output and 93.48 to 59.1% in purchases and residential consumption. The ecological impacts consist of 6.6% deforestation rates nationwide and the loss of forested land in Cross River state followed by continued forest land declines (10.26 -16.24%) in 2002-2006 and 47.58% in 2007 from palm oil production activities. Aside from land grabbing incidents by oil palm companies at the expense of local communities, there are greater risk exposures from the use of agrochemicals with threats to biodiversity. While the GIS mappings revealed the firm concentration in output and cultivated areas in the core producing states, the patterns also show gradual dispersal of oil palm indicators onto the other states. Given the linkages to socio-economic, and physical elements, to remedy the problems, the paper offered some suggestions ranging from improved farm policy towards the oil palm sector, community participation, and corporate social responsibility and the design of a regional oil palm information system to ameliorate the situation.
Keywords:
Oil palm, GIS, Lower South, Nigeria, Production, Cultivated Areas, Impacts, Changes
Cite this paper: E. C. Merem, Y. A. Twumasi, J. Wesley, D. Olagbegi, M. Crisler, C. Romorno, M. Alsarari, P. Isokpehi, A. Hines, G. S. Ochai, E. Nwagboso, S. Fageir, S. Leggett, Appraising the Changing Trends in Oil Palm Farming in Nigeria’s Lower South Region, International Journal of Ecosystem, Vol. 10 No. 1, 2020, pp. 1-22. doi: 10.5923/j.ije.20201001.01.
1. Introduction
In the past centuries, oil palm plantations provided Nigeria an exceptional opportunity globally in the production of an indigenous crop at a relatively lower cost [1]. This easily marketable produce turned out to symbolize a deep sense of fulfilment in the lower coastal Southern region of Nigeria. Between the 1800s to initial phase of the 1900s, the Lower South zone controlled the international market of oil palm [2]. Even though historiographic sources trace those activities deep into the 17th century. Crude oil palm alongside palm kernel featured prominently on the list of typical goods sold to West European dealers by Southern Nigerian croppers. It has been shown that, the miracle crops tied collectively various number of indigenous palm tree farmers, country side merchants, small town co-ops, sea traders, distributors, coastal family entrepreneurs and European traders to relish one of the lengthiest eras of continual economic expansion in the History of West Africa [1,3]. Since such activities moved underprivileged growers from poverty and facilitated Nigeria’s emergence among the major food producers in Africa. It comes as no surprise that beginning in the 1600s, crude oil palm trades turned Nigerian communities into the chief commercial centers for farm produce and solid earth mineral deposits till today [1,4,5,6,7,8], but there are also mounting ecological costs in the process [9,10,11,12,13,14]. Even though it needs pointing out that Nigeria’s portion of world oil palm output stayed under 5 percent in 2016. It does pale in comparison given the trends between the 1800s to the initial phase of 1900s, during which almost 50% of global palm crude output originated from Nigeria [1]. The study area with its suitable terrain for agricultural activities benefited as a feasible frontier for crude oil palm market undertakings. Also, the region’s humid environment has distinctly supported palm oil farms, variety of crops and forests in the last centuries [15]. Just as the presence of millions of growers in the zone exemplifies the potentials and resurgence of the oil palm sector in the country. The performance so far, seems to be opening the door of market opportunities and linkages, to sub sectors of the economy through the infusion of high-tech infrastructure, aimed at transforming the palm oil industry facilities into meeting 21st century needs. Despite these potentials, there are still concerns about the interactions with the natural ecosystem of the surrounding areas. Considering the nation’s position in the local trade for vegetable oil that generates billions of dollars yearly. Several grocery items such as butter, bread, and chocolate often used by citizens in Nigeria involves the processing and mixing of fresh oil palm ingredients. Accordingly, majority of minor farm operators, cooperate oil palm businesses and overseas financers currently are into nutritional or non-agricultural uses of oil palm. For that, there is an emerging group of targeted ventures making headways in energy crops and power production circles that are currently changing the face of oil palm affiliated sectors in a manner not seen previously [16,5]. Having said that, the volume of oil palm output in the country not only exceeds those of other Africa nations, but the crop represents the most essential market oil products in Nigeria and a major economic life support for many country side households that are at the center of the nation’s farming tradition [17]. Thus, by the beginning of the 1900s, the nation accounted for all crude oil palm produce traded in the global marketplace and took in the external revenues that it generated [35]. In as much as Nigeria dominated the global production of palm oil with 43% of the overall output in the 1960s [18], over time, many elements located within the larger political economy, the agricultural structure and others inhibited that capacity. Expectedly, it has now become quite daunting for Nigeria to regain her past prominence in the sector given the inability to meet growing demands [19,20,21], amidst rising environmental impacts made up of deforestation, biodiversity loss, land grabbing standoff and the dislocation of indigenous people [22,23,24,25,26,27,28,29].Furthermore, the discovery of hydrocarbon in 1956 not only resulted in the steady abandonment of farming, but the situation became compounded by the civil war from 1967 through 1970. Since the theater of conflict concentrated mostly in the defunct Eastern Nigeria, the oil palm hub. The senseless execution of the war dealt a self-inflicted blow to the palm oil component of the economy and robbed Nigeria of her immense resources. The tragedy ravaged nearly much of the oil palm estates and dislocated the small farm producers responsible for 80% of the internal output. Sadly enough, Malaysia, the nation whom Nigeria offered palm oil seedlings to in 1971 after the war, supplanted her eventually as the number 1 producer in the globe [30,2,31]. Partly for that and other reasons, Malaysia and Indonesia account for 83% of the global output toady, while Nigeria languishes miserably in lower single digits as the number 7 in international ranking. This would not have happened if not for the destruction of the oil palm industry in the Eastern region during the war and the eventual policy outrage of turning over the key to the nation’s economic treasure to a competitor. After the free fall, Nigeria remains a net importer of the oil palm product with a production capacity of 930,000 MT from 2013 through 2014 coupled with a yearly domestic consumption level of 2.0 million MT amidst a deficit of 1,070,000 MT [2,5,32,18]. This shortfall threatens the operational capacity of industries who rely on crude palm oil as key ingredient of their activities. With the risks associated with oil palm production and the potentials integral to it [33,34], very little work exists in the literature on the state of the sector in the Lower South region of Nigeria from a mix-scale perspective [35,36,37,38,39,40, 41]. This study will fill that void by assessing the activities in oil palm farming in the Southern region using techniques of descriptive statistics and GIS with emphasis on the issues, trends, factors, impacts, and efforts. Accordingly, the paper has four objectives. This consists of contributions to the literature, regional analysis of the issues in oil palm production, while the third and fourth aims are to develop decision support tools, and the design of novel schemes for reviving the sector. The study is organized in five sections beginning with the introduction and methods as the parts 1 and 2 together with the results and discussion side in parts 3 to 4 followed by the conclusion in part 5.
2. Methods and Materials
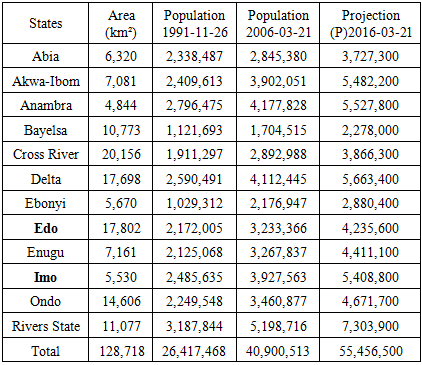
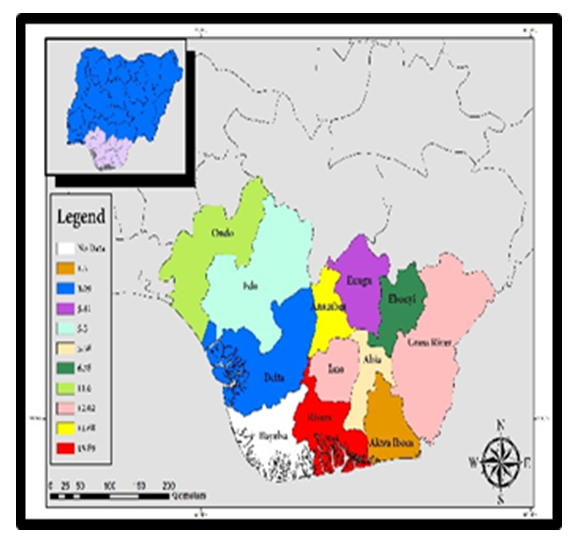
The Lower South region (Figure 1) spans through 128,718 km2 area across 11 states in Southern Nigeria mostly in the Niger Delta off the Atlantic Coast with a population of 55 million (Table 1) [42]. Many of the residents in the states are situated along low lying coastal areas where River Niger splits into numerous tributaries. The key states in the study area of Lower Southern Nigeria region tagged the “oil belt” encompasses Abia, Akwa Ibom, Bayelsa, Cross River, Delta, Ebonyi, Edo, Imo, Ondo, and Rivers, Anambra, and Ondo. They are represented under three geopolitical zones: The Southeast, Southwest, and the South-south zones [43]. While the ecosystem of the area is highly diverse and supportive of numerous terrestrial creatures, aquatic flora and faunal species and human life, it boasts of one of the richest wetlands in the world [44]. With much of the region divided into four ecological zones made up of coastal inland zone, mangrove swamp zone, freshwater zone and lowland rain forest zone. There exists an extensive area of mangrove forests, farms and estuaries on a 3,122 km2 coastline germane to the planting of oil palm trees. At the same time, the cultivation of oil palm trees through plantations in the rainforest ecosystem in the zone has long been associated with environmental degradation and the displacement of local people as well [42].Table 1. The Population of the Study Area
 |
| |
|
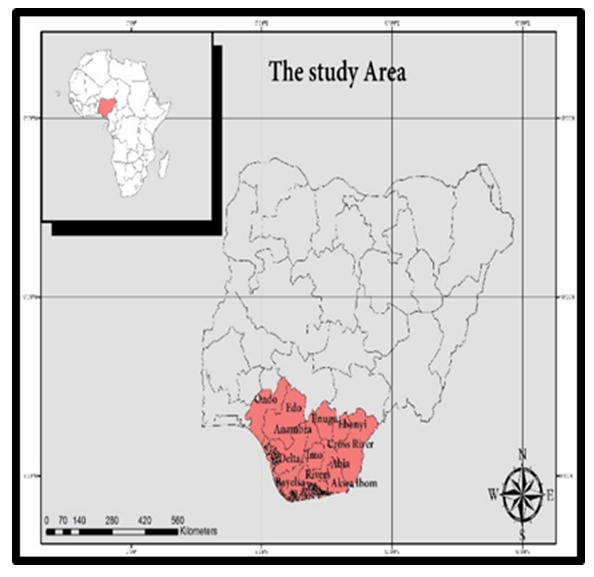 | Figure 1. The Study Area: Nigeria’s Lower South Region |
Considering the fragility of the ecosystem, the area is heavily synonymous with frequent precipitation and fluctuating temperature essential for the cultivation of palm oil. Even though the Niger Delta area of the southern region is the nation’s palm oil belt accounting for almost 97% of the country’s total export. The Lower southern ecozone zone faces the threats of deforestation and pollution emanating from the pesticides used in oil palm farms [42]. Accordingly, oil palm in Nigeria thrives in the coastal zone along the tropical rainforest under varying deepness of 100 to 150 miles and a river or riparian system that traverses the basins of the Niger across 450 miles to the ocean. Noticeably, the climate of the Lower Southern region characterized by strong latitudinal zones is progressively known for its heavy rainfall that occurs commonly in the South-south, with the shoreline along Bonny (south of Port Harcourt) and east of Calabar, where the average annual rainfall volume surpasses over 4,000 mm. Overall, the rest of the South-south and Southeast gets 2,000 to 3,000 mm of rain yearly [45], essential for the viability of oil palm plantations in the heart of the oil belt. Under such conditions, the Southern region flourished as the frontier of the globe’s best quality oil palm crude trade [42], that earned it the name the “oil river” district, in the 19th and early 20th century [1]. In the process, the palm oil production activities as major catalyst of development sparked huge economic turnaround in the lives of ordinary people in southern rural areas. Since oil palm trees thrive in a biodiversity rich moist tropical environment like the Lower South at higher output thresholds of 5-8 times ahead of other crops. The lack of best management practices linked to the cultivation, threatens the ecosystem in the form of deforestation and degradation, that must be assessed [42].
2.1. Method Used
The research uses a mix scale approach involving descriptive statistics and secondary data connected to GIS to assess the state of palm oil production and uses and the issues involved along the Nigeria’s lower south region in West Africa. The spatial information for the study came through many agencies comprising of National Population Commission of Nigeria, the Federal Ministry of Agriculture of Nigeria, the United Nations Economic Commission For Africa (UNECA), the United States Department of Agriculture (USDA) foreign agricultural services and The United States Department of Agriculture (USDA) Office of global analysis. Additional sources of geographic info are the Partnership for oil palm initiative in the Niger Delta, (PIND). Other sources of spatial data came from the Nigerian Meteorological Agency, the office of surveyor general, the Ministry of Niger Delta Affairs, the Federal government of Nigeria, Palm oil Production and Processing plant in Imo and UN Food and Agricultural Organization (FAO), the United Nations Environment Programme (UNEP), and the International Union For the Conversation of Nature (IUCN). Additionally, the Rainforest alliance, Government of Former Eastern Region, Government of Western region, Government of Northern region, the archives of the Federation of Nigeria in the First Republic and the European Union, the Economic Community of West African States (ECOWAS) also furnished other information needed in the research. Principally, much of oil palm use or palm oil indicators such as the area cultivated with oil palm, the volume of crude oil palm production, the farm gate prices, allied or related products, palm oil export volume, export cargo at major ports, global index prices of major agricultural export crops, and the distribution of oil palm types essential to the region and different zones in the country were obtained from both National and state Government archives of the defunct Northern, Eastern and Western regions of Nigeria, the National Bureau of Statics, the Lower Nigeria South Departments of Agriculture and Mundi Index.On the one hand, the World Bank, the Food and Agricultural Organization data base of the United Nation (FAOSTAT), the government of the Netherlands, the government of Singapore, the Nigerian Institute for Oil Palm Research (NIFOR) Okitipupa Oil Palm Company Plc (OOPC), Ore-Irele Oil Palm Company Ltd, and the Bureau of National Statistics provided the extra secondary data on the numbers, quantities, trends, gains and declines in palm oil indicators and the other groupings. On the other, the governments of Cross River state, Edo, and Rivers, the vegetable and edible oil association, National Producers Association and the planters owners forum, World Wildlife Federation and Foraminera Market research offered the assistance on historical data and other valuable information on edible oil assets like palm oil and the tree plantations regarding the lower south region. Concerning the remaining data needs, the Central Bank of Nigeria (CBN), The Okomu oil palm company, Pepisco, Sconifaf, the Statiststa, Wilmar international and the Nigerian Agricultural web portal, and the Nigerian Information Technology Development agency and the Agricultural Insurance Cooperation were individually involved essentially in the procurement of information on the areas cultivated, the volume produced and highlights of the changes. In a similar vein, the National Ports Authority, Akpabuyo local government Area, Biasse plantation, Biasse local government area, Cross River state Forestry Commission, PIND, and the National Palm Produce Association of Nigeria (NPPAN), remained instrumental in the provision of other relevant information. Given that the boundaries stayed unchanged, the regional and state, county and federal geographic identifier codes of the states and zones were used to geo-code the info contained in the data sets. This information was processed and analyzed with basic descriptive statistics, and GIS with attention paid to the temporal-spatial trends at the state and regional levels in the lower south region of Nigeria. The relevant procedures consist of two stages listed below.
2.2. Stage 1: Identification of Variables, Data Gathering and Study Design
The opening phase in this enquiry began with the identification of variables required to evaluate the scope of palm oil production and trends at the regional and state levels from 1961, 1988 to 2017. The initial variables include socio-economic and environmental and data made up of population, annual rainfall, population change rate, indices of average world prices of major agricultural export commodities, oilcake and other solid residues of palm nuts and kernels. This was followed by exported crude palm oil, fertilizer use, palm oil areas planted and oil palm production by states, the quantity of imported crude palm oil and size of deforested areas from oil palm output. The others consist of volume of export cargo handled at Nigerian or southern ports, farm gate prices for palm oil by state, estimated area under oil palm in the different production systems, palm oil classes under wild groves, medium and small holders, and estate plantation. Added to that are the population estimates, population growth rates, the percentage of palm oil production systems, marketing board purchases of palm kernels, estimated palm oil production, marketing board purchases of palm oil and residual domestic consumption, estimated palm oil total production and domestic consumption in Nigeria. Notable among the data are the remaining ones like the percentage distribution of major oil palm indicators 1961-1965, cash crop production for Nigeria, palm oil production by country, the percentages of change for palm oil production and the percentages of change for area cultivated with palm oil. These variables as mentioned earlier were derived from secondary sources made up of government documents, newsletters and other documents from NGOs. This process was followed by the design of data matrices for socio-economic and land use (environmental) variables covering the census periods from 2006-2008, 2009 to 2010 to 2012 and the other years (1961-1965 and 1988-1998). The design of spatial data for the GIS analysis required the delineation of county and state boundary lines within the study area as well. Given that the official boundary lines between the 12 states remained the same, a common geographic identifier code was assigned to each of the area units for analytical coherency.
2.3. Stage 2: Data Analysis and GIS Mappings
In the second stage, descriptive statistics and spatial analysis were employed to transform the original socio-economic and ecological data into relative measures (percentages, ratios and rates). This process generated the parameters for establishing, the extent of palm oil production, cultivated area, land use change, land lost from deforestation, oil palm farm types, size of the farm types, size of medium farms, palm grove farms, quantity of oil palm exports and the volume of foreign cargoes. The data analytical stage also provided the contours in the processing of info on the farm gate prices and the amount of rainfall in the Lower South region and changes in oil palm indicators prompted by growing consumption and population surge and growth rates across the study area among the individual states through measurement and comparisons throughout the years. Since the spatial units of analysis consist of various states, regions, shorelines, and counties and the boundary and locations where the cultivation and consumption and export of crude palm oil flourished. This approach allows the detection of change and the extent of usage. The tables highlight the actual frequency and impacts, oil palm land declines and the pace of production and the trends as well as the ecological and economic costs. The remaining steps involve spatial analysis and output (maps-tables-text) covering the study period, using Arc GIS 10.4 and SPSS 20.0. With spatial units of analysis covered in the 12 states (Figure 1), the study area map indicates boundary limits of the units and their geographic locations. The outputs for each state in the region were not only mapped and compared across time, but the geographic data for the units which covered boundaries, also includes ecological data of land cover files and paper and digital maps from 1998 -2012. This process helped show the spatial evolution of location of various levels of usage, and the trends, the ensuing socio-economic and environmental impacts, ecological degradation as well as changes in other variables and factors driving the palm oil production capacity, oil palm land use and the impacts in the study area.
3. The Results
This section of the paper presents the results of the data analysis on the changing situation in oil palm land use trends in the study area. There is a focus on the temporal profile of land use based on production and cultivated areas, land base set aside for different production systems and farm types. This is followed by an examination of the proportions of land use change and oil palm production activities in the defunct regions from 1960-1965 and the ecological impacts of production in the Lower South region. The others consist of GIS mappings, factors and efforts to revive the oil palm sector in the region.
3.1. Palm Oil Land Use in the Lower South Region
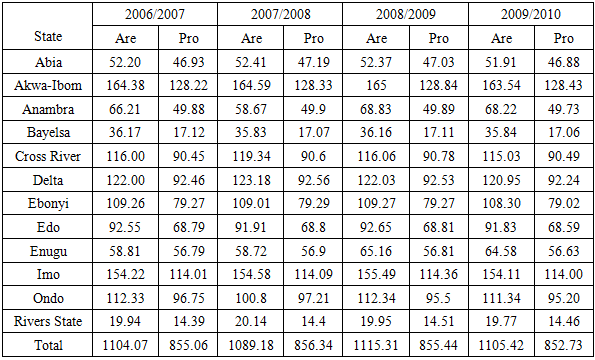
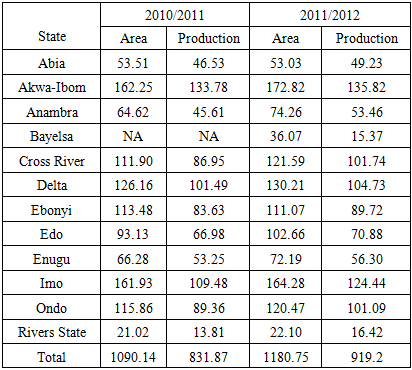
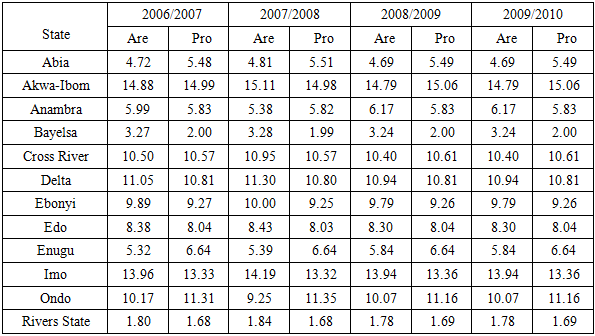
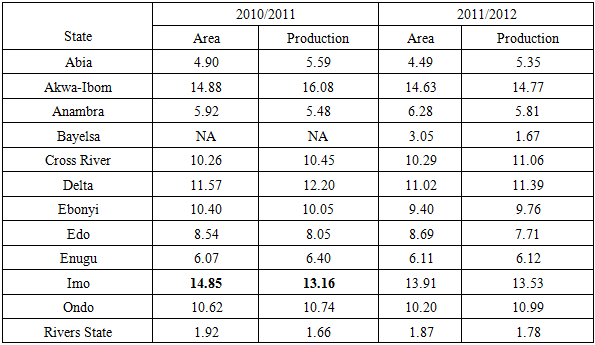
The temporal distribution of the palm oil production activities between 2006 through 2012 shows the dominance of the states of Akwa Ibom and Imo with both accounting for sizable values in the areas under cultivation and production levels. The trends at the regional level in 2006 to 2010 highlight areas set aside for oil palm farm produce and the output. The simple summation based on the info from the table points to visible abundance in the core palm produce indicators. In the process, the study area of Nigeria’s Lower South region held an overall land base of 4413.98 thousand hectares to 3419.57 Thousand Metric Tons in output from the various states by 2006/2007 through 2009/2010. Going by the pace of activities that occurred among its main parameters in place, the region saw sizable averages of 1103.4 ha-854.8 TMT in palm oil land areas and production. During the period 2006 to 2010, Akwa Ibom averaged about 164.45 hectares in palm oil land dedicated to farming alongside 128.45 MT in output. In the individual years, land under palm oil grew from 164.38 to 164.59 hectares in 2006 to 2008 therein. This was followed by 165 hectares to 16 3.54 by 2009 to 2010. By the same token, palm oil production capacity for the state stayed stable at 128.22 to 128.33 MT to 128.84 to 128.43 MT in each of the years between 2006 to 2010. In the case of Imo State, where similar distribution patterns hold, the state posted averages of 154.6 hectares and 114 thousand (114,000 MT) throughout 2006 to 2010. Being the second leading state in palm oil farming in the Lower south region, the land area vacillated by 154.22 to 154.58 hectares in the first two periods of 2006-2008 coupled with the soft rally of 155.49 hectares, until a sudden slow down to 154.11 hectares during the periods 2009 to 2010. Of the total of 1104.07 thousand hectares in areas and 855.06 in metric tons under the production of palm oil in 2006/2007 fiscal year. Among the next group of 4 states (Delta, Cross River, Ondo and Ebonyi) with mid-level activities, the first two; Delta and Cross River State in the south-South zone, held identical levels of averages estimated at 112. 4 ha to 116.60 TMT in oil palm output. Even at that, Delta’s totals of 480.16 ha to 369.79TMT in both palm land size and oil production surpassed the two other states listed on the category. Further along these lines, in the periods 2006/2007 to 2009/2010, Delta state’s land base went back and forth from 122 ha to 123.18 to 122.03 to 120 ha as oil output averaged 94.22 MTN during the four years. Furthermore, Cross River on the other hand with a total of oil palm land area of 466 thousand hectares showed promise with the delivery of 362.2 TMT. The order of land use activities involved strikingly identical values of 166 to 119.34 hectares to 116 to 115.03 ha among the indicators all through the years as production held firm at 90 TMT category. The activities in the remaining states in the group like Ondo and Ebonyi revealed some similarities in the total land areas (of 436.81 to 435.84ha) and average levels of 109.4 to 108. 96 ha. This is seemingly in contrast to the production capacity of 384.66 to 316.85 TMT in both states at disparate averages of 96.16 to 79.21 TMT with Ondo ahead of Ebonyi all through those years. In the lower end of a quintet of oil palm producers in the Lower South region (Edo, Anambra, Enugu, Bayelsa and Rivers). The initial duo of states Edo and Anambra maintained much higher proportions (368.94-261.93 ha and 68.74 -199.4 TMT) in comparison to their neighbors in the distribution of land size and the volume of crude oil palm averages estimated at 92-68.74 and 68.8 to 49.55 from 2006 through 2010. In the same time, Enugu state saw some activities as its overall palm oil farm activities in the sector involved the use of 247.27 ha in the production of 227 MTN crude oil palm. Anambra’s average figures of 61 ha to 56.78 TMT exceeded those of Bayelsa and River states during the same year based on the indicators. In as much as the nearby states of Bayelsa and Rivers ranked below the rest of the states in the group in all oil palm core indicators, the former total land base and production capacity of 114 ha to 68.36 TMT surpassed Rivers state where these oil farm indicators stayed in lower levels (79 ha to 57.76TMT) as the patterns in the respective averages stayed unchanged. In the other years, 2010-2012, when both the states of Akwa Ibom and Imo stayed atop of the palm oil producing states ranking in most indicators. These neighboring states had overall oil palm land use dispersed across 335.07 ha to 326.21 ha and production volumes of 269.6-233.93 TMT in the operational profile of the region. This involved average identical levels of 167.53 -163.1 and 134.8 to 116.96 in land area and quantity of crude oil palm. Thus, looking at the oil palm activities therein, of those two states in 2010 to 2012, note that Akwa Ibom’s opening land use account went from 162.25 to 172.82 ha while Imo stayed at similar levels (161.93-164.28 ha) at averages of 167.53 to 116.31 ha. Turning to the oil palm production in the respective states during the same fiscal years, Akwa Ibom’s crude palm oil output appeared stable at 133.78-135.82 TMT as Imo surged by 109.48 to 124.44 TMT. In the second tier of states, Cross River and Delta held notable edge in regional classification over other states with total land values of 241.9 to 256.37 ha to 206.72 -188.69 TMT in crude oil palm production. In as much as both states stayed active on different levels in the regional rankings, they maintained close averages of 128.18-120.74 ha to 103.11 to 94.34 TMT. At that time, Cross River saw initial uptick of 111.90 -to 121.59 ha in land use and another surge of 126.16 to 130.21 ha for Delta. Both states followed with notable crude oil palm production levels (101.49-104.73 and 101.74 to 86.95 MT). Elsewhere, Ondo and Ebonyi showed some vibrancy with total land areas of 236.33 -224.55ha and a rebound in the production of crude oil palm of 190.45 to 173.35 TMT coupled with proportionate average values in the same indicators at 118.16-112.77 ha and 95.22 to 86.77 TMT in oil output as well. Notwithstanding Edo’s notable values in oil production indicators among the low to medium producing states, Edo held 195.79 ha to 137.86 TMT in land area and oil palm production. This surpassed the identical level of activities in neighboring Enugu and Anambra at 138 ha and 109.55 TMT to 99.07 TMT. Even at that, Edo’s average use levels were still significant enough at 97.89 to 68.93 in contrast to Enugu and Anambra where averages in land use indicators hovered over 69 ha and 49.53-54.77 TMT while Rivers state finished below her Eastern neighbors in land areas covered in palm trees and production capacity by 43 thousand ha to 30 TMT in the same periods. Table 2. Palm Oil Areas Planted in thousand Hectares and Production in Thousand Metric Tons by State
 |
| |
|
Table 3. Palm Oil Areas Planted in thousand Hectares and Production in Thousand Metric Tons by State
 |
| |
|
3.1.1. Area Under Oil Palm in Various Production Systems
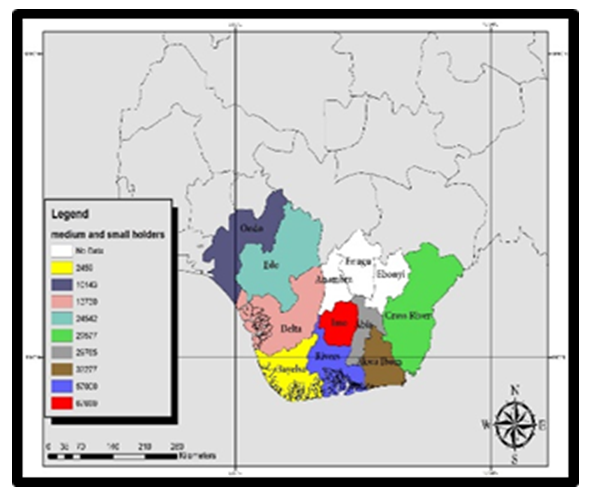
In the context of areas under oil palm within different production systems from the table, the study area boosts of vast concentration of wild groves estimated at 1,062,345 ha followed by other types of oil palm farms. This consists of the medium and small holder types and estate plantation farms spread across 267,182- 105,375 ha in some selected areas in the 9 states of Nigeria’s Lower South region in 2009. The key thing to glean from the distribution of the wild oil palm groves among the states in the region stems from the pace at which the first four states (Akwa Ibom and Cross River alongside Abia and Imo) in the former Eastern region exhibited their dominance in the sector. Seeing the allotted space of 240,000 ha to the wild groves by both Akwa Ibom and Cross River, the corresponding areas (150,000-106,690 ha) set aside for the palm produce in Abia and Imo left no one in doubt of the volume of activities in both states over the years. The other states worthy of mention in the third order include Rivers, Ondo and Delta where wild grove oil palm operations occur in notable areas (85,000-91,655 and 60,000 ha). The duo of other states Edo and Beyelsa that allotted about 39,000 to 50,000 ha in area planted with palm oil wild groves finished below the others in the grouping as the table shows. Thus, in terms of areas, wild groves coverages really stayed active. Elsewhere, the index of palm oil areas managed under medium and small holders’ portion of farms, highlights high concentration in the medium level land sizes (67,690 ha to 57,000 ha) of those farm types clustered around Imo and Rivers states. Akwa-Ibom, Abia, Cross River and Edo stayed in the mix with enough land base (32,277 thousand ha to 24,542 ha plus) to shore up production. The small sized oil palm land areas operated by marginal holders and mostly in lower thousands (2459-13,730 ha) in the region appeared more in a trio of states Bayelsa, Ondo and Delta while estate plantation types reached their highest levels of 20,000 ha plus to 16,000 and above in Cross River, Edo, Ondo, and River States. Of great importance in all these is the seemingly high presence of oil palm estate plantation farm types with land base in the lower thousand in all most half a dozen Niger Delta states of Abia, Akwa-Ibom, Bayelsa, Delta and Imo (See Table 4 in the Appendix).
3.1.2. The Percentages in Land Use Changes
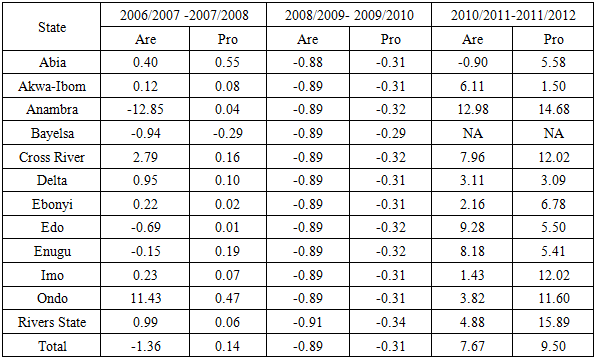
Furthermore, the ordinal ranking of percentage level of all individual states in the Delta under the three farm categories affirms the steadiness and enviable position of Cross River state (22.59,11.06 to 24.87%) as a major player in the sector mostly in double digits than most of its neighbors in 2009. Besides that, a quartet of states; Abia, Akwa-Ibom, Imo and Rivers ranked in 2 of the 3 listed categories showed flashes of high standings in their double digits’ percentage points of 10.04-22.59 as a measure of oil palm market activities therein as well. Consistent with the rankings is the primacy of Edo state at 26.71%. This is an all-time high level in oil palm estate farm plantations’ land areas than the others in the Niger Delta. Looking at the percentages of change for palm oil area and production capacity between 2006 through 2012, aside from the split involving overall land use declines of -1.36 and gains of 0.14% in oil palm production in the Lower South region during 2006 through 2018. The pattern of changes that followed from 2008 to 2010 showed mostly meagre declines of less than 1.00% or -0.89 to -0.31% in the area cultivated in palm trees and crude oil palm volumes. With time, came a visible rebound with a surge of 7.67 to 9.50% in the core oil palm indicators all through 2010 to 2012. At the state levels where 4 out of 12 states (Anambra, Bayelsa, Edo, and Enugu) saw declines in the land area set aside for palm oil activities at the rate of -12.85 to -0.94% and -0.69, to -0.15% with Anambra accounting for the largest losses. In the other 8 states, Ondo posted the largest incensements of 11.43% alongside Cross Rivers that recorded 2.79% gains in areas planted with palm oil trees. The rebound dwindled to less than single digits as one moves further into the remaining oil palm producing states from Abia to Rivers state. Just as production dropped to only -0.29% in Beyelsa, the anticipated growth in crude palm oil output in the other 11 states during the same period appeared much soft and weaker in 2006 to 2008 until it evaporated completely throughout 2008 to 2010 when land area and production remained negative. However, by 2010 -2012, a major rebound occurred with huge turnaround in every state listed on the table as Anambra and Cross River states set the tone via robust gains of 12.98-14.68% and 7.96-12.02% in oil palm farmland and crude oil palm output. Following in their footsteps were 5 more states (Edo, Enugu, Imo, Ondo and River) from which the first three Edo, Enugu and Imo accounted for sizable gains of 9.28-8.18% to 5.50-5.40% and 1.43-12.02% in oil palm areas and production. Considering similar pace of changes evident in oil palm indicators elsewhere at 3.82-11.60% to 4.88-15.89% in the states of Ondo and Rivers. Delta and Ebonyi also experienced visible upticks of 3.11-2.16% to 3.09-6.78% in the size of palm oil farmland and the production of crude oil palm (Table 5-7).Table 5. Percentages Palm Oil Areas Planted in thousand Hectares and Production in Thousand Metric Tons by State
 |
| |
|
Table 6. Percentages Palm Oil Areas Planted in thousand Hectares and Production in Thousand Metric Tons by State
 |
| |
|
Table 7. Percentages of Change For Palm Oil by State 2006-2010
 |
| |
|
3.1.3. Oil Palm Production 1960-1965
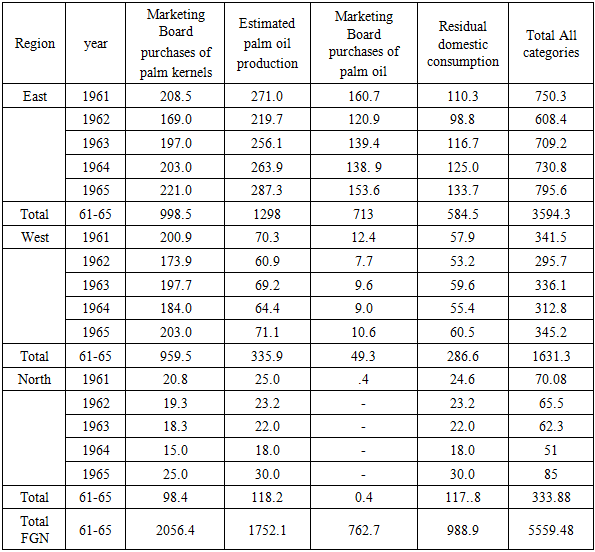
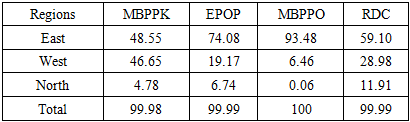
Understanding the current state of the oil palm sector in the Lower South region, requires historical data analysis of production and consumption trends during the early and mid-1960s under the defunct regions especially the East and a portion of the old West that constitute much of the current study area. From 1961 to 1965, the former Eastern region outpaced the then Western and the Northern regions in almost all the statistical categories associated with oil palm output and usage. Despite the identical levels in total volumes of palm kernels (998.5 to 959.5 thousand tons) purchased via marketing board at that time. The Eastern region overtook the West (the second largest source) in oil palm production, purchases and domestic usage considerably in 1961 to 1965 by 1298 to 713 and 584.5 thousand tons. The disparity in oil palm production and usage between the East and West were further evidenced by the later’ lower tonnages or capacities (335.9 to 49.3 thousand tons to 286.6 thousand tons) in estimated production, purchases and the residual domestic consumption levels which pales in comparison with the trends in the then Eastern region. Aside from the meagre oil palm production activities in the old Northern region during the 1960s, the summation of all the four production categories from 1961 to 1965 in the context of all transactions still puts the Eastern zone ahead of its regional counterparts. In the percentages, apart from the relative parity of 48.55 to 46.65% in the marketing boards purchases of palm kernel during 1961 through 1965. The Eastern region was responsible for significant percentage levels of the core indicators beginning with 74.08% in crude oil palm output nationwide to 93.48 to 59.10% in both purchased palm oil and residential consumption at that time (Table 8-9).Table 8. Estimated Palm Oil Total Production and Domestic Consumption In Nigeria 1961-65* (Thousand tons)
 |
| |
|
Table 9. The Percentage Distribution of Major Oil Palm Indicators 1961-1965
 |
| |
|
3.2. The Environmental Impacts of Oil Palm Farms
The effects of oil palm production in the study area are quite evident with mounting threats to the surrounding ecology. The most serious dangers consist of deforestation, biodiversity loss and land grabbing which often leads to forced eviction and dislocation of indigenous folks of the zone from their land. All these impacts are presented in sequence below.
3.2.1. Deforestation in the Cross River Area
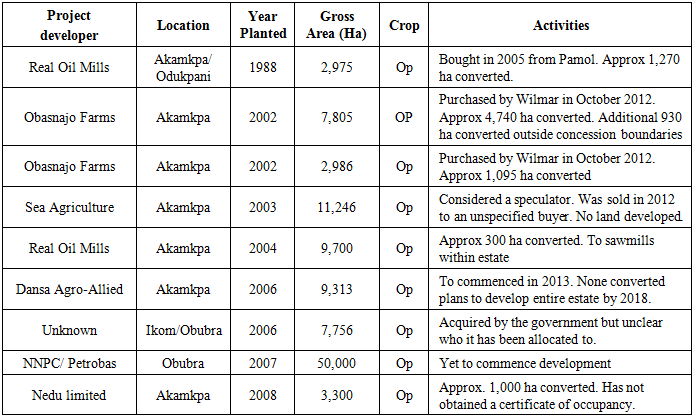
Just as the rate of deforestation from areas cultivated with palm oil stands as 6.6% in the producing areas of the country. Cross River state as the biggest tropical rainforest zone in Nigeria and a major source of crude palm oil export in Nigeria has been at the receiving end of degradation based on its history. Aside from that, Cross River state has endured recurrent cases of deforestation due to encroachment from plantation agriculture, especially palm oil farming. Since 1907, Cross River state has seen over 2/3 of its forest habitat vanish from the pressures mounted by huge corporate oil palm estates, under which palm oil occupies 62.5% of the planted portions. Said that, in assessing the ecological effects of palm oil farming, one must consider the origins of the issue during the growth of rubber plantations and the later years. The trend continued unabated with the clearance of tropical moist forest for palm oil farmsteads from 1947 through 1979. In as much as the oil palm plantations therein flourished under favorable ecological conditions. Essentially, oil palm estates in Cross River state commenced in 1947 under the auspices of the then Eastern Nigeria government and later in 1976. Consequently, large-scale deforestation did set in during the 1980s at levels comparable to what was witnessed between the 1940s-1970s and 2002 through 2012. Even at that, vast swaths of forested land in the oil palm belt in the state disappeared considerably beginning with 2,500 ha in 1947, to 6000 ha in 1954, and 9000 ha in 1957. This was followed by the loss of another 5000 ha to 19,000 ha by 1960 through 1965 until the surge to 25,000 ha in 1979. Nevertheless, in the 1980’s, the Cross-River side of the study area also saw a proliferation of more privately controlled oil palm farms within the localities of most plantations with impacts on the rainforest ecosystem. From the periods 1988 to 2008 when the total of 105,081 ha of forests were converted and set aside for palm oil plantations in the state. The combined estimates (of 10,791 to 17,069 and 50,000 ha) for the various years represent 10.26-16.24% between 2002 and 2006, coupled with 47.58% in 2007. At the same time, note that deforestation from oil palm plantations did intensify in 2003 and 2004 by 11,246 ha to 9,700 ha in the Akampa areas of the state (Table 10). While in 1907, Cross River’s total size of tropical rainforest stood at 436,747 ha (4,367.47 km²) [7], with the advent of oil palm estates in the state, the overall forest cover plummeted to 166,747 ha (1,667 km²). Table 10. Areas of rainforest Ecosystem Converted to Large-Scale Greenfield Plantations in Cross River State
 |
| |
|
3.2.2. Land Grabbing and Dislocation
Notwithstanding the gravity of deforestation as witnessed in the Cross-River state axis of the study area over the years, oil palm corporate plantations and local communities periodically engage in mounting duels prompted by land grabbing. Being the chief cause of land grabbing, the increases in oil palm plantation activities in Cross River state and the entire zone pose major risks to the landscape and the citizens through the surge in forest land loss, and the disappearance of species diversity. In the face of ensuing landscape disturbance and deforestation, community residents languishing in extreme poverty in the process, experience loss of livelihoods, landscape degradation, dislocation and forced exit. Further challenges encountered by local citizens dispossessed of their ancestral land encompasses deprivation of the socio-cultural and traditional benefits linked to the rainforest ecosystem. Besides, the ecological disturbance from these activities also impedes public health and welfare of the communities in the zone given the widespread use of pesticides and agrochemicals in the palm oil sector. Additionally, the full-scale loss of forest areas also stems from the pace, at which access to interior areas to speculators in search of oil palm investment opportunities, accelerated the breaches on protected habitats in a manner that left the communities in the zone worse off [3,24,27,7].
3.3. GIS Mapping and Spatial Analysis
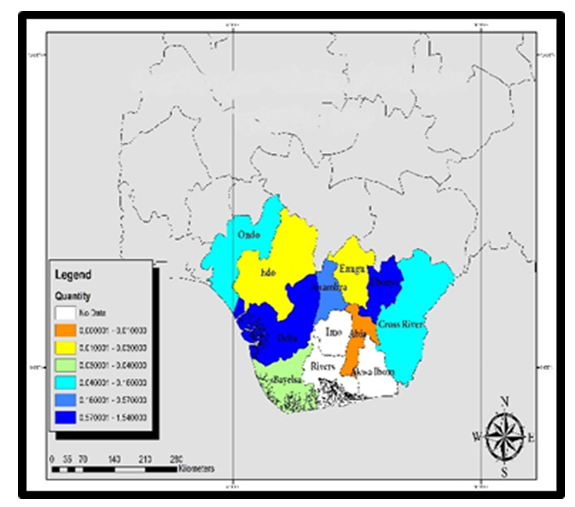
The geo visual analytics in this section displays the spatial patterns of changes in oil palm production and the volumes of agrochemicals. Of vital importance also are the oil palm farm types under the different production systems and the spatial dimensions of plantation induced deforestation in the zone.The geography of the changes in crude oil palm production among the 12 states in the Lower Southern Nigeria region involves two contrasting patterns of gains and declines. These are denoted by the plus and minus signs as indicated in the map’s legends under different colors from purple in the south west to green and pink in the south east and south-south between 2006 to 2008 and 2008 through 2010 and 2010-2012. While this implies that almost all states (11 of 12) in the study area saw insignificant increments of less than 1%. Only one state (Bayelsa) in the south -south or deep south in the former Eastern region in the negative column posted declines of -0.29% during 2006-2008. At that, the scale of gains among the remaining states in the zone points to a pattern which began in Ondo at 0.47% and Edo with 0.31%, followed by a slow move into the neighboring state of Delta. With that came a relatively higher concentration of clusters of indices of gains (0.54-0.55%) speckled throughout and around the South Eastern states (Anambra, Enugu, Ebonyi, Imo and Abia) in central portions of the map. At the lower side of the map in the Lower south-south or the South East emerges a trio of spots (Rivers, Akwa Ibom and Cross River) with soft gains in crude oil palm production with some presence in the old Oil River zones of Southern Nigeria’s Niger Delta region (Figure 2). During the 2008-2010 period when crude oil palm production plummeted slightly in percentage(s) across all the states in the zone, the patterns of declines under the -0.32 scale were visibly spread along the upper North west and Northside states in Edo, Enugu, parts of Anmabra and Cross River in yellow. In the same time, a sudden wave in configuration based on further losses of -0.31 in palm output appeared more among the states represented in blue. Such a vast spread as the map clearly indicates, took the center stage under visible dispersion from the oil palm farms in the south west state of Ondo to a couple of other plantations within other states in the middle like Delta, Ebonyi, Imo, Abia and Akwa Ibom in the old Eastern region. The other spots in space with contrasting indices of 0.34- 0.29% consists of Bayelsa and Rivers (Figure 3). These areas even though similar in patterns, do mimic isolated patches from the rest of the states as shown from the numbers in the legends during the fiscal years 2006-2008 and 2010-2012 (Figure 4).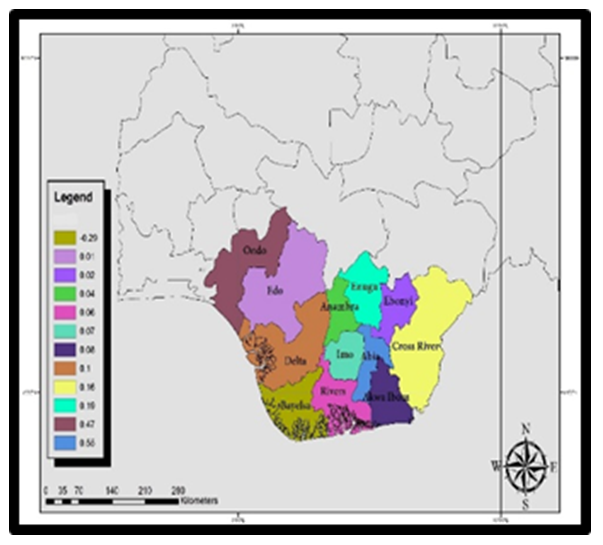 | Figure 2. Percentage of Changes in Palm Oil Production 2006-2008 |
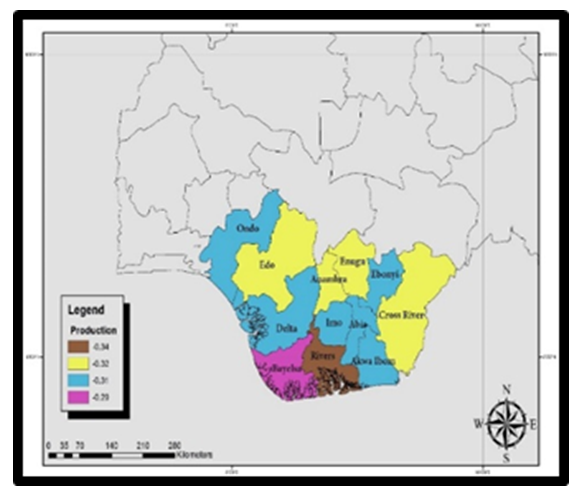 | Figure 3. Percentage Change in Oil Palm Production 2008 -2010 |
 | Figure 4. Percentage Change in Oil Palm Production 2010-2012 |
When it comes to spatial aspects of land areas devoted to oil palm production in three different production systems (wild groves and small and medium farm holders and plantations) in 2009 (Figures 5-7). The activities in the various farm categories under operation in vast areas of land are distinguished in applicable colors symbolizing their individual weights from high in the bottom to the low ones above. Thus, in the period 2009, the initial dominance in wild groves oil palm farms among the individual states showed full concentration in a quartet of states both in the old south eastern states of Cross River state and Akwa Ibom in yellow.In the same mix comes neigboring Imo, Abia and Rivers state. Besides the trends as manifested in the lower areas of the map, the prominence of oil palm areas under wild groves farms, stretches further up and down into the south west zone of Ondo and onto to Edo, Delta and Bayelsa in the new South-South under the colors of dark green, orange, purple and light green (Figure 5). Among the class of farm areas denoted as medium and small, the oil palm farms in the 5 states of the old Eastern region (Imo, Rivers, Abia, and Akwa Ibom and Cross River) have a major presence in terms of size of dominance than the others. With time, the network of these farm types stretched further under different scales into the South-South, and onto the Southwest through 4 neigboring areas made up of Edo, Delta, Bayelsa and Ondo (Figure 6). 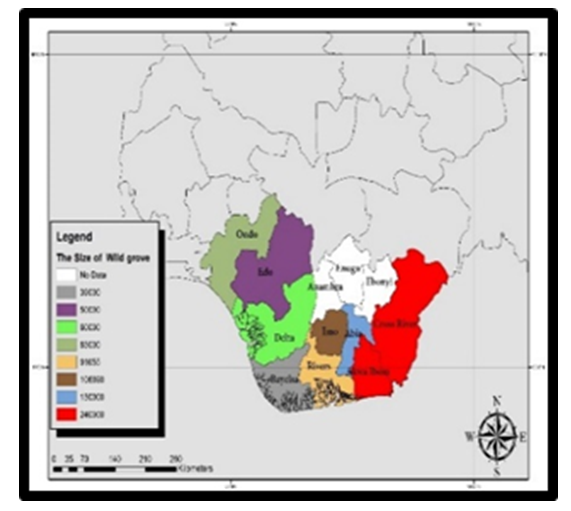 | Figure 5. The Wild Groves Areas In 2009 |
 | Figure 6. Size of Medium and Small Holders In 2009 |
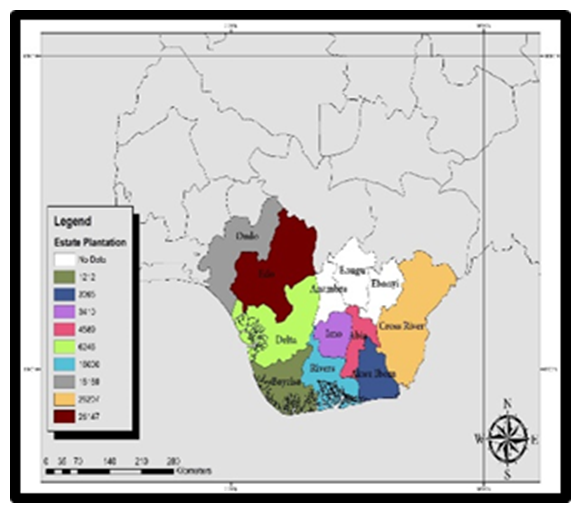 | Figure 7. Estate Plantations in 2009 |
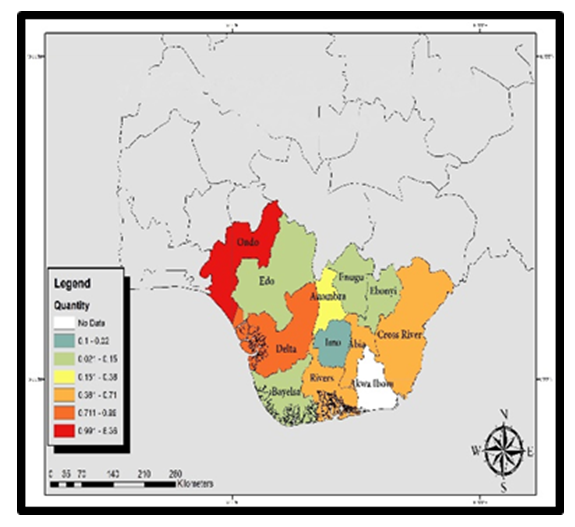
Elsewhere in the same period, the geography of estimated areas in palm oil estate plantations affirms the dominance of some states on different sides of the maps starting with Edo, Cross River, Ondo and Rivers in the South-South and South west. Among the medium types of estate plantations, the states of Abia, Delta, and Imo along the South east and old Mid-west denoted in purple, light and dark green showed much prominence in the evolving patterns in space in 2009. In the third cadre, emerges the convergence of neighboring Akwa Ibom and Bayelsa on the lower south portion of the map as presented in dark red and dark blue colors (Figure 7).In the same vein, the GIS mapping of the environmental impacts of fertilizer applications and other forms of agrochemicals to boost yield profiles more patterns, beginning with the quantity of nutrients used by farmers in the oil palm belt under different values from 2000 to 2006 (Figure 8-11). The geographic visuals as vital information on the volume of farm nutrients, reflects a measure of the extent to which the chemical indicators interact with the surrounding ecosystem. This involves the states where most oil palm plantations operate in Nigeria’s Lower South region, with implications on quality control requirements for producers. Considering that the leading states had corresponding scales of fertilizers applied therein, the maps showing areas in the Southern region where they are larger to medium quantities, captures the intensity and the spatial dispersion from the upper to lower portions of the zone. To that effect, the frequency of nutrient applications as overall indications of the intense use as gleaned from the maps, unveiled notable revelations. This implies that in the initial three periods (2000-2001, 2001-2002 to 2004-2005) as shown in Figure 8-10. Ondo state in the upper side along the south west zone and Delta state in the lower south were quite active as leading users of agrochemicals in the oil belt. When further disaggregated spatially among the individual states on the medium and minor tiers over time in 2000/2001. The patterns of nutrients usage among the oil palm farms shifts further to the neighboring South Eastern states of Imo and Cross River. Afterwards came a sudden emergence in Edo followed by a full convergence in the 7 states (Enugu, Edo, Rivers, Akwa Ibom, Anambra, Abia and Bayelsa) in the old Eastern Nigeria under different colors. In as much as the patterns in the later years (2001-2005) reflect the previous trends spatially, by 2005-2006, Delta state still stood out in space as the biggest user of fertilizers than its neighbors (Figure 11). As time went on, the current spatial patterns were further manifested during the fiscal year 2010, as Ondo Delta and Ebonyi states outpaced the others in the use of insecticides and herbicides (Figure 12-13).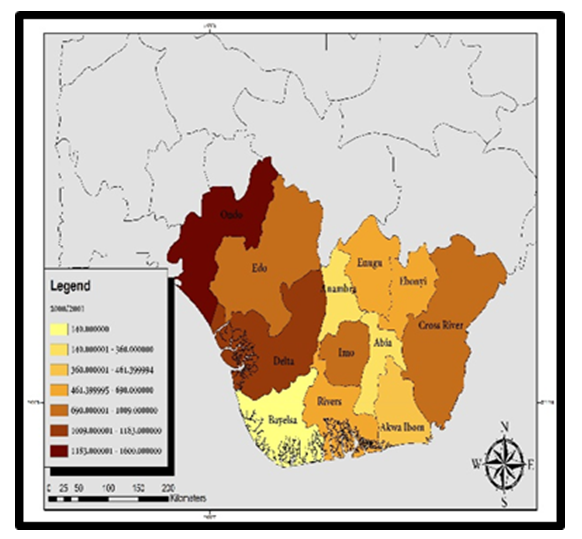 | Figure 8. Quantity of Fertilizer Use By State 2000/2001 |
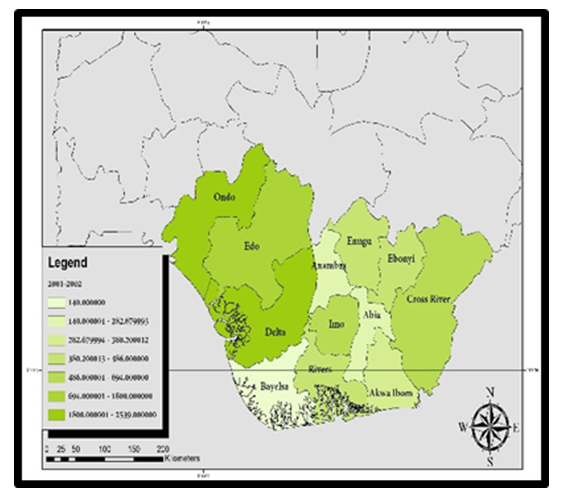 | Figure 9. Quantity of Fertilizer Use By State 2001/2002 |
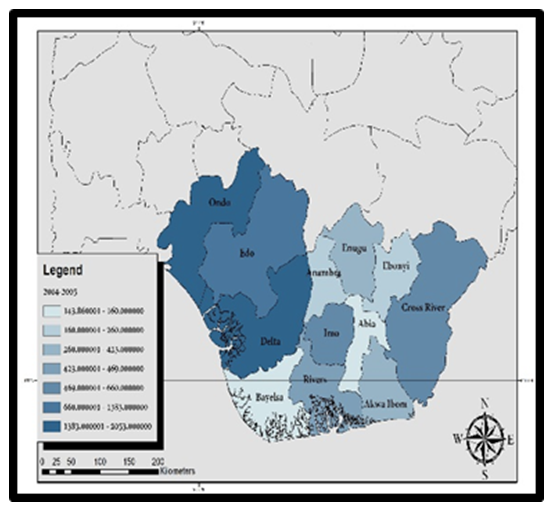 | Figure 10. Quantity of Fertilizer Use By State 2004/2005 |
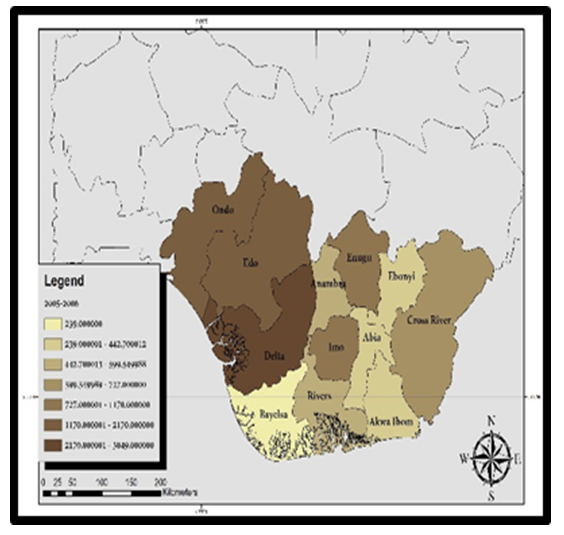 | Figure 11. Quantity of Fertilizer Use By State 2005/2006 |
 | Figure 12. Quantity Per Metric Tons of Herbicides By State 2010 |
 | Figure 13. Quantity Per Metric Tons of Insecticides By State 2010 |
The negative ecological footprints of oil palm production activities in the study area can be further buttressed in 1998 with the concentration in the Akamkpa/Odukpni areas in the South East and South west of Cross River state. This involved the conversion of 1270 hectares out of over 2000 hectares of forest habitats therein at that material time (Figure 14). Based on further evidence of renewed threats to biodiversity habitats in the study area over time. See the extent of other dimensions of environmental impacts as highlighted by the spatial distribution of unprecedented pace of deforestation under various scales amongst companies with holdings in the palm oil plantations all through 2002 to 2008 (Figure 15).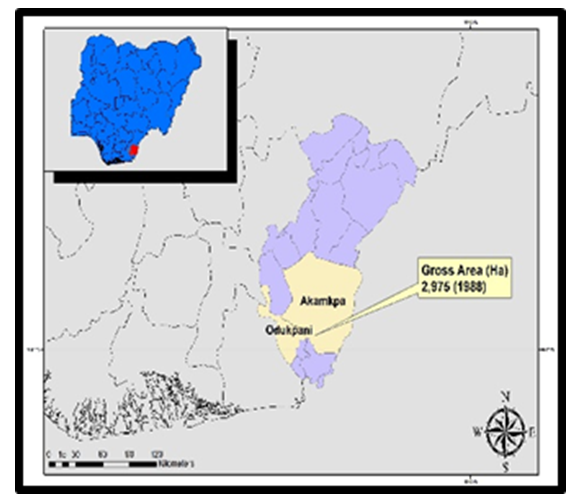 | Figure 14. Palm Oil Plantation Induced Deforestation in CRS, 1988 |
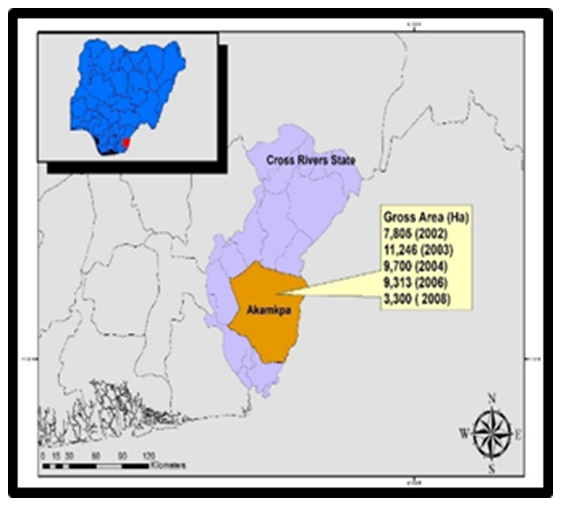 | Figure 15. Palm Oil Plantation Induced Deforestation in CRS 2002-2008 |
Considering the gravity and impacted spots in space, look no further than the Akampa Local Government Area in the South East part of Cross River state where forest land clearance for oil palm plantations resulted in the loss of large areas of forest habitats from 2002 through 2008 (Figure 15). In the earlier year in 2006 along the Ikom Obubara zone in the North West side of the state. Another large swath of forested land estimated at 7756 hectares vanished completely from an ecosystem under stress in the face of widespread activities among oil palm planters (Figure 16).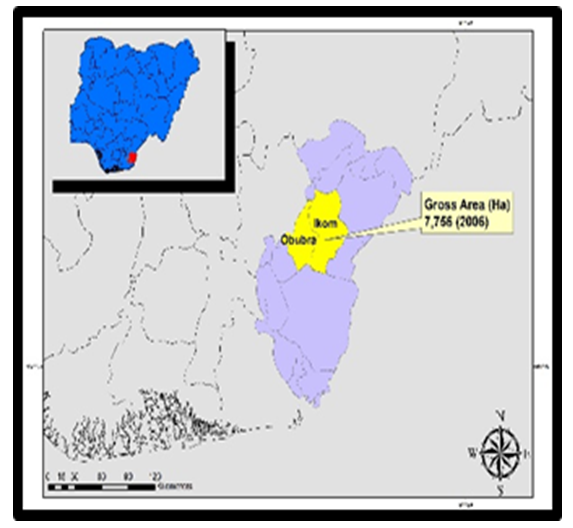 | Figure 16. Palm Oil Plantation Induced Deforestation in CRS, 2006 |
3.4. Factors of Change and Efforts
The ongoing changes in the core oil palm land use indicators are attributed to socio-economic, policy and ecological factors. While these elements are fully identified, herein in the ensuing subsections. The concerted efforts by the government to revive the oil palm sectors based on accelerated production and the expansion of cultivated areas and infusion of funding are also presented.
3.4.1. Economic Elements
Another dimension in the study stems from various factors shaping the activities of oil farm operations and the changes in landuse trends. In a country where agricultural activities continually languish miserably and unable to operate at full capacity as a result of lack of adequate access to credit facilities. The role of economic forces in shaping the current changes and trends in the oil palm sector in Nigeria’s lower South region remains obvious. Since the changes that emerged did not occur in isolation, a closer look at some indicators holds the key to unlocking the sudden turnaround and sluggishness in the sector in some of the years as manifested in the region. The initial thing that comes to mind revolves around the capacity of oil palm farms to garner funds from the money committed to 14 exportable crops that extends to palm oil. Given the tight economic climate under which most farmers operated, it came as no surprise that much of the money originated from personal sources, as very little came from friends, micro credit institutions and cooperatives. Operating successfully in those settings entailed dipping into individual reserves to finance a project. For that, the oil palm planters from Rivers topped the list of agri-businesses eager to maintaining a niche in the market through the infusion of N5.59 billion, while Edo and Cross River emerged as the second group given the N4.42-N4.63 billion committed to oil palm farming activities. Also, the evolution of farm gate prices and indices of the average world prices as a measure of the behavior of the markets seemed highly implicated in the changes in the oil palm sector in the study area. Beginning with the average farm gate prices of palm oil (N145.76, N121.69, to N79.06) during the three different periods 2010/2011, 2011/2012 and 2012/2013 in the region. When compared to the price of cashew at N71.22 as one of the common crops found in the zone. One could notice that oil palm activities in the states had the enabling environment to thrive successfully. The behaviour of these indicators over time due to fluctuations and spill overs from the volatility of international market activities, may have facilitated demands for the produce, hence the uptick in output of oil and palm oil land use in the sector all these years in a way that affected oil palm farms in the zone over time [42].
3.4.2. Population Changes
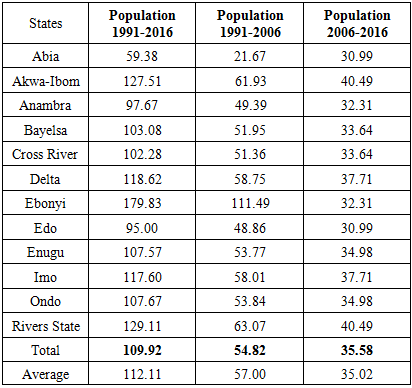
With the presence of densely populated areas, the number inhabitants as an overriding factor in the use of crude oil palm and land use changes over the years in the Lower south region cannot be ruled out. Being a place where oil palm output and land use changes in the sector coincided with a growing population. The preferences and tastes of such a teeming populace necessitated surge in daily consumption and use of the products in household cuisines and industrial sectors with some destined for export markets. The population of the zone under those circumstances still moved from over 26 million to 40 million plus by 1991 to 2006. This trend continued with a major leap to 55 million in 2016. Given the high population growth rate in the zone during the three different periods. The zone averaged changes at the rates of 112.11% to 57 and 35.02% in 1991-2016, 1991-2016 and 2006 to 2016 big enough to influence oil palm production activities. In as much as the overall state populations surged by over 100% in a span of almost 25yrs followed by 58.42-35.58% in the other years (Table 11). Meeting the demands and the tastes for oil palm products among such a teeming population required more production activities and the encroachment of plantations into fragile forests and natural areas. This occurred with maximum expansions into protected areas amidst the urge for continual supplies from the oil palm farms in Nigeria’s Lower region over the years. As a result, the pressures from such level of growth in population remains one of the biggest factors that drove changes in oil palm production and cultivated areas. Table 11. The Study Area and The Population Changes (%)
 |
| |
|
3.4.3. Policy Elements
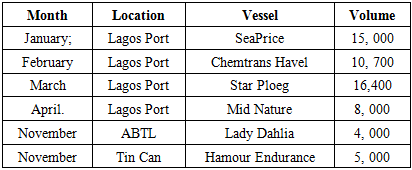
The existing policy on the one hand favors and undermines the sector in several ways. The problem remains compounded given the EU biofuel plan, which encourages the planting of palm oil trees and the snatching of lands. In that case, European operated oil palm estates are aggressively growing their operations in the country with no considerations for the impacts. For that, both Wilmar PZ based in Cross River state and Okomu operating in Edo state ignored mandatory environmental impact assessments and host community consent prior to their proposed expansions as stipulated in the corporate social responsibility clause. In addition to that, the likelihood of monetary returns, floundering political system, and the loopholes in the land tenancy scheme allows federal and state authorities to evade environmental considerations to the benefit of oil palm estates in shoddy negotiations. From another angle, there is also a growing demand at the global level considering the rise in output in the last decades in Asia, Europe and other countries in Africa that caught the attention of local producers. Seeing that oil palm crude is a sought after product for biofuel, domestic cooking and animal feeds and others, the demands has risen so much that countries like Nigeria are now exporters and this seems to be driving production. It is also noteworthy that even though during the 1960s, the oil palm industry accounted for substantial chunk of Nigeria’s export receipts. The surge in petroleum revenues during the late 1970s and the ensuing negation of agriculture turned disastrous for the oil palm industry. Even somewhat awkward, the nation became a dumping ground of palm oil, buying about 180,000 MT annually to sustain local consumption. To make matters worse in the context of ineffective policy, the info gleaned from the Nigeria Ports Authority indicated that large volumes of crude palm oil estimated at 58,409 MT were dumped into the port facilities in the Lagos area from foreign markets in 2012 [46]. See Table 12 for a breakdown of the unfair dumping practices. Nevertheless, the latest rise in palm oil production among some of the states stems also from a scramble to move the sector back to prominence. This is based on the prevailing policy and the active involvement of some of the states in the oil belt region. Accordingly, the governments of Edo, Anambra, Enugu and others have shown serious commitments towards the expansion of palm oil estates by dedicating large swaths of land areas to the industry. Table 12. Volume of Crude Palm Oil Discharged or Dumped On to The Shores of Nigeria In 2017 in Tonnes
 |
| |
|
3.4.4. Ecology and Physical Characteristics
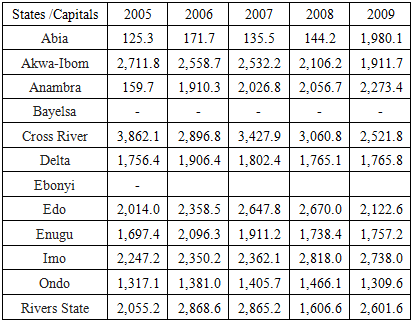
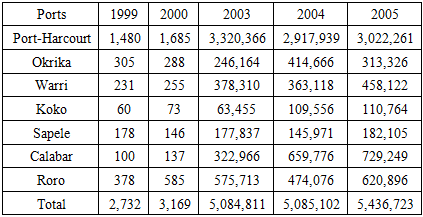
The Ecology of the South-eastern and South-South states associated with palm oil production is such that while they are usually located in the Lower South region of the country with favorable conditions for production such as temperature and climate and rainfall. These physical conditions as essential ingredients for viability in the cultivation and management of palm oil farms remained instrumental in the sudden surge in production as witnessed. The resurgence in output could not have been possible without the sort of climatic conditions in the native area where palm oil trees originated from. Being the wettest region in Nigeria, the dose of heavy precipitations in the zone may have indirectly aided the growth of cultivated palm trees in various farms spread across the states from Akwa Ibom to Rivers state and others all through 2005-2009. Among the major producers and key states that are crucial in the region in the sector. The average annual rainfall stayed frequently heavier (31,538.88-2503.10 cm) in a handful of states (Table 13). This includes heavy precipitations in the moist forest areas in Cross River state and Imo at levels suitable to the operations of oil palm farms. Whereas Rivers, Edo and Akwa Ibom and the other states took in over 23,000 cm-and below 2000 cm in annual rainfall in 2005 to 2009. The velocity of such heavy rains in these areas was quite essential in the resurgence of the sector. Added to that, are the vast network of water transportation infrastructure in most ports and terminals in the lower south that are valuable in the movement of export goods destined to overseas markets essential to the delivery of palm oil crude between 2005 through 2009. In fact, over the years, the volume of exported goods through the major ports in the region from Porth Harcourt, Calabar, Sapelle, Warri and others remained steady. See Table 14 for the breakdown on export goods from the ports with relevance to the movement of palm oil cargos.Table 13. Annual Rainfall In Nigeria By State 2005- 2009
 |
| |
|
Table 14. The Movement of Export Goods Through Nigerian Port Terminals 1999-2005
 |
| |
|
3.4.5. Efforts to Revive the Oil Palm Sector in the Region
In terms of ongoing initiatives related to the sector, the Central Bank of Nigeria (CBN) has shown commitment towards making Nigeria the number three global source of crude oil palm [33,46]. Should that happen, Nigeria stands to surpass the South East Asian nations of Indonesia, Malaysia Thailand, and Columbia as the key crude oil palm producers in the globe. In driving home the point during a meeting with investors in the palm oil sector recently. Nigeria’s Central Bank CBN chief noted the nation’s overall goal to surpass its immediate competitors in ranking in the years ahead [47]. The CBN position further states that, had the nation followed the common practice of her competitors in sustaining new approaches towards oil palm farming based on the present international market cost of $600 per tonne and supposed output level of 16m tonnes. The nation might have brought in around $10bn in hard foreign currency. This assessment herein does not factor in potential employment opportunities and other figures that could accrue Nigeria’s countryside where corporate oil plantations and small farms operate. To that effect, the CBN has called for better access to credit facilities for small farm operators under the auspices of the Bankers committee charged with overseeing recommendations tied to sustainable financial schemes for oil palm and host of other farm crops. Since access to the appraised 3 million hectares of land and the large swaths of fertile land for the sector’s revival requires the assistance of state authorities in the oil palm cultivating Lower south region especially the South-South and South East [48]. The authorities in the zone have also promised to provide land access valued at 100,000 hectares from the states for financiers with monetary and tech capacity to spur growth in large and small farm operators in oil palm estates in the nation. Other efforts worthy of mention includes the moves in Abia where the authorities shared around oil palm seedlings at no cost to farmers, villagers, government employees and schools for cultivation. The belief is that such initiatives will optimize output by lessening the importation of palm oil [49], while the sector moves towards a more sustainable path devoid of ecological degradation [50].
4. Discussion
The analysis of the evolving trends in oil palm farming activities in Nigeria’s lower south region represents major milestone primed for deeper insights in the nation’s ecological-economic profile shaped mostly by three different experiences. In as much as it presents a trio of circumstances that one should never lose sight of, note that from the results of the analysis carried out in this enquiry. Oil palm produce is associated with a glorious past imbued with unprecedented dominance in international export of the crop during an enviable era out of the Lower South region. There is also the other phase that reflects a waning influence in the sector. Since the events at that time seemed mostly self-inflicted under changing circumstances that kept production interrupted for decades. The current phase as critical juncture of resurgence adds to a reawakening in the country through an awareness of the inherent potentials of the former oil river zone as the frontier of oil palm crude. This is as manifested with the growing production capacity and the ecological costs amidst mounting challenges. Aside from that, undoubtedly, there are still vast capacities in output waiting to be unlocked. Thus, the fact that the path towards modern Nigeria’s involvement in commodity trading under the orbit of international capital go through the supply chains that shaped crude oil palm flow into foreign markets in the past. To some degree, such experiences do reinforce the entrepreneurial spirit of local producers who ensured the emergence of Nigeria as chief food producer in west Africa. Being a region that once dominated over half of global trade in the crop, the analysis of the trends and move towards revival remains timely. Accordingly, this study used a mix scale method based on the techniques of GIS and descriptive statistics and secondary data to assess oil palm agricultural land use operations in the states in Nigeria’s Lower South region. The focus centered on the issues, trends, factors, impacts and efforts of institutions and future lines of action. From what transpired in the zone over the years regarding production capacity in oil palm from 2006 through 2010, the entire Lower South region not only set aside significant land area estimated at over 4000 thousand hectares for the crop, but the trend continued with more than 3000 thousand metric tons (TMT) in output. In that order of activities, under those land use indicators, the region maintained relative averages of 1103 hectares to 854.8 TMT during the same periods. Worthy of note in all these, is the dominance of neighboring Akwa Ibom and Imo State in the former Eastern region where the size of their land areas and oil palm output levels outpaced the others. Furthermore, given the vast potentials of palm oil plantations across the zone. The temporal distribution of each of the core oil palm land use indicators among the remaining states stayed at relatively identical levels over the years, even though quite a few numbers of states were on the medium scale in terms of rankings. Considering the presence of oil palm plantations under multiple production system activities in 2009, among the states in the Lower South, especially in oil palm groove farms. The quartets of states, all in the defunct Eastern region held more proportion of areas. This affirms also the high production capacity proportions of the former Eastern region consistent with the activities in oil palm sector of Nigeria between 1961-1965. Considering that variability in the oil palm production and areas devoted to the cultivation of the crop are linked to a whole set of elements located within the larger agricultural structure of Nigeria. Look no further than the various factors made up of socio-economic theme, policy and demography together with ecological and physical parameters in fuelling the changes as witnessed over the years in the region. For that, it is no coincidence under the policy realm as to how the EU biofuel plan prompted the cultivation of oil palm trees with aggressive pursuit of production activities among EU consortiums in the Southern region. Moreso, Nigeria’s incoherent policy framework and porous ports has done little to check the illegal dumping of smuggled palm oil onto local ports to the detriment of producers in the region during the 2017 fiscal year. Added to that, the negligence of agriculture in the country in favor of oil and gas helps explain the lack of support for oil palm cultivators in a setting where petroleum products stand as the leading export commodity. In those conditions, meeting the needs of consumers in local markets bustling with teeming population, exerted pressures on oil palm output and planted areas with more nutrient applications, even though the moist Lower South ecosystem supports the cultivation of the produce as manifested with changes in key land use variables over time.With that also came visible environmental impacts as manifested with deforestation, loss of biodiversity and land grabbing incidents leading to the expulsion of indigenous people in rural areas out of their ancestral lands. Realizing that the proportion of forest cover loss within oil palm producing areas of the nation hovers at over 6%. The deep encroachment of oil palm plantations estates into fragile natural areas in the Cross-River state axis of the zone, resulted in further conversion of forest land areas to oil palm productions between 2002 through 2012. There is also the growing incidence of land grabbing activities involving cooperate entities in the oil palm sector. This is pitting them against the indigenes in standoffs with local communities in the face of deforestation and the loss of biodiversity. Besides that, current efforts by the Federal government to revive the sector, and lift it back to the pre-war prominence, involves the injection of capital, and donation of land areas for cultivation and an action plan to optimize productivity of oil palm in the Lower South. With the results showing firm levels in production and areas under cultivation among the leading states in some years, coupled with gains and declines in oil palm land use indicators in the region and the concentration of higher rankings in some areas. The states in the former Eastern region remained the dominant areas in oil palm farm activities in the study area. The GIS mappings pinpointed the dispersions of various patterns involving oil palm land use and production indicators clustered across multiple states together with the concentration of various ecological stressors most notably deforestation and agrochemicals spreading into handful of spots in space over time. To mitigate these issues, the paper offered some suggestions ranging from improved farm policy towards the oil palm sector, community participation, and corporate social responsibility and the design of a regional oil palm information system to remedy the situation.
5. Conclusions
This study focused on an assessment of oil palm farming activities and the impacts in Nigeria’s Lower South region with significant results listed in the following rubrics: a) The Lower South has great potentials; b) Palm oil in abundance; c) Changes evident in land use indicators; d) Mix scale methods effective; e) Changes linked to many elements; f) Ecosystem impacts evident).Part of the core outcomes of this research stems from the abundance of oil palm in Nigerians lower south zone. Notwithstanding, the nation’s global ranking of number 7 among producers of the crop with an output of over 900,000 MT between 2013 through 2014. With the cache of opportunities in place, there exists enormous production potentials in the country when it comes to oil palm farming that convinced authorities to inject around $500 million dollars to turn the sector around, mostly in the study area. Considering the roots of the Lower South region of the country as the locus of international agricultural trade in the tradition of the famed “oil river” legacy and as catalyst for development and the frontier for the world’s best oil palm crude. The lower south region’s palm oil belt in the coastal rain forest has continued to thrive impressively. This began with the notable surge in the early and the mid-1960s when it dominated in every statistical category associated with consumption and production capacities of the crop throughout Nigeria. In that period, the old Eastern region accounted for the highest tonnages in crude palm oil, as the new states out of the defunct region are now doing. Presently, there is an ongoing scramble to revive the region’s potential as well. Under an ambitious plan by the Central Bank of Nigeria to optimize output, better lines of credit to oil palm farms has been proposed in order to increase future output to 16 million tonnes in the global markets. The expectation is that the crop will generate $10 billion annually in government revenues via international exports. For that, about 3 million hectares of land have been assessed for cultivation with commitment of each state in the producing areas to make 100,000 ha available to investors in the sector. In highlighting these potentials, this research showed novel approach towards the revival and future of the sector.The visible abundance of oil palm in the Lower south consists of the zone’s totals in the major land use variables which stood at over hundreds of thousands of hectares (400,000 ha to 340,000 TMT), in the size of land areas and the volume of crude oil palm respectively from 2006 to 2010 fiscal year. In as much as, the region posted notable averages 1103.4 ha-854.8 TMT in palm oil land areas and production. At the state level, both Imo and Akwa Ibom accounted for the largest proportions in core land use indicators pertaining to production and cultivated areas. Within the same time, (2006 to 2010) in which Akwa Ibom maintained an average of around 164.45 hectares in oil palm land set aside for cultivation together with the 128.45 MT in production. The trend elsewhere includes averages of 154.6 ha to 114 TMT in both land areas and output for Imo state. Among the array of farming activities in various production systems, the study area contained over 1million hectares of land areas covered by palm oil wild groves farms. The farm type composition in the region are also characterized by both medium and estate fields covering hundreds of thousands of hectares throughout nine states in the zone by 2009. In presenting these indicators, the study affirmed its relevance as a decision support tool to guide regulators and planners on matters pertaining to oil palm farming. The other major twisting to the interesting findings that unfolded in the enquiry revolves around the extent and form of changes in the lower south region regarding the temporal distribution patterns of the size of areas cultivated with palm oil trees and the actual production volumes all through 2006 to 2012.Under such a scenario, a common changing pattern characterized by a mix of gains and deficits of which the only complete losses in the core oil palm indicators occurred in the fiscal year 2000-2010. The cultivated areas and production were in the uptick much of the time except with the sudden split of 8 to 4 among the states in 2006 to 2008 when the majority of the producing states (8) accounted for the gains in proportion in land areas despite a regional average of -1.36% during the periods. Notwithstanding the relative stability in terms of declining levels in both land areas and output proportions in the periods 2008 to 2010 as manifested in the ensuing loses in the entire 12 states under a regional average of -0.89 to -0.31%. In the following periods 2010 to 2012, came a complete change with a combination of high double digits and single digit gains among the individual states under regional percentage changes for cultivated areas and production estimated at 7.67 to 9.50. Pinpointing these variabilities and the profile of the crop not only serves as a major contribution to crude oil palm analytics, but it provided the pathway towards the design of a regional crude oil palm index and information system.Using descriptive statistics and GIS components of the mixscale model as working tools added more insights to the assessment of oil palm farming activities. The model was quite effective in identifying the trends, factors, efforts, and ecosystem impacts and change. Accordingly, the use of descriptive statistics in that way showcased the capacity of the technique to identify the level of oil palm production and cultivated areas, consumption and production systems within the individual states in the zone with changes in the form of gains and deficits and the proportions over time along with the environmental liabilities of oil palm farming. From the extent to which GIS mappings indicated the geographic patterns of oil palm production and the size of various farms. The model injected a valuable touch in visualizing the spatial concentration in the volume of different farm types made up estate plantations, size of small farms, volume of medium farms and clusters of areas where the proportion of agrochemicals including fertilizers and herbicides remained intact. Other visual coverages also pinpointed plantation induced deforestation in the impacts within the Cross-River state axis in the Lower South. With the uses in mapping analytics and impact assessment of oil palm farming in Nigeria’s Lower South, GIS exhibited complete promise in displaying the scale of ecological risks and the pace of their dispersion. Highlighting these perils helps refocus planning in areas where land grabbing and degradation through deforestation are persistent. In that way, the enquiry added an ecological protection dimension. This is critical in detecting risks in an ecosystem already over stretched by stressors from oil palm farming. Keeping affected communities abreast as was done herein, lowers the risks to their welfare. The level of production activities and oil palm farmland use changes in Nigeria’s Lower South region as presented in the enquiry come from many socio-economic and ecological factors consistent with policy, population and environmental characteristics. Despite the lousy economic policies of the past especially the post war period. The key fiscal indicators beginning with privately generated fund, the rising farm gate prices for oil palm crude and proceeds from export, fluctuated in recent times amidst teeming population and high market demands for the produce among consumers. The emergence of oil palm tree as the most sought-after bioenergy produce that attracted the attention of policy makers in both Europe and other places stands also as a contributing force. The sudden re-emergence as dictated by market and policy forces has catapulted oil palm trade once again to the forefront of global and national prominence. This not only drives production capacity, but it coincides with the favorable policy and enabling environment involving seedlings distribution and other incentives towards the sector coordinated from the national to regional and state levels. Consequently, the state authorities in the oil river zone have also shown commitment towards the resurgence of the sector through the expansion of oil palm estates. The attributes of these indicators as a result of the forces driving international export requirements boosted the demands for the crop and related products, hence the surge in the production of crude palm oil and cultivated land areas over time in a manner that influenced the activities in the industry. The ecology of the Lower south region as moist tropical coastal zone possesses the essential ingredients such as temperature, rain fall and fertile land area conducive for the growth and planting of the oil palm crop that were contributory to the increments in the output as witnessed in the area over the years. As the most water-soaked zone in the country, the barrage of frequent storms and down pours from 2005-2009 were extraordinarily heavier throughout the leading areas in the Lower south states than other parts of the country, that it accelerated the production and tillage of oil palm farming. All these elements in this enquiry can influence current discourse with new ideas. The study not only reiterated the importance of these factors in the region’s oil palm farm operations, but it indicated how they are shaping the sector. Clearly stated, the effects of the activities of oil palm plantations on the Lower South ecosystem remains very clear. With the sector responsible for over 6% deforestation rate throughout the country. The ecology of the Cross-River state axis of the study area has endured far bigger damages over the years with implications in both the built and natural environment rooted in human-nature interface. To that extent, Cross River state has seen widespread pace of deforestation prompted by the spread of estate farming particularly oil palm operations into fragile portions of the local ecosystems. Considering the environmental and social liabilities from such activities. Since the last century, the state has seen much of its forest cover disappear from the activities of oil palm agricultural operations. Even at that, the oil palm induced degradation has gone unabated with intensive clear cutting that ravaged the tropical rain forest habitats in the area to make way for oil palm plantations from the late 1940s to 1979 and continued deep into the 1980s and the 2000s. With time, the intensification of corporate owned plantations in the 1980s, further exacerbated the situation. These increased activities amounted to the disappearance of thousands of hectares of large forest land areas which enabled the cultivation and harvest of palm trees and the production of crude palm oil with a heavy devastation of the tropical rain forest ecosystem and loss of biodiversity. While the size of forest cover in the area have plummeted by over 1000 km2 since the operations of oil palm plantations, the incidence of corporate land grabbing for cultivation has further accelerated the dislocation of peasants, proliferation of agrochemicals, entrenchment of poverty, threats to biodiversity and protected areas. With the current awareness of the ecological costs of oil palm plantations in the communities and the way it has resonated in the fore front of policy discourse, stakeholders will turn to this enquiry for focus and remedy. Thus, the study in that way remains timely, in raising the alarm over deforestation, degradation, and displacement of indigenous people in the Lower South region of Nigeria.Consequently, decision makers and scholars will seek urgent responses to the relevant questions raised in this enquiry. The questions are: which form will oil palm farming activities assume? How will indigenous people’s rights in land tenure policy be protected? What critical indices will be needed to assess land use? What role will oil palm estates play in the revitalization of the sector? How can we evaluate current moves to increase future output and what are the likely ecological impacts? In these questions, there is opportunity to bring the sector back to prominence and refocus oil palm production approaches in a manner rooted in sustainability, equity and ecosystem stability.
Appendix
Table 4. Estimated Area Under Oil Palm In The Different Production Systems On A State Basis In The Niger Delta, 2009
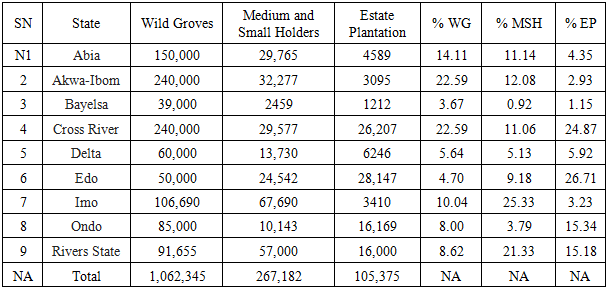 |
| |
|
Acronyms
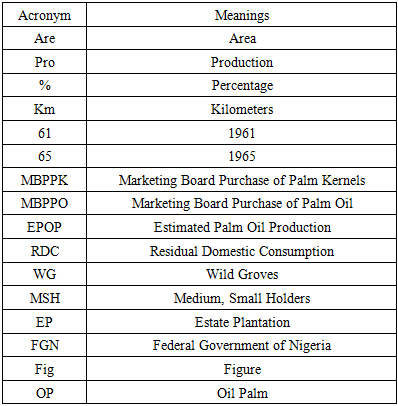
References
| [1] | Amazing Village Editor. (2017). Palm Oil Plantations Changing Southern Nigeria: One of Africa’s Most Promising Oil River. Amazing Village. Abuja, Fed Territory NGA. |
| [2] | Adetola, Samuel (2019). Nigerian Institute of Food, Science and Technology. Palm Oil Importation: A Strategic Stabiliser for Palm Oil Industry in Nigeria. Oshodi, Lagos State, NIFST. |
| [3] | Ojo GU (2017 August). Oil Palm Plantations In Forest Landscapes: Impacts, Aspirations and Ways Forward in Nigeria. Wageningen, the Netherlands: Tropenbos International. |
| [4] | The Economist (2020). Food Sustainability Index: Palm oil and Deforestation. The Economist Newspaper Limited. Intelligence Unit. |
| [5] | Union of Concerned Scientists. (2016 January). Reports and Multimedia/Explainer: Palm Oil. Cambridge, MA. |
| [6] | Proshare Intelligent Investing. (2018). Fact File on Crude Palm Oil (CPO) in Nigeria, Cote d’Ivoire and ECOWAS. Ikeja, Lagos: Nigeria, Proshare. |
| [7] | Editorial Board. (December 2017). Editorial Opinion. As Nigeria spends N116b on palm oil import Guardian. https://guardian.ng/opinion/as-nigeria-spends-n116b-on-palm-oil-import/. |
| [8] | Asemota, Omerefe. (2012). Overview of the Oil Palm Sector in Nigeria. Benin City, Edo: Nigerian Institute for Oil Palm Research. |
| [9] | Offiong, Ayama. Raphael. (2017). A Historical Review of Oil palm Plantations and Forest Loss in Cross River State Nigeria. Wageningen, The Netherlands. Tropenbos International. |
| [10] | Akhaine, Odion Sylvester (2017). The state, people and oil palm production in Nigeria: Understanding The Policy Nexus. Wageningen, The Netherlands. Tropenbos International. |
| [11] | Henders, S. (2015). Trading Forests: Land Use Change and Carbon Emissions Embodied In Production and Exports of Forest-Risk Commodities. Environmental Research Letters. 10:12. |
| [12] | Vijay, V. (2016). The Impacts of Oil Palm on Recent Deforestation and Biodiversity Loss. PloS One. 11:7. |
| [13] | May-Toben, C. (2014). Deodorant, Deforestation: Scoring America’s Top Brands on Their Palm Oil Commitments. Cambridge, MA: The Union of Concerned Scientists. |
| [14] | Laurance W.F. (2010). Improving The Performance of The Roundtable on Sustainable palm oil for nature conservation. Conservation Biology.; 24(2): 377–81. pmid:20184655. |
| [15] | Kwasi, Poku. (2002). Small-Scale Palm Oil Processing in Africa. Rome; Italy. FAO Agricultural Services Bulletin 148. Publishing Management Service, Information Division. |
| [16] | Gaworecki, Mike. (2016 November). Global Palm Oil: Seven African Countries Pledge To Protect Their Tropical Forests From Unsustainable Oil Palm Development. Mongabay Series. |
| [17] | James, Sherry. (2015 July). Palm Oil Market To Reach $88 Billion By 2022. Grand View Research, Inc. |
| [18] | AgroBusiness Times. (2017 December). Nigeria’s Palm Oil Import: How NIFOR Failed On Its Mandate. AgroBusiness Times. |
| [19] | Okon, Anna. (2018February). Malaysia, Importers Move Against Nigeria’s Palm Oil Market. Punch. |
| [20] | Oten, Ita Bassey. (2016 March). Overview of Oil Palm Production In Nigeria; Comparative Social and Environmental Impacts; The Case of Ekong Anaku Community In Cross River State, Nigeria. Rotterdam, The Netherlands: Institute of Social Science, Erasmus University of Rotterdam. |
| [21] | Global Palm Oil Magazine. (2014). Importing Palm Oil, Nigeria Loss N20 Billion. Global Palm Oil Magazine. |
| [22] | Baiyewu-Teru, Abiodun. (2017). Social Impacts and Gender Imbalances Related To Oil Palm In Nigerian Forest Landscapes. Wageningen, the Netherlands: Tropenbos International. |
| [23] | Allen, Fidelis. (2017). NGOs, CSOs and Academia: Capacity Gaps and Advocacy Surrounding Expansion Of Oil Palm Plantations In Nigeria. Wageningen, the Netherlands: Tropenbos International. |
| [24] | Ojo Godwin, Uyi. (2017). Background Review Oil Palm In The Wider Landscape and Threats to Nigeria’s Forests. Wageningen, the Netherlands: Tropenbos International. |
| [25] | GRAIN. (2019 September). Communities In Africa Fight Back Against The Land Grab For Palm Oil. Barcelona Spain. GRAIN. |
| [26] | Friends of the Earth. (2015 July). Nigeria Palm Oil Land Grab Exposes Need For Human Rights Treaty. Friends of the Earth International Secretariat, Amsterdam: The Netherlands. https://www.foei.org/news/nigeria-palm-oil-land-grab-exposes-need-human-rights-treaty. |
| [27] | Akpan, Anietie. (2018 August). Nigeria: Local communities Accuse Wilmar of Land Grabbing and Pollution Associated with Palm Oil Cultivation; Co. Rejects Allegations: The Guardian/ Business & Human Rights Resource Centre. |
| [28] | Oyongha, Missang. (2013) Communities in Nigeria Take Wilmar to Court for Land Grabbing. Washington, D.C. Rainforest Resource and Development Centre. |
| [29] | Gurden, Burag. (2017 September). The Palm Oil Crisis In Nigeria - and Beyond. The Ecologist. |
| [30] | Anyang Best Complete Machinery Engineering Co. (2019). Optimal Business Plan of Palm oil Processing Mill In Nigeria. ABC. http://www.palmoilmillplant.com/related-products/palm-oil-processing-mill.html. |
| [31] | Gharlegh, Behrooz. (2013 Jaunuary). The Economic Importance of Crude Palm Oil In Nigeria. International Journal of Management Sciences and Business Research. 2: 1:81-85. |
| [32] | Moulds, Josephine. (2015 January). Palm Oil Risk To Africa As Prospectors Eye Swaths Of Land. The Guardian Weekly |
| [33] | Chiejina, Nduka. (2019 March). CBN Vows To Make Nigeria World’s Third Palm Oil Producer. The National. https://farmlandgrab.org/28815. |
| [34] | Butler, Rhett. (2019 June). Global Palm Oil Nigeria Plans 8-fold Increase In Palm Oil Production.Mongabay Series. |
| [35] | Merem, E. C. (2019). Analyzing Land Use and Change Detection in Eastern Nigeria Using GIS and Remote Sensing. American Journal of Geographic Information System. 8(2): 103-117. |
| [36] | Merem, E. C. (2017). Analyzing rice production issues in Niger state area of Nigeria’s middle belt. Food and Public Health, 7(1), 7-22. |
| [37] | Merem, E. C. (2017). Assessing ecosystem liabilities of oil and gas activities in southern Nigeria. Public Health Research, 7(1), 3-26. |
| [38] | Merem, E. C. (2019). Regional Assessment of Climate Change Hazards in Southern Nigeria with GIS. Journal of Safety Engineering, 8(1): 9-27. |
| [39] | Merem, E. C. (2006). GIS and remote sensing applications in the assessment of change within a coastal environment in the Niger delta region of Nigeria. International Journal of Environmental Health and Public Health, 3(1), 98-106. |
| [40] | Merem, E. C. (2006). Hydropolitics: Case of the Niger River Basin. GIS Development: Africa, 24-28. |
| [41] | Merem, E. C. (2018). Appraising Variations In Climate Change Parameters Along The Lower West African Region. Journal of Safety Engineering, 7(1), 1-19. |
| [42] | Merem, E. C. (2020, February). The Analysis of Palm Oil Production and Land Use In Nigeria’s Lower South Region. 29th Joint Conference of National Association of African American Studies (NAAAS). Dallas, TX. |
| [43] | Merem, E.C. (2018). Regional Assessment of Climate Change Hazards in Southern Nigeria with GIS. Proceedings of 26th Annual AEHS Conference. San Diego: California. March 2018. |
| [44] | Iyayi, F. (2004). An Integrated Approach to Development In the Niger Delta. Lagos: Nigeria The Centre for Democracy and Development (CDD). |
| [45] | Ozor, N. (2010 June). Barriers to Climate Change Adaptation among Farming Households of Southern Nigeria. Journal of Agricultural Extension. 14: 1:114-124. |
| [46] | Akinfenwa, Gbenga. (2018 February). Declining Palm Oil Production, Yet Another Drawback On Economic Diversification. Guardian. |
| [47] | Olurounbi, Ruth. (2019 June). Nigeria Plans to Invest $500 Million to Boost Palm Oil Production. Bloomberg. |
| [48] | Vanguard. (2018) FG Spends N90m On Oil Palm Processing Factory In Imo. Vanguard. |
| [49] | Okon, Anna. (2019 August). Palm Oil Imports Gulp N504bn In Five years. The Punch. |
| [50] | Hood, Marlowe. (2018 June). Palm Oil Decimating Wildlife, Solutions Elusive: Report. Physorg/Science X. |

 Abstract
 Reference
 Full-Text PDF
 Full-text HTML