-
Paper Information
- Paper Submission
-
Journal Information
- About This Journal
- Editorial Board
- Current Issue
- Archive
- Author Guidelines
- Contact Us
International Journal of Ecosystem
p-ISSN: 2165-8889 e-ISSN: 2165-8919
2015; 5(4): 108-115
doi:10.5923/j.ije.20150504.03
Comparative Levels of Water and Air Pollutants in Kigali City and Kitabi and Benefits of Cleaner Energy-Biodiesel in Rwanda
 Abstract
 Reference
 Full-Text PDF
 Full-text HTML
Jean Baptiste Nduwayezu1, 2, Theoneste Ishimwe1, Ananie Niyibizi1
1Institute of Scientific and Technological Research (IRST), Butare, Rwanda
2African Forest Forum (AFF), Nairobi, Kenya
Correspondence to: Jean Baptiste Nduwayezu, Institute of Scientific and Technological Research (IRST), Butare, Rwanda.
| Email: |  |
Copyright © 2015 Scientific & Academic Publishing. All Rights Reserved.
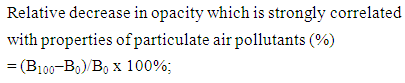
To compare both levels of water and air pollutants in Kigali city and Kitabi and benefits/disadvantages of the fuel types (gasoline, diesel and biodiesel) that are used in Rwanda, a parallel study on water and air pollution was conducted in Kigali city and Kitabi-Nyamagabe District during the January-July 2013 period. All vehicles entering Kigali City via Giticyinyoni, Nyacyonga, Gahanga and Rugende axes and the total number of motor vehicles in Rwanda were recorded. Carbon dioxide (CO2), carbon monoxide (CO), unburned hydrocarbons (HC) and opacity are the main emissions parameters measured at the Rwanda National Police Motor-vehicle Inspection Centre. The air quality parameters measured include HCl, NO2, NO3, SO2, H2S, TVOC, O3, CO and CO2 while quality of rain water harvested from the study sites was determined by measuring pH, conductivity, total dissolved solids, turbidity, biochemical oxygen demand, organic matter, sulfates, aluminum, copper, iron, manganese, cadmium, chromium, lead, sodium, and oils and grease. Kigali capital city suffers tremendous pressure of increasing population accompanied with the rapid increase in the number of vehicles which emit 526327.1 tons of CO2 year-1, 18405.5 tons of CO year-1 and 354967.0 m3 of unburned hydrocarbons year-1. Using 100% biodiesel reduced emission of CO by 50% and opacity by 76.9%, while using a 50% biodiesel blend or biodiesel-diesel mixture (B50) reduced CO by 35.2% and opacity which is strongly correlated with properties of particulate air pollutants by 71%. In Kitabi area, HCl, N02, TVOC, 03, CO2, NO3, SO2 and CO were reduced by 76.6%, 54.6%, 74.8%, 72.7%, 100%, 100% and 100% as compared with Kigali city respectively. Levels of acidic air pollutants (SO2 and NO2) are negatively correlated with rain water acidity (pH) levels (SO2: r = 0.787; NO2: r = 0.734) implying, therefore, that atmospheric deposition of strong acids or acidic pollutants lowers the water pH levels or increase water acidity. Reductions in atmospheric deposition of strong acids and other toxic pollutants may result in some improvements in the acid-base status of some water bodies which can lead to increased growth conditions for various organisms. The use of cleaner energies (i.e. biodiesel) therefore, may be a practical option of controlling emissions or managing air pollution causes. More detailed studies, however, are needed to determine the contribution (quantitative and qualitative) of each source of pollutants to both air and water pollution in Rwanda and identify other key emission control measures to be undertaken. Also efficiency of photosynthetic process of trees that are commonly planted in Kigali city needs urgent investigation.
Keywords: Cleaner energy, Biodiesel, Fossil fuels, Pollutants, Water, Air, Biodiesel benefits
Cite this paper: Jean Baptiste Nduwayezu, Theoneste Ishimwe, Ananie Niyibizi, Comparative Levels of Water and Air Pollutants in Kigali City and Kitabi and Benefits of Cleaner Energy-Biodiesel in Rwanda, International Journal of Ecosystem, Vol. 5 No. 4, 2015, pp. 108-115. doi: 10.5923/j.ije.20150504.03.
Article Outline
1. Introduction
- Water which makes up to 60-95% of the total weight of any functioning living cell [1], is one of the most important substances upon which human life and indeed all life on earth depends [2-6]. Water covers about 70% of the Earth's surface [4, 7, 1] but it has been estimated that about 97% of this water is salt sea water, 2% is frozen in glaciers and polar caps and only 1% of the world's water supply [4] is available for human consumption. Apart from being a source of life for humans, animals, plants and other living organisms, water also plays an important role in the world's major sectors of economy including agriculture, forestry, fishing, mining, energy resource extraction, manufacturing and construction, transportation and trade, electric power production and public water supply [3, 5].It is generally accepted that access to clean, safe water improves education, health, hunger, poverty and economic growth. However, considerable evidence showed that nearly 1 billion people in the developing world [5], at least 320 million people in China [7] and 51% of the population in Rwanda [8] don't have access to clean, safe drinking water, about 700 million people globally drink contaminated water and more than 3000 children die every day all over the world due to consumption of contaminated or polluted drinking water [7]. Typhoid, cholera, dysentery, polio and hepatitis are the most common water-related illnesses accounting for almost 60% of early childhood deaths worldwide [6]. These common water-borne diseases (i.e. hepatitis, cholera, dysentery and typhoid) affect large populations in the tropical regions [9]. In sub-Saharan Africa, it is estimated that 800,000 of children under five die from diarrhea per year [10] while in Rwanda, 16,700 deaths are attributable to diarrheal diseases caused by unsafe water [11]. Pollution or contamination of natural water bodies like lakes, rivers, streams, oceans and ground water (water pollution) is mainly caused by industrial wastes (e.g. heavy and toxic metals, asbestos, lead, mercury and petrochemicals), sewage from domestic households, factories and commercial buildings, effluents and solid wastes from various industries and municipalities, use of toxic chemicals, pesticides, insecticides and fungicides, oil spills from tankers and oil from ship travel, burning fossil fuels, organic wastes and plant nutrients and human litter [7, 12, 9, 13, 14, 15]. Different types of water pollutants affect marine ecosystems, wildlife health and human wellbeing [7, 12] in different ways, and their effect may either be additive, synergistic, antagonistic or even independent from each other [16]. A wide range of studies on pollution and its effects on health and ecosystems confirmed the existence of a close link between atmospheric deposition of mercury (Hg), strong acids and other toxic pollutants and water pollution [17-27]. Pollutants in water bodies that may originate in part from atmospheric sources include nitrogen compounds (NOx: NO + NO2), sulfur compounds (SO2), mercury (Hg), pesticides, and other toxics [28]. Mercury is a very toxic substance that poses a health risk to both humans and wildlife [24]. Most mercury pollution originates from atmospheric emissions [19] as a result of the combustion of fossil fuels (e.g., electric utilities), industrial processes, and incinerators [24]. Once mercury enters the environment or water bodies, it may be converted to the more bioavailable deadly form, methyl-mercury (MeHg) which is absorbed by fish and anything that eat the fish [29, 30]. In the United States, consumption of fish is the primary pathway for exposure of humans to MeHg [24]. Hydrologic conditions, lake acid–base status, changes in sulfate (SO4-2) and dissolved organic carbon (DOC) water column concentrations have been reported as important controllers of fish mercury (Hg) concentrations [31, 32, 33]. The intimate relationship between mercury and the sulfur cycle was confirmed by some workers suggesting that SO4-2 stimulates net mercury (Hg) methylation in lacustrine sediments [31]. Sulfates (SO4-2) amendments to soil [34], lakes and wetlands [35, 36] increased MeHg production. Studies from Isle Royal lakes [25], however, suggested that reductions in SO4-2 deposition alone could explain decreases in Hg concentration in fish tissues. A significant decrease in wet SO4-2 deposition to the Adirondacks (U.S. New York State) has occurred over the last two decades in response to reduced sulfur dioxide (SO2) emissions as mandated by the 1970 and 1990 Amendments of the Clean Air Act (CAAA) [37, 38]. In acid-sensitive areas like the Adirondacks, acidic deposition was reported to mobilize elevated concentrations of aluminium (Al) from the soil to drainage waters [17, 23]. While the aluminium (Al) concentration was found to be negatively correlated with lake water pH (acidity), the non-labile (organic) monomeric aluminium was on the other hand, positively correlated with lake water dissolved organic carbon [27]. Change in lake water dissolved organic carbon (DOC) concentration was also reported to be positively correlated with changes in both mercury (Hg) and methyl-mercury (MeHg) concentrations [27] implying, therefore, that aluminium (Al) may also affect MeHg binding on dissolved organic carbon (DOC) [18]. From their spatial surveys across eastern North America, researchers have reported a negative correlation between concentrations of mercury in fish tissues and lake pH [39, 40, 32] suggesting, therefore, that improvement in the acid-base status of waters (increasing the lake water pH or reducing water acidity and lowering aluminium concentrations) may lead to an increase in fish conditions in acid-sensitive waters [41, 27]. Considerable evidence showed that controlling atmospheric emissions may result in increased reductions in water pollutants and improved health and environment. In the United States for example, controls on emissions of sulfur dioxide (SO2) have resulted in reductions in precipitation and surface water sulfate (SO4-2), and some improvements in the acid–base status of some Adirondack lakes [22, 23]. In the Little Rock Lake (WI, USA) yellow perch (Perca flavescens) mercury (Hg) concentration decreased by 30% in response to decreased atmospheric Hg deposition and in part due to decreased SO4-2 deposition [21]. Studies in 42 remote Swedish lakes revealed that northern pike (Esox lucius) Hg concentrations declined by 20% as wet mercury (Hg) deposition declined by more than 50% [20]. Since 1990, the US anthropogenic emissions appear to have decreased by 38% largely due to controls on medical waste incinerators and municipal waste combustors [27].Although there has been some Government efforts aiming at conserving and protecting the environment (e.g. establishment of the Rwanda Environment Management Authority) [19] and improving health (e.g. improving access to safe water and sanitation services, etc.) in Rwanda [8], the existing evidence shows that pollution is a serious threat which requires immediate action if we are to assure our present and future generations of a quality life and living environment. However, information pertaining to air pollution, air pollutants dispersion, water pollution, link between atmospheric emissions and water pollution, appropriate ways of managing these pollutants and benefits of cleaner energies is very little if not lacking in Rwanda. The main objective of this study, therefore, was to compare both levels of water and air pollutants in Kigali city and Kitabi and benefits/disadvantages of the fuel types (gasoline, diesel and biodiesel) that are used in Rwanda.
2. Materials and Methods
2.1. Study Site Description
- This study was carried out in Kigali City (Latitude: 1° 57’ 13” S; Longitude: 30° 3’ 38” E; Altitude: 1567 m a.s.l; Average temperature: 20.5°C; Average humidity: 39%; Pressure: 1021 mbar; Rainfall: 1007 mm) and Nyamagabe District (Latitude: 2° 24’ 29” S; Longitude: 29° 28’ 5” E; Altitude: 2237 m a.s.l; Average temperature: 18°C; Rainfall range: 1300-1450 mm; humid tropical climate moderated by the effect of high altitude) during the January-July 2013 period.
2.2. Sampling, Data Collection and Analysis
- (i) Samples for rain water quality determination were collected from Kigali (Gitega), Kitabi Tea Factory and Nyamagabe Meteorology Stations. Water quality was analyzed using standard methods at the Kigali Water Laboratory of the National University of Rwanda, Faculty of Science-Department of Chemistry. Conductivity, pH, total dissolved solids, turbidity, biochemical oxygen demand, organic matter, sulfates, iron, manganese, aluminium, copper, cadmium, chromium, lead, sodium, oils and grease are among the water parameters measured. (ii) The concentrations of air pollutants at Kitabi Tea Factory and the Rwanda National Police Motor-vehicle Inspection Centre (Kigali) working places were measured using Gray_Wolf-Advanced_ ense HVAC Environmental Test Meter.(iii) The biodiesel (EN14214 European Standards) used in the present study was produced at the Institute of Scientific and Technological Research (IRST) Laboratory of Biodiesel and Bioethanol using the Swedish Biodiesel Processor PE 2000.(iv) A structured questionnaire/datasheets and interviews were used to determine the total number of vehicles found in Rwanda and those residing in Kigali City as well as the number of vehicles entering the city via four axes of Nyacyonga, Giticyinyoni, Gahanga and Rugende. Exhaust emissions were measured at the Rwanda National Police Motor-vehicle Inspection Centre using MAHA MGT 5 Emission Tester for gasoline vehicles and MAHA MDO 2 LON Emission Tester/Opacimeter for diesel vehicles. The annual quantities of CO, CO2 and unburned hydrocarbons (HC) emitted by vehicles in Kigali city was determined using standard methods. (v) The following equations to compare vehicular emissions (i.e. emissions by gasoline, diesel and biodiesel vehicles) were adopted from [42] and [43]: Relative decrease in CO and Opacity emissions using pure diesel and biodiesel and biodiesel-diesel mixtures (biodiesel blends) and air pollutants/contaminants were calculated as follows:
 | (1) |
 | (2) |
 | (3) |
 | (4) |
 | (5) |
3. Results and Discussions
3.1. Levels of Water and Air Pollutants in Kigali City and Kitabi
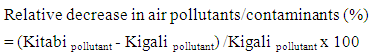
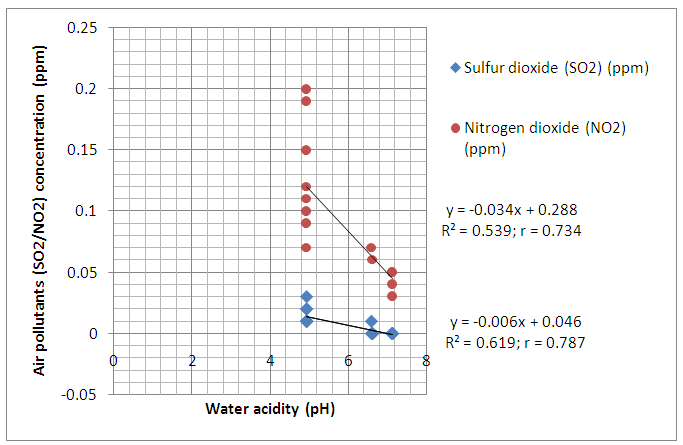
- Kitabi shows remarkable reductions in air and water pollutants as compared with the capital city of Kigali with pH being in the normal range (6.5-8.5) for surface water systems at Kitabi while Kigali waters are acidic (pH < 6.5). The concentrations of HCl, NO2, TVOC, O3, CO2, NO3, SO2 and CO in Kitabi were reduced by 76.6%, 54.6%, 74.8%, 72.7%, 100%, 100% and 100% as compared with Kigali city respectively. As illustrated in Figure 1, levels of acidic air pollutants (SO2 and NO2) are negatively correlated to water acidity (pH) levels (SO2: r = 0.787; NO2: r = 0.734) implying, therefore, that atmospheric deposition of strong acids or acidic pollutants lowers the water pH levels (increasing acidity) which agrees well with some arguments suggesting that the level of pollution in the water supply is directly related to the level of pollution in the air [20, 21]. The lower the water pH, the more acidic it is. This relationship is also in agreement with studies suggesting that controls on emissions of sulfur dioxide (SO2) have resulted in reductions in precipitation and surface water sulfate (SO4-2), and some improvements in the acid–base status of some Adirondack lakes in the United States [22, 23]. Acid rain was reported to be the best example of a direct link between air pollution and water pollution [48, 17, 23, 37, 38, 27]. Acidic gases (NOx and SOx) emitted into the air combine with water in the air to form sulfurous and nitrous acids which then fall as rain or snow to contaminate water in rivers and lakes by decreasing the pH [48]. The acidic water leaches metals out of the rocks and sediments as soluble ions which increase levels of heavy metals (e.g. arsenic and lead) in the water [48]. Acid rain also causes aluminium to leach from the soil into water [47, 17, 23]. This probably explains the high levels of aluminium (Table 1) found in Kigali waters as compared with Kitabi, which is in line with earlier reports suggesting that acidic deposition mobilized high concentrations of aluminium (Al) from the soil to drainage waters in acid-sensitive areas like the Adirondacks [17, 23].
 | Figure 1. Relationship between air pollutants levels and acidification level of rain water harvested from the Meteorological Stations located in Kigali City and Kitabi/Nyamagabe District |
|
3.2. Effect of Cleaner Energies on Air Pollution
- Kigali capital city suffers tremendous pressure of increasing population accompanied with the rapid increase in the number of vehicles. A total of 65286 vehicles were recorded in Rwanda with 70% of the total national fleet (29663 diesel vehicles + 16037 petrol/gasoline vehicles) being found in the capital city of Kigali where an average of 1535 vehicles from other Provinces also enter daily via Gahanga, Rugende, Nyacyonga and Giticyinyoni. All these vehicles contribute to pollution of both water and air in the city of Kigali by emitting 526327.1 tons of CO2 year-1, 18,405.5 tons of CO year-1 and 354967.0 m3 of unburned hydrocarbons year-1. The emission test results from a representative sample of 1002 vehicles examined at the Rwanda National Police Motor-vehicle Inspection Centre revealed the superiority of biodiesel over gasoline and diesel fuels that are commonly used in Rwanda. Using 100% biodiesel reduced emission of CO by 50% and opacity by 76.9% while using a 50% biodiesel blend or biodiesel-diesel mixture (B50) reduced CO and opacity by 35.2% and 71% respectively. This clearly demonstrate that cleaner energies can play an important role in improving both health and our living environment by reducing pollutants. These results are also in line with those from other studies suggesting that use of biodiesel reduced the exhaust emissions of sulfur by 100%, CO by 48%, CO2 by 78.5%, particulate matter by 30-47%, total hydrocarbons by 93%, 1-nitropyrene by 90% and the ozone (smog) forming potential of biodiesel by hydrocarbons by 50% as compared with petroleum diesel [50-54]. Other workers also showed that on average the biodiesel blend (B20) caused particulate matter (PM), CO and unburned hydrocarbons emissions to be reduced by 16%, 17% and 12% relative to petroleum diesel respectively [55]. Based on the observed close link between levels of acidic air pollutants (SO2 and NO2) and water acidity (pH) (Figure 1), other reported linkages between pH and various water and air parameters and the above emission reductions attributable to cleaner energy (biodiesel), it can be noted that reducing atmospheric deposition of strong acids using biodiesel or biodiesel blends may result in improved water acid-base status. This implies, therefore, that the use of cleaner energies (i.e. biodiesel) may also be a practical option of controlling emissions or managing air pollution causes.Water pollution was also reported to cause air pollution through evaporation of volatile water pollutants [56] which further confirms the existence of a close linkage between air and water pollution. The link between air, water and soil pollution was also confirmed by some workers suggesting that acid rain resulting from the reaction between sulfur dioxide in the air and atmospheric water lead to increased soil acidity (i.e. lowered soil pH levels) and elevated levels of sulfate in ground water [57].
4. Conclusions and Recommendations
- • Using pure biodiesel (B100) or biodiesel blends (B50) results in increased reductions in air pollutants. The use of cleaner energies (i.e. biodiesel) therefore, may be a practical option of controlling emissions or managing air pollution causes. • Levels of acidic air pollutants (SO2 and NO2) are negatively correlated with water acidity (pH) levels implying that increased atmospheric deposition of strong acids or acidic pollutants may result in lowered water pH levels (i.e. increased water acidity). • Prevention and monitoring of pollution, adequate treatment of waste waters and water conservation are also among other key measures for improving air and water quality in the densely populated city of Kigali.• More detailed studies, however, are needed to determine the contribution (quantitative and qualitative) of each source of pollutants to both air and water pollution in Rwanda and identify other key measures to be undertaken. • Also efficiency of photosynthetic process of trees that are commonly planted in Kigali city needs urgent investigation.
ACKNOWLEDGEMENTS
- The Rwandan Government and the Institute of Scientific and Technological Research (IRST) are greatly acknowledged and appreciated for their financial assistance in undertaking this research work. Authors are also grateful to the Rwanda National Police and National University of Rwanda for their technical support in measuring exhaust emissions and laboratory analysis of water respectively, and the Management of Kitabi Tea Factory and Nyamagabe District for their assistance in the field work.