-
Paper Information
- Paper Submission
-
Journal Information
- About This Journal
- Editorial Board
- Current Issue
- Archive
- Author Guidelines
- Contact Us
International Journal of Ecosystem
p-ISSN: 2165-8889 e-ISSN: 2165-8919
2015; 5(3): 75-79
doi:10.5923/j.ije.20150503.01
Bioclimatic Conditions of Urban Residents through Deteriorating Ecosystem Practices in an Emerging City of Nigeria
 Abstract
 Reference
 Full-Text PDF
 Full-text HTML
Ifatimehin Olarewaju Oluseyi1, Ismail Nuhu Adeiza1, Balogun Moses2
1Department of Geography and Planning, Kogi State University, Anyigba, Nigeria
2Department of Urban and Regional Planning, Kogi State Polytechnic, Lokoja, Nigeria
Correspondence to: Ifatimehin Olarewaju Oluseyi, Department of Geography and Planning, Kogi State University, Anyigba, Nigeria.
| Email: |  |
Copyright © 2015 Scientific & Academic Publishing. All Rights Reserved.
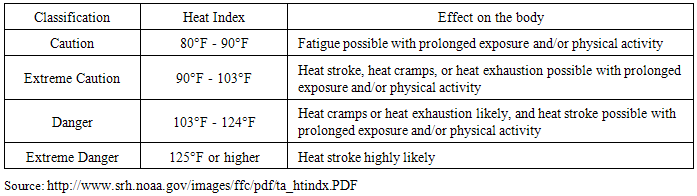
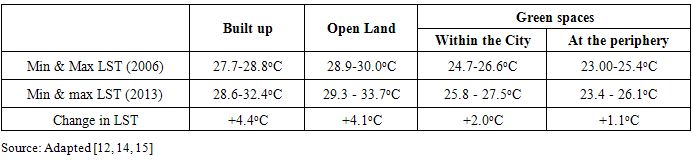
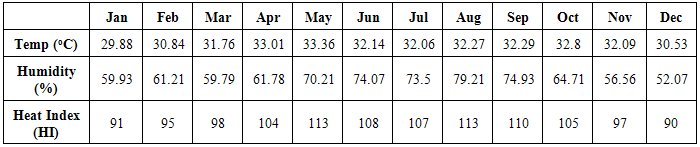
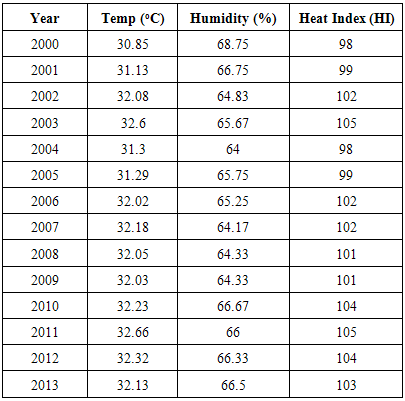
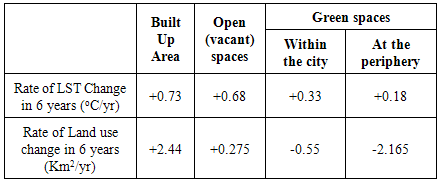
The increase in impervious and non evaporative surfaces, emission of heat and greenhouse gases at the detriment of rapid vegetation decline results in the significant thermal differences in urban environment. However, Anyigba town is seriously witnessing this trend in its landscape like any other urban area. Therefore, In situ temperature and humidity data from the year 2000 to 2013, Landuse types and Land surface temperature data of 2006 and 2012 were collected from published works. Monthly and Yearly Heat indexes for Anyigba town were calculated using the Bioclimatic Heat Index Calculator. The heat index chart placed Anyigba town in two different thermal discomfort zones - Extreme caution and Danger. From the months of November to march falls within the extreme caution zones while the months of April to October falls within the danger zones. The years 2003, 2010, 2011, 2012 and 2013 all falls within the danger zones this is as a result of unprecedented increase in urbanization and conversion of land uses from vegetation and green spaces to built up and vacant lands. The built up area increases at the rate of 2.44km2/yr and the LST at 0.73C/yr while green spaces within the city and at the periphery are depleted at the rate of 0.55km2/yr and 2.165km2/yr respectively. Anyigba town is becoming hotter daily as the ecosystem is undergoing modification daily. The discomfort levels can be reduce if the ecosystem can be improve upon though increase in green space per capita, enforcement of planning laws and proper documentation of vulnerable assets.
Keywords: Green spaces, Vacant land, Discomfort, Heat index, Built up, Land surface temperature
Cite this paper: Ifatimehin Olarewaju Oluseyi, Ismail Nuhu Adeiza, Balogun Moses, Bioclimatic Conditions of Urban Residents through Deteriorating Ecosystem Practices in an Emerging City of Nigeria, International Journal of Ecosystem, Vol. 5 No. 3, 2015, pp. 75-79. doi: 10.5923/j.ije.20150503.01.
Article Outline
1. Introduction
- In this era of rapid urbanization and emergence of cities in both developed and developing countries, a lot of environmental resources are consumed and depleted unsustainably. The economic opportunities, prevailing lifestyles and consumption pattern in cities had greatly impacted negatively on the environment [1]. The combined effects of land use conversion (loss in vegetal covers, increase in impervious and non evaporative surfaces) and emission of heat and Green House Gases (GHG) from anthropogenic activities (Cooking, Cooling, industry, electricity and vehicular) contributes significantly to thermal differences between the urban and rural environment, where the urban is more warmer than the rural and giving the cities it microclimate as Urban Heat Island (UHI) manifest [1].The UHI effects as it relates to high surface temperature in the night time is also witnessed during the daytime [2]. The associated high temperatures in cities have negative consequences to human health and well-being [3-5], and also attributed the quality of urban outdoor spaces to public health, psychology and economy as the urban residents are exposed to this thermally stressful outdoor environments when performing their economic and recreational activities [6]. The higher the level of discomfort among the urban residents, the higher the activities of the proponents hindering the effective benefits derived from green spaces in the city [7, 8]. The urban thermal comfort is one of the sub-indicators of Ecological conservation in measuring the level of impact of urban development through Micro-level Urban-ecosystem Sustainability Indicator Composite (MUSIC) [9] and also as urban microclimate analysis tool for sustainable urban development (Wong et al., 2012).The elevated levels of temperature and moisture (humidity) among others can be used in measuring the Heat index values of urban environment [10].The main objective of the paper is to ascertain the change in microclimatic conditions and the resulting thermal discomfort associated with the change.
2. Methodology
2.1. Study Area
- Anyigba, a University town in Nigeria located on latitude 715’ – 729’N and longitude 711’ – 732’ E. The university town has attracted commence, knowledge, innovation and physical development to its surrounding and responsible for rapid growth of its population from 44,271 in 2000 to 172,468 in 2012 [11, 12]. The University town falls within the tropical wet and dry (Aw) climatic region and the guinea savanna.
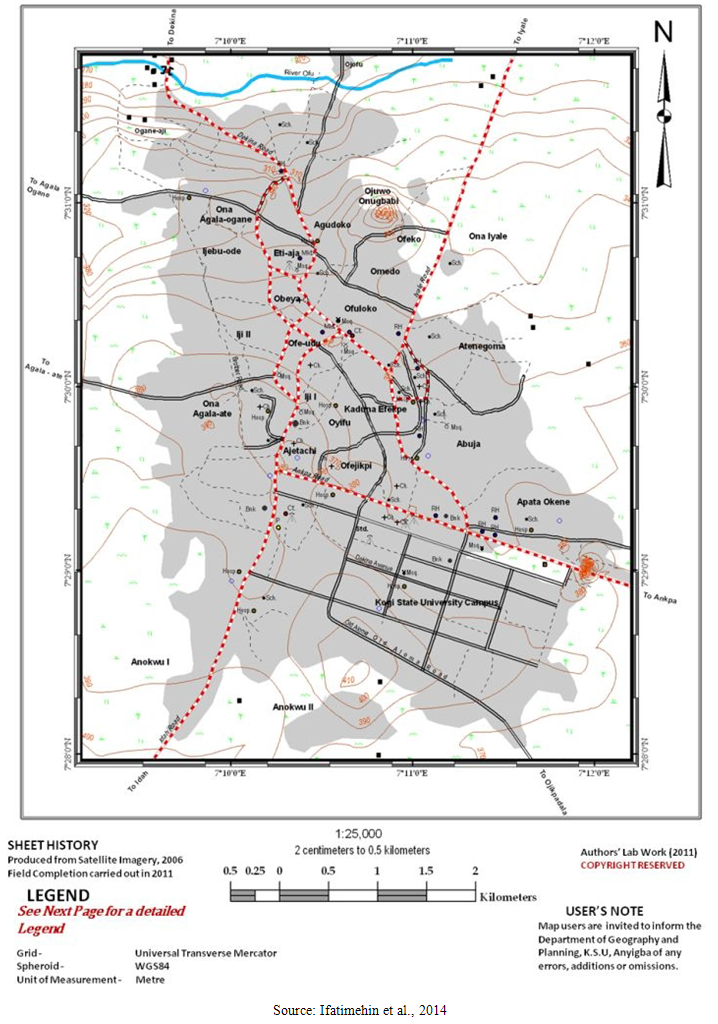 | Figure 1. Anyigba |
2.2. Materials and Methods
- In situ temperature and humidity data from the year 2000 to 2013 were collected from the University Weather Station and the Centre for Lower Atmospheric Research in Anyigba, Kogi State. Published data on Landuse types and Land surface temperature of 2006 and 2012 were also sourced. The Bioclimatic Heat Index Calculator with the formulae expressed below was used in calculating the monthly and yearly heat index (HI) using the temperature and humidity data. The Heat Index chart was used for the interpretation of the calculated heat Index
 | (1) |
|
3. Results and Discussion
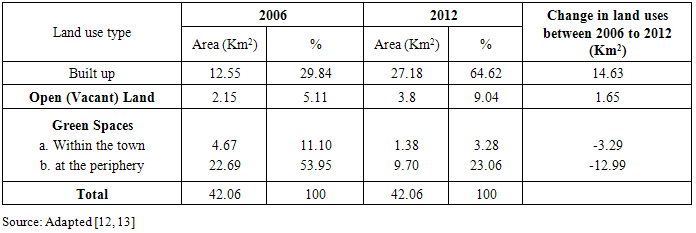
- The Land use of types of Anyigba had really transformed from 2006 to 2012 as built up had increased with about 14.63km2 while green spaces (within the town and at the periphery) depreciated at about 16.28 km2 (Table 2). This indicated a high level of transformation of green spaces land use to other land uses especially to built upand vacant land.
|
|
|
|
|
4. Conclusions and Recommendations
- The implication of the above scenario is on the well-being of the residents as valuable assets of the town are unsustainably depleted. if allow to continue in this manner (Business As Usual) for a targeted year in time, Urban heat island effect will surely takes its toll on the residents. Therefore, there is the need to employ strategic action plan and sustainable approaches to restoring green spaces. The impact of However, the following are recommended:1. Increase in Green spaces per capita should be encourage;2. Enforcement of planning laws;3. Increase in trees per capita should also be encourage;4. A proper documentation of the vulnerable assets as a result of the impended hazards of flood and heat waves should be done.5. Sidewalks and bicycles should be encourage to reduce the increasing dependent on a two wheeled motorised cycles for intra urban movements.6. An alternative source of energy be encourage so that the use of generators by majority of the households will be reduced.The immediate solution to these impending double tragedy from both thermal discomfort and flood is to scale down on and prioritised actions/strategies that are have both adaptive and resilience capabilities at this micro level.