-
Paper Information
- Next Paper
- Paper Submission
-
Journal Information
- About This Journal
- Editorial Board
- Current Issue
- Archive
- Author Guidelines
- Contact Us
International Journal of Ecosystem
p-ISSN: 2165-8889 e-ISSN: 2165-8919
2014; 4(6): 239-245
doi:10.5923/j.ije.20140406.01
Detection of Eco-Diversity Ipomaea carnea in Different Habitats Using DNA Fingerprint
 Abstract
 Reference
 Full-Text PDF
 Full-text HTML
1Botany Department, Faculty of Science, Benha University, Benha, Egypt
2Botany Department, Faculty of Agriculture, Ain Shams University, Cairo, Egypt
Correspondence to: Shehata M. N., Botany Department, Faculty of Science, Benha University, Benha, Egypt.
| Email: |  |
Copyright © 2014 Scientific & Academic Publishing. All Rights Reserved.
Random amplified polymorphic DNA (RAPD) fingerprints were used to analyze somaclonal variations in Ipomara carnea plants in different habitats. The frequency of somaclonal variation was found to be soil dependent. The leaves impression of Ipomaea carnea plants in different habitats were studied with respect of the phenotype and DNA fingerprint to differentiation between them. The somata size, number and epicutical were regulated in two patterns, which reflected different habitats when 11 and 20 somata per square leaf area. The cellular hairs were different between Ipomaea carnae plants growing in arid and hydric plant soils (3.5, 7.3); (250.5; 257.2 μm) and (4 and 7) as average number, length and number of cell/ hair per square (0.200 mm2) of leave area. Ipomaea carnae plants are represented in arid and hydric soils as fructicuse shrub of 1.5 to 2.5 and 1.80 to 4.5 m height, 1 to 2 and 1.5 to 2.5 cm stem diameter, it is grow erect leaf black with black with 5 to 11 cm long and 4 to 7 cm broad of arid soil while 5 to 10 and 5 to 8 cm long and broad respectively in hydric soil. It is ovalelanceolate in shape, its apex is acute and the base is shallowly coroate. RAPD-PCR analysis showed genetic variations in approximately 4% among two types of plants. It was observed also that all morphologically abnormal shoots showed genetic variations at the molecular level. Only four RAPD primers (among 15 tested) were chosen as producing polymorphic DNA fragments differentiating the investigated Ipomaea carnea plants. Although minor morphological variations were recorded in the leaves of Ipomaea cornea.
Keywords: Plant habitat, Soils, RAPD-PCR, Phenotype, Genetic variation
Cite this paper: Shehata M. N., Ashour H. M., Detection of Eco-Diversity Ipomaea carnea in Different Habitats Using DNA Fingerprint, International Journal of Ecosystem, Vol. 4 No. 6, 2014, pp. 239-245. doi: 10.5923/j.ije.20140406.01.
Article Outline
1. Introduction
- Ipomaeacarneais a member of the family convolvulacea, a family of about 51 genera and 1600 species, mostly in the tropics but with several representation in American tropics ranging from Argantina. To the south state. The plant was grown in xeric dry rock, banks of lakes, and hydric conditions rivers and as components of floating islands in the pontanal (Frey, 1995). Ipomaeacarnea is not represented in the Egyptian wild flora. However, it has been recorded by El-Sheikh (1996) as naturalized species long canals drains, read sides, wasteland and field edges in Nile Delta region of Egypt. During our periodical excursions, it was observed that this plant is among the distinctive species of saline soils.Somaclonal variation has been widely documented in tissue culture raised plants at morphological, chromosomal, vuicgemical and molecular levels in many plant species and extensively reviewed (Karp, 1991 and El-Dougdoug et al 2007. Polymorphism at DNA level among the somaclonal familiar which phenotypically normal was reported in strawberry (Geafar and Saker, 2007) in Populus deltoids (Vijolyet al 1995).Therefore, this study was conducted to employ RAPD-PCR analysis as simple molecular markers for the analysis of somaclonal variations in Ipomacea carnea grown in different soil habitats.
2. Material and Methods
2.1. Plant Samples
- Ipomaea carnea plants were collected from two soil habitats plants growing in xeric (arid rocks) and hydric (rivers) soils conditions. The morphological characters as plant height, stem diameter, leaf shape long and broad. As well flowers characters were determined.
2.2. Soil Supporting
- Ipomaea carnea were collected from arid and hydric soils at Benha, Qalubia governorate Egypt. Physico-chemical (soil characters Soil texture, chemical reaction, electric conductivity, total soluble salts, cations, total nitrogen, calcium carbonate) were determined by methods described in a standard book (Jackson, 1967).
2.3. Scanning Photography
- These plants were grown in arid and hydric soils. All plants received naturally habitats. In the summer season the upper leaves of plants top were used. The leaves were separated from plants and immediately cut with the cutter into 5 x 5mm and fixed in 25% glutaroldhyde for 2 to 4 h at 4°C then post-fixed 1% osmium tetra oxide for 1 h, at room temperature as electribed by Harley and Fegusen (1990). The specimens were then dehydrated with ascending concentrations of acetone, critica (point drying with liquid CO2 and finally coated with gold in a vaccum sputter coater. The examination, measurements and photographing were done through a joel scanning electron microscope (ISM-T330A) at the central lab. of Fac. Agric. Ain Shams Univ.
2.4. RAPD-PCR
- The DNA fragments and determination of their base pair size were achieved by using random amplification polymorphism DNA-polymerase chain reaction technique as described by Toyler et al (1995).
2.5. Isolation of Genomic DNA
- DNA isolation was performed using (TAB method according to Doyle and Doyle (1990). DNA concentration was determined by spectrophotometer and confirmed by electrophoresis of 5 μl sample along were serial dilutions of Lambda DNA in 1.5% agarose (Castiglione et al 1994).
2.6. DNA Amplification
- DNA amplification was done by polymerase chain reaction (PCR) using Biometrica Uno thermal cycler. Amplification was performed in 10 μl reaction mixture containing 20 ng genomic DNA, 0.5 unit tag polymerase (Sigma), 200 μM each of dATP, dCTP, dGTP and dTTP; 10 pmole random primer (Operon and appropriate amplification buffer. The mixture was assembled on ice, overlaid with a drop of mineral oil. Amplification was performed as follows: one cycle at 92°C for 3 min and 45 cycles at 92°C for 30 sec.; 35°C for 60 sec. and 72°C. for 2mm for (denaturation, annealing and extension respectively). The reaction was finally incubated at 72°C for 10 mm and further 10 min. at 62°C. In order to select the optimal conditions of the RAPD-PCR different optimization experiments were carried out.
2.7. Analysis of PCR Products
- The amplification products were analysis by electroptrpsis on 1.5% agarose gel in TAE buffer, and stained with 0.2 μg/ml ethrolium bromide and photographed under UV light.
3. Results
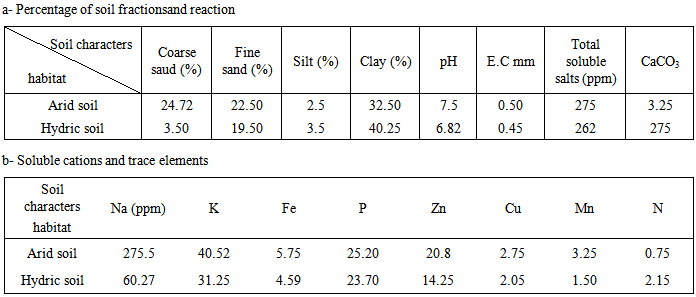
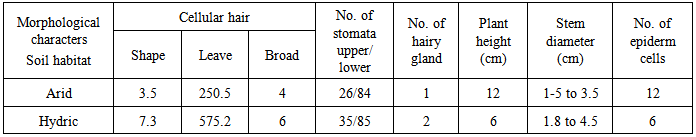
- The observation in vivo Ipomaea carnae plants, indicate that morphological variation of Ipomoea carnae leaves, as well as DNA fingerprint in vivo. It had the influence of the habitat on growth and development of plants, somaclonal variation and decorative behaviors of Ipomoea carnae plants. Firstly, so available literature has mentioned the using leaves impression of plants for differentiating between varieties. It is worthy, to mention that differences in both surface view of leaves epicuticle and the number of stomates for the studied Ipomoea carnae plants a indicated from the microscope scrulinization of both studies habitats. The leaf morphology was varied of Ipomoea carnea plants in different habitats (arid and hydric soils), where as edge, leaf area, grain color and physiological age. From the microscopic examination of both surfaces, it is obvious that these were great different in the impression of two Ipomoea carnea plants.It is evident, the impression of the upper and lower leaf epiculicle shows that the stomata scattered without any design (Fig. 1). Concerning the stomatal number Table (2) shows a great difference between Ipomoea carnea plants in different habitats. It was 26\88 and 32|85 (stomata per square 0.2 mm of lower leaf surface) for arid and hydric soils respectively. While, it was 34 and 35 stomata per square mm of upper surface of Ipompea carnea plants arid and hydric soils respectively. It is evident (Table, 2) that the surface impression view of leaf epicuticle appeared as a unique structure for each Ipomoea carneain arid and hydric soils where multicellular hairs (number, length and number of cell perhair) alternated in a constant sequence which make specific unit for each Ipomoea carnea in arid and hydric soils (Table 2).The impression of leaf epicuticle surface shows that, the hair gland scattered without any design (Fig. 1). Concerning, the number of hair gland (Table 2) shows a great difference among 2 Ipomoea carnea plants in hair gland per unit of leaf area. It was 1 and 2 of Ipomoea carnea arid and hydric soil respectively. The epiderm cells were differed among 2 Ipomoea carnea plants (arid and hydric soils) shape and number where as the average of epiderm number cells 12and 6 cells, respectively. The flowers are dichasia L cymes; sepals are 4 x 3.5 and 5 x 4 mm broadly coriaceous, pubernulent, the margin navrowly serious, corolla 5.5 and 7.5 cm, pink or deep pink to purplish, capsule 2.2 and 2.0 cm subglobose to broadly ovoid seeds closed with brownish hairs.Soil samples were taken from arid (profile A) and hydric (profile B) soils. The data of soil analysis of two profiles representing the habitat conditions associated with Ipomoea carneaare given in Table (1). The results showed that the percentage of coarse and fine sand attain higher values in the profile A (24.72 and 22.5) then in the profile B (3.5 and 19.5%). Meanwhile the percentage of silt and clay attain higher values in profile A (25 and 32.5) than profile B (35 and 40.25%). The soil reaction is alkaline side with pH values 7.5 and 6.82 in the profile A and profile B respectively. The electrical conductivity attains lower values in habitate B hydric soil (0.45) than arid soil (habitat profile A (0.50 mmnos/cm). Also, the total soluble salt content attains lower in hydric soil (262) and than arid soil habitat (275 ppm). Calcium carbonate content is relatively lower in profile B (2.75) than in profile A (3.25%). The contains content (Na+, K+, Mn+, Cu++ and Fe+++) indicate that the amounts of the contains are relatively higher in the arid soil (275.5, 40.52; 3.25; 2.75 and 5.75) than in the hydric soil (50.27; 31.25; 1.50; 2.05 and 4.50 ppm) respectively. Regarding P and N, the results indicate that the values of P (25.20) and N (0.75 ppm) are lower in the arid soil than in the hydricsoil being 28.70 and 2.15% for P and N respectively. These results accordingly it may be associated with relatively higher values of the water holding capacity and organic matter content (Table).
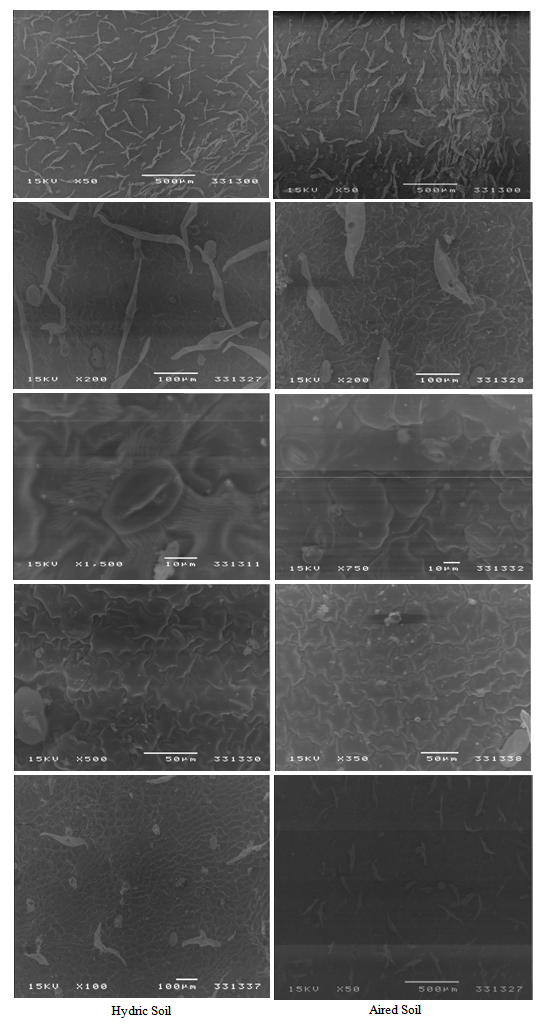 | Figure 1. Upper surface leaves types of Ip. carnea plants habitat soils arid soil and hydric soil showing, S: Stomata, H: hair, E= epidermal cell |
|
|
3.1. DNA Fingerprint of Ipomaea carnea Plants
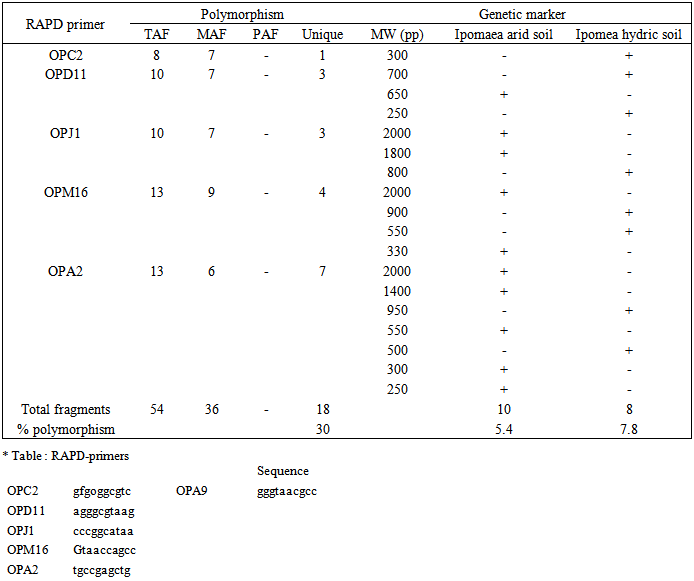
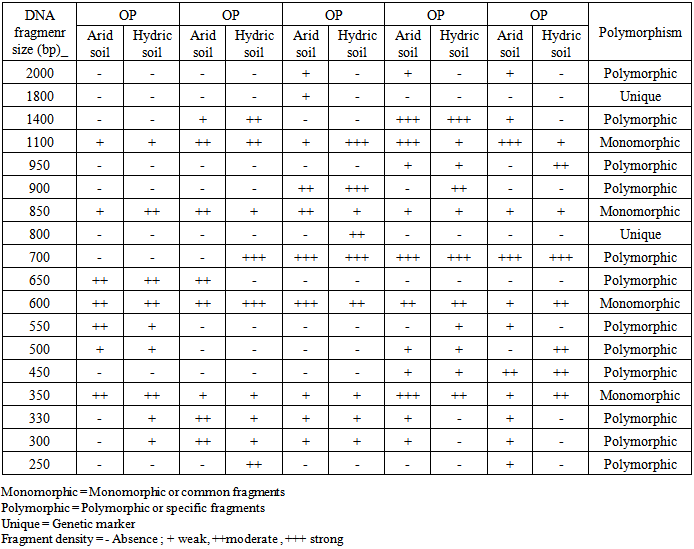
- DNA samples presentation for RAPD-PCR amplification was found crucial for fingerprint of two Ipomaea carnea plants. The DNA were extracted using CTAB extraction method. The yields of DNA was determined spectrophotometrically as 50μg/0.5 g of leave tissues. The purity of DNA genome samples as indicated by A max / A min ratio was 1.5.PCR conditions for RAPD analysis were optimized by investigating each factor individually. This include genomic DNA quality and concentration primer annealing and extension temperatures as well as denaturation temperature and time. The optimized conditions were detailed in methods above. It was found that quality of genomic DNA extracted as described here was a good template for PCR amplification. However, DNA treated with RNase gave sharp and clear amplification products. Ten random primers screened (Operon random primer) were surveyed. For the reproducibility of RAPD primers, two or three independent experiments were performed each primer five primers namely OP, OP, OP, OP and OP were more stable and reproducible and gave sufficient polymorphism among two Ipomaea cornea growing in arid and hydric soils out of ten primers.The distribution of the polymorphic amplified fragments which were generated using 5 selected primers of two Ipomoea carnea are summarized in Table (3 and 4) and Fig. (2). The results revealed that 90 amplified fragments (15, 17, 17, 22 and 19) by OP, OP, OP and OP respectively. Whereas, Op primer appeared 7 and 8 fragments for Ipomoea carnea grown in arid and hydric soil respectively with fragment 330 bp relative to hydric soil. Op primer appeared 8 and 9 fragment of Ipomoea carnea grown in arid and hydric soils respectively with 700 and 250 relative to hydric and 650 bp relative to arid soiOp primer appeared 9 and 8 fragments of Ipomoea carnea grown arid and hydric soil with 2000, f800 relative to arid and 800 bp to hydric soil. Op primer appeared 11 and 11 fragments of Ipomoea carnea grown in arid and hydric soil respectively with 2000; 300 relative to hydric soil. Op primer appeared 11 and 8 fragments of Ipomoea carnea grown in arid and hydric soil with 2000, 1400, 550, 300 and 50 bp relative to arid and 950 and 500 bp relative to hydric soil (Table 3 and 4).A total of 90 scorable amplified DNA fragments ranging in size from 2000 to 250 bp were observed using 5 RAPD primers where as 40 common fragments (monomorphic) with 43% relative to Ipomomea carnea plants, 48 specific fragments (polymorphic) with 53% relative to arid and hydric soils and 2 unique fragments (genetic marker) with 1800 relative to Ipomea carnea grown in hydric soil. It is interesting to note that, the two Ipomoea carnea are varied in their morphological characters using five RAPD primers by PCR as relative to type of soils.
|
|
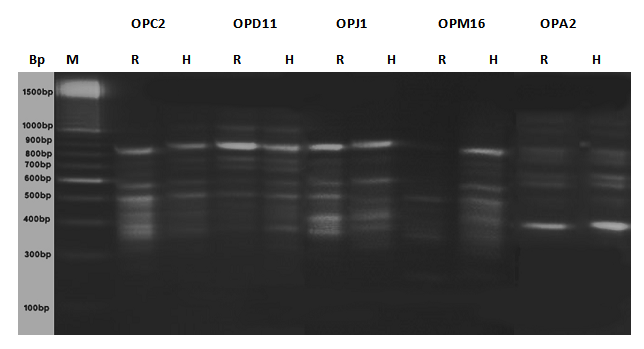 | Figure 2. Agarase gel (1%) electrophoresis analysis of RAP-PCR amoplified products of NA isolated from leaves of Ip. Carnea plants habitat (A) arid soil and (H) hydric soil using 5 RAPD primers and (M) DNA leader |
4. Discussion
- Ipomoea carnea was found growing in arid and hydric soils conditions. The plant seemed to best in hydric nutrient rich conditions. It is well known that the behavior of the root is dependent upon the texture of the soil. The variation in form growth and direction of the root are related to habitat condition. The species concerned Ip. Carnea habitats various habitats ranging from xevic to hydric habitat. Two different habitats namely arid habitat. And hydric habitat soils were chosen. The climatic factors were summarized, soil texture calcium carbonate content, cations (Na+, K+, Ca++, Cu++, Fe+++, Mg++, P+++ and Zn++ were determined. The results of soils analysis reflect some variations between soils studied habitats. The soil texture showed relatively wide range of variations the sum of sandy fractions was higher in arid habitat. On the contrast, the higher percentage of the fine particles was attained in hydric soil habitat. The pH of the soil was found 7.35 and 8.00 in hydric and arid soil respectively. The electrical conductivity for soil samples was less than 1mm has/cm indicating that there was no development for alkalinity or salinity in the soil supporting Ip. carnea in soil habitat . The results from this study of the effect of habitats on morphological features of leaves showed noticeable variations indifferent leaves in the plants of two habitats. It revealed variation of leave morphology such as hair, stomata, epidermal cells, leaf diameter and length and wide were attained were attained in plants of habitats.Frey (1995) and Asmaa (2004) stated that Ip. carneawas found growing in sandy and silty, nutrient poor and organic, xeric and hydric conditions the plant seemed to prosper best in hydric, nutrient ricjconditions. Raiset al (1993) stated that the jojoba leaves become thicker due to enlargement of the parenchyma cells. The observations indicated that the different leaves of two Ip. carnaeatypes, as well as DNA fingerprint had a using for differentiating between two Ip. carneatypes. And the decorative behaviors of Ip. carnea. Firstly, so available literature has mentioned using the leaves impression of plants for differentiating between types. It is worthy, the mention that there were no differences in both surface view of leaves epicuticle and the number of hairs and stomata for the studied two Ip. carneatypes as indicated from the microscopic scrutinization of both leaves. The leaf morphology was variation among two Ip. carnea types where as edge, leaf area. From the microscope examination of both surfaces, it is obvious that there were great differences in the impression of Ip. carneatwotypes.It is evident the impression of the upper and lower leaf epicuticle shows that the stomata scattered without any design concerning the stomatal number showed a great difference between types in stomatal number per unit of the lower area. The leaf epicutical appeared as a unique structural for each Ip. carneatype. Whereas multicellular hairs (number, length and number of cell per hair) alternated in a constant sequence which makes specific unit for each plant type. The epiderm cells were differed between two plant types (shape and number). Since somaclonal variation was first defined (Larkin and Scouscroft, 1981), it has been widely documented in tissue culture raised plants at morphological, chromosomal biochemical and molocular levels many plants (Brown, 1991). Polymorphism at DNA level among the somaclonal families which phenotypically normal was reported in populous deltoids (Valloyet al. 1995). Such modifications included gene methylation changes, DNA rearrangements and alterations in copy number. However, it is sometimes hard to differentiate such permanent somaclonal variability from transient epigenetic changes. Epigenetic changes. Epigenetic changes are often demonstrated after an exposure of plant material to a stressful condition and may be due to DNA amplification, DNA methylation or activation of transposable element s (Brar and Join, 1948).In contrast to the RAPD results minor morphological variation was observed, especially in case of the leaves of Ip. carnea plants. The variability observed at the morphological level may be caused by the clonal growth habit of the Ip. carnea (Asmaa, 2004). Moreover, clones of many species have a high level of morphological plasticity in response to environmental condition (DeKroons and Hutchings, 1995). These results mean that molecular tools are more valuable than the phenotypic observations for evaluating variations and monitoring genetic stability (Leroy et al 2000). It also highlights the need for alternative methods of definitive identification based on molecular techniques such as randomly amplified DNA (RAPD) or amplified fragment length polymorphism (AFLR). The RAPD analysis can detect sufficient polymorphism to differentiate among Ip. carnea types and that it is suitable fir studying their genetic relationships. This study is considered as a useful report on the assessment of somaclonal variation of cultivated Ip. carnea phenotype, by RAPD molecular markers. Our results showed no genetic variability was detected among two types of Ip. carnea plants, which indicated high genetic stability within each species (Gaafar and Saker, 2006).