International Journal of Ecosystem

p-ISSN: 2165-8889    e-ISSN: 2165-8919

2014;  4(5): 212-223

doi:10.5923/j.ije.20140405.02

Climate Change Impact on Rice Yield and Adaptation Response of Local Farmers in Sumedang District, West Java, Indonesia

A. Candradijaya1, Kusmana C.2, Syaukat Y.3, Syaufina L.2, Faqih A.4

1Doctorate Program, Dept. of Environmental Management, Bogor Agricultural University (IPB)

2Dept. of Silviculture, Kampus IPB Darmaga, Bogor, 16680, Indonesia

3Dept. of Resources and Environmental Economics, Kampus IPB Darmaga, Bogor, 16680, Indonesia

4Dept. of Geophysics and Meteorology, Kampus IPB Darmaga, Bogor, 16680, Indonesia

Correspondence to: A. Candradijaya, Doctorate Program, Dept. of Environmental Management, Bogor Agricultural University (IPB).

Email:

Copyright © 2014 Scientific & Academic Publishing. All Rights Reserved.

Abstract

Despite the well-documented model-simulated adverse climate change impact on rice yields reported elsewhere, interventions to address the issue seems still limited, particularly at local level. This links to the uncertainty that entails to climate projection and its likely future impact, which varies across regions and climate models. The study analyzes climate change-induced yield reduction and the adequacy of current adaptations to cope with the large range of impact under various climate models. Seventeen General Circulation Models (GCMs) under Representative Concentration Pathways (RCPs) climate change scenarios of RCP8.5 and RCP4.5, combined with CROPWAT model were used for near-future (2011-2040) and far-future (2041-2070) projections. The output confirms yield reduction to occur in the near-future, to the extent variable across the GCMs. At the highest estimation, rice yield decreases by 32.00% and 31.81%, in comparison to baseline, for near-future under RCP8.5 and RCP4.5, respectively. The reduction extends, with a slightly higher degree, to the far-future. The reduction is sensitive to variation in farming practices of the local farmers, in particular that in planting time and irrigation scheduling. The shifting of planting time to better match rainfall pattern and improved irrigation reduced the yield reduction by 16.16% and 15.18%, respectively. The combined impact of the two, however, still leaves un-tapped a reduction of 5.86%, suggesting that planned interventions are still required to improve the current farm management. The findings provide valuable inputs for relevant authorities to understand the whole continuum of climate change-induced rice yield reduction, based on which sets of planned interventions locally specific for the areas could be developed, accordingly.

Keywords: Climate change, Rice yields reduction, Autonomous adaptation, Planting time, Irrigation

Cite this paper: A. Candradijaya, Kusmana C., Syaukat Y., Syaufina L., Faqih A., Climate Change Impact on Rice Yield and Adaptation Response of Local Farmers in Sumedang District, West Java, Indonesia, International Journal of Ecosystem, Vol. 4 No. 5, 2014, pp. 212-223. doi: 10.5923/j.ije.20140405.02.

1. Introduction

Most Indonesian population (94%) relies to the greatest extent on rice as their staple food. Taking into account its huge population of 237.64 millions [1], it is understandably that Indonesia cannot rely on the still “thin and volatile” international rice market to fulfill its domestic demand. The Indonesian new Food Law No. 18/2012 explicitly states that food security in Indonesia has to be based on domestic food availability and food sovereignty [2]. In this connection, self-sufficiency on staple food, particularly rice, has been one solution, to which most government programs are directed in order to ensure national food security.
In Indonesia, producing more rice for the future is a growing challenge, particularly under the adverse impacts of climate change. According to [3], climate change affects rice yield through movements of climatic variables such as temperature and precipitation. Temperature affects evapotranspiration and determines the length of crop growing season, while rainfall controls irrigation water supply to meet the crop water requirement [4].
Studies confirmed that changes in climate have been occurring in Indonesia, to a level substantially variable among regions. Temperature increased at about 0.3℃ over the last decade, and annual precipitation has decreased by 2-3%. The pattern of rainfall has changed. In the southern regions, the rainfall was declined, while in the northern part an increase was observed. A change has also been observed in the seasonality of precipitation, where an increase in the wet-season rainfall was recorded in the southern and a decrease in the dry-season rainfall in the northern region [5, 6]. In terms of future climate projection, it is estimated that warming in Indonesia will occur at a rate highly variable across regions, ranging from the lowest of 1.16℃ to the highest of 1.58℃ until 2070, where the highest temperature potentially occurring in the Island of Kalimantan. In Java, the warming ranges from 1.30℃ in the west part to 1.36℃ in the east [7]. With respect to future projection of rainfall, it is estimated that the trend in future precipitation is highly variable across regions, where majority of Indonesian Island show an increasing trend, while the rest indicates a trend of reduction, particularly in the southern parts. In Java Island, rainfall is estimated to decrease arround 30% until 2080 [8].
Efforts have also been made by numbers of studies to quantify the impact of climate change on crop yields. It is reported that a reduction in crop yields will occur in some parts of Asia at a level of 2.5-10% until 2020 and 5-30% until 2050 [9]. Studies in Indonesia estimated that climate change will likely decrease rice yield by 4% per year, soybean by 10%, and maize by 50% [10]. Furthermore, it is reported that until 2050 crop yield reduction will be at a level of 20.3- 27.1% for rice, 13.6% for corn, and 12.4% for soybean [11].
Despite the model-simulated adverse impact of climate change on crop yields, farmers are likely still able to survive. This has been made possible by a large number of adaptations in farming management practices assumed to occur autonomously, ranging from simple adjustment on planting calendar to large investment on input and infrastructure. However, the uncertainty that entails to the climate projection and its likely future impact on yields, which varies substantially across crops, regions, and climate models, posted high risks of reduced or inadequate adaptation. This links to the facts that uncertainty in climate change and its likely future impact tend to discourage relevant authorities to develop adequate adaptation measures, particularly those that require substantial investments. In this regards, any climate impact studies should address the potentials of inadequate or reduced adaptation by assuming a wider assumptions or scenarios to capture the whole possible range of climate impacts.
This study provides an analysis of rice-yield reduction impact of climate change and the adequacy of the locally-specific farm-level adaptation measures autonomously developed by local farmers to cope with the large range of climate change impact under 17 GCMs using the new climate change scenarios of RCPs used by IPCC in its latest Fifth Assessment Report (IPCC AR5) [12, 13]. In specific, the study aims to analyze (i) the range of changes in climate, specifically for the study area under 17 GCMs, (ii) the extent to which the changes affect rice yield, and (iii) the adequacy of local farmers’ autonomous adaptation, i.e. adjustments in planting time and irrigation schedule, in addressing the current and future impact of climate change.

2. Materials and Methods

2.1. Study Area

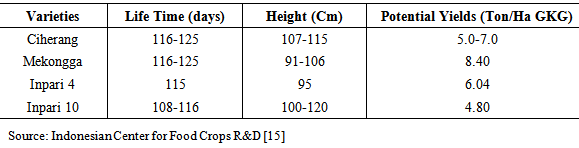
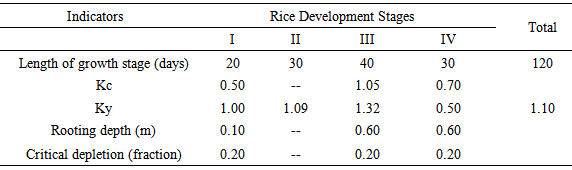
The study was conducted in the Sub-district of Ujungjaya, Sumedang District, the Province of West Java, Indonesia (Figure 1). The location lies approximately between longitudes 107°21' - 108°21' E and latitude 6°44' - 7°83' S. It covers a landmass of 1,518.33 Km2, where agriculture occupies 331.78 Km2 or around 21.85%. According to its water supply, farming is divided into rain-fed (63.17 Km2) whose water supply is exclusively derived from rainfall and irrigated (268.61 Km2) whose water supply is supplemented and/or regulated by irrigation infrastructure [14]. In the study area, however irrigation infrastructure mostly, if not all, has no sufficient capacity to maintain stable water supply for farming all year around. This is because irrigation infrastructure is not equipped with well-constructed water storage facilities to accumulate water from rainfall during rainy season and release it during the dry season. The main variety of rice commonly grown by the local farmers is Ciherang. There are also other rice varieties grown, but still very limited, i.e. Mekongga, Inpari 4, and Inpari 10. The characteristic of those varieties is presented on Table 1.
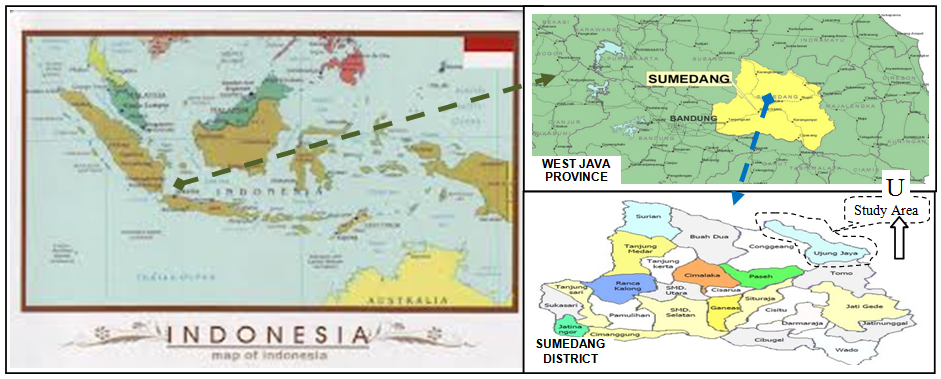
Figure 1. Map of Study Area
Table 1. Characteristics of rice varieties grown in the study area
     
Regardless the above characteristic, local farmers believe that Ciherang is still the best variety to grow. Among the very limited farmers who grow varieties other than Ciherang mentioned that they grew the variety simply as a trial and they treat it relatively equal to Ciherang. According to the local farmers, the average growing period of those varieties is relatively similar, that is around 120 days, from planting to harvesting. Farming calendar generally follows the pattern of rainfall. In the rain-fed areas, planting is generally made 2 times a year. The first planting links to the onset of rainy season (usually in November or December), while the second starts immediately after the first harvesting. The second planting time is highly critical in relation to the pattern of rainfall, where the risk of failure resulting from limited water supply is critically high. Farmers are fully aware of the risks but for most of them little they can do due to their limited resources. They just rely on their fortune, hoping that enough rain will still occur until harvesting.
In irrigated areas, planting time is relatively more flexible, made possible by supplementary water supply from irrigation. Planting occurs at almost every month, though the general pattern still follows that of the rainfall (Figure 2). Delay in planting time is relatively common in the study area, in relation to the onset of rainy season. There are at least two main reasons for the delay in planting. The first is limited labor. The phenomenon of decreasing interest of the youth on farming is already observed in the study area. The youths generally move to urban areas for off-farm employments, leaving the old to grapple with farming. The second links to water availability at farm plots level, determined mainly by access to water reservoir. Land preparation for planting requires large amount of water. For those farmers whose farm plots are close to reservoir or those who own enough resources to make better access to water supply, land preparation can be done immediately at the onset of rainy season. Meanwhile, farmers with limited resources or those whose farm plots are far off the reservoir should wait until the level of reservoir high enough to flow, or until water from rainfall is sufficiently accumulated in their farm plots.
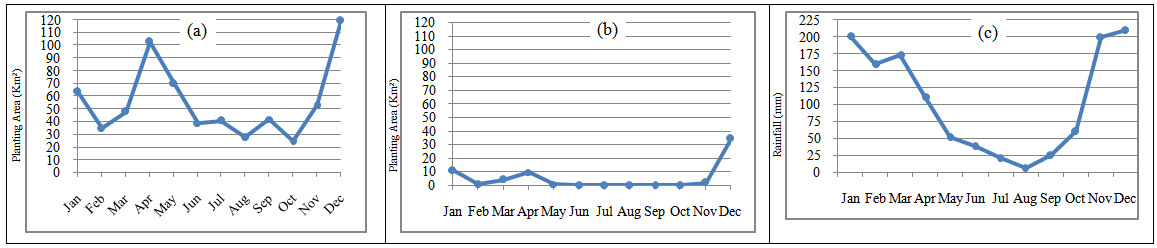
Figure 2. Planting calendar of irrigated (a) and rain-fed farm (b), in relation to rainfall pattern (c). Source: Annual report of planting area for 2012 [16]
According to the local practices, planting rice generally starts with raising the seedlings in a nursery and later transplanting them in the main field. Small numbers of farmers also do direct planting, where seeds are drilled directly to zero tilled land, but this practice is only limited to dry-season planting. The main motivations of farmers to do zero-tilled direct planting are to save water and at the same time shorten the growing period, so that they can gain early harvest, giving them more flexibility for the next planting.
Irrigation is generally applied on a rotational-based, with an application interval of 3 days during the earlier stages of rice growth and 7 days during the later stages. However, when water is not adequately available (usually during dry season), the application interval was prolonged until 7 or 10 days during the earlier stages and often until 14 days during the later stages. The depth of water irrigation in each application is set relatively constant, generally at a level of no more than 20 mm. The frequency of irrigation application varies for different locations of farm plots, depending on their access to water reservoir. For those farmers whose farm plot has limited access to water reservoir (e.g. rain-fed or farm plots with irrigation canals but located far-off the reservoir), irrigation might be supplemented with water pumps. But, this is only possible for famers who own adequate resources, while those who cannot afford the pumps just rely exclusively on rainfall. These variations in the onset of planting time and irrigation schedule among farmers reflect their autonomous responses to changes in local climate, which is highly determined by their capital. Though it is still very limited in terms of activities and coverage, interventions to address the issues have been introduced to the local farmers by the governments. These include, among others, introduction of seasonal climate prediction-based planting calendar through climate field school, water-efficient farming practices through System of Rice Intensification (SRI), and improved irrigation through provision of water pumping and piping facilities.

2.2. Climate Projection

GCMs were used to project changes in average monthly rainfall and minimum and maximum monthly temperature for two time slices, these are 2011 – 2040 (near-future) and 2041 – 2070 (far-future). Observed climate data for 30 years (1981 – 2010) was collected, as a reference, from local climate station located closest to the study area, that is Jatiwangi Climate Station. The 30 year period was chosen considering that this is the minimum period needed to define a climate. The performance of GCMs was measured by comparing the simulated climate generated by each model with observed climate. It is assumed that those models that generate simulated climate for baseline periode closer to the observed climate will produce more accurate regional climate projection. In this study, seventeen GCMs were used. This is to give an opportunity to generate the potential range of future climate and estimate the possible range of climate change impact on rice yields. The 17 GCMs used is presented on Table 2.
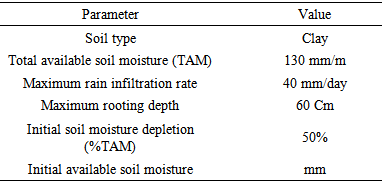
Table 2. GCM Models used in the study
     
In an attempt to cover the influence of future greenhouse gas emissions and the corresponding socioeconomic development, the recent climate change scenario adopted by IPCC was used. The scenario is known as Representative Consentration Pathways (RCPs) and has four variants, which involve RCP2.6, RCP4.5, RCP6.0, and RCP8.5. Each specifies radiative forcing and the associated concentrations of the atmospheric constituents involved over the period of 1850 – 2100 [17, 18]. Two variants of the scenario are chosen for this study. The first is RCP8.5 that represents a future with no policy changes to reduce emissions and it is comparable with SRES Scenario of A1F1 [19]. The second is RCP4.5 that represents a future with a relatively ambitious emissions reductions with a stabilized radiative forcing achieved shortly after 2100. The RCP4.5 is comparable to SRES scenario of B1 [13].

2.3. Yield Response

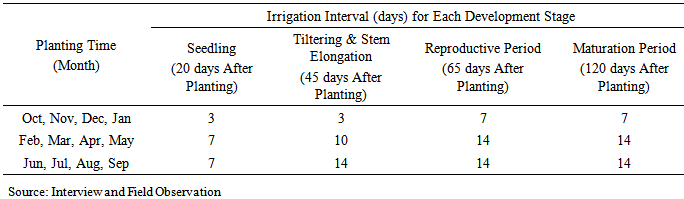
The extent of climate change impact on rice yield was assessed using CROPWAT 8.0 simulation model developed by FAO [29, 30]. Prior to its application, the CROPWAT 8.0 was calibrated by using local data for climatic condition, crop, soil, and irrigation schedule. The model was then run to simulate the yield response of rice to various GCM models-simulated climatic projections, under different planting times and irrigation schedules. The output of the model gives likely changes in crop yields as a result of changes in minimum and maximum temperature and rainfall.
In order to accommodate the local farming practices, the irrigation schedule options of CROPWAT model was set for “rain-fed” and “irrigate at fixed interval per stage”. Based on data collected through interview with local farmers and field observation, the interval of irrigation for different stages of rice development was defined according to different planting times at fixed application depth of 20 mm as presented on Table 3. Adjustments made for crop and soil data are presented on Table 4 and Table 5, respectively.
Table 3. Irrigation interval under different planting time
     
Table 4. Adjustment of crop data to match the local condition
     
Table 5. Adjustment of soil data to match the local condition
     

3. Results and Discussion

3.1. Performance of GCMs

The annual cycles of average monthly rainfall, and minimum and maximum temperature generated by the 17 GCMs under RCP4.5 and RCP8.5, together with observed data for baseline period are presented on Figure 3. All GCMs under the two scenarios generate seasonal cycles of rainfall that match reasonably well with observed data. However, there appears to be no agreement across the GCMs in simulating rainfall during rainy season (November to April). Some models tend to overestimate the rainfall (CSIRO- Mk3-6-0, CCSM4, CESMI-CAM5 and GISS-E2-R3), while some others generate lower estimation (MRI-CGCM3 and the three variants of NOAA GFDL). The GCM monthly rainfall simulations for rainy season vary substantially with the highest estimation is made by CSIRO-Mk3-6-0 at a level of 383.10 mm in November, and the lowest is recorded at 89.88 mm as estimated by MRI-CGCM3. For dry season, all GCMs generate monthly rainfall estimation relatively close to the observed data. The general pattern indicates that rainfall fluctuates around an average of 50 mm from May to October, with the lowest recorded in August.
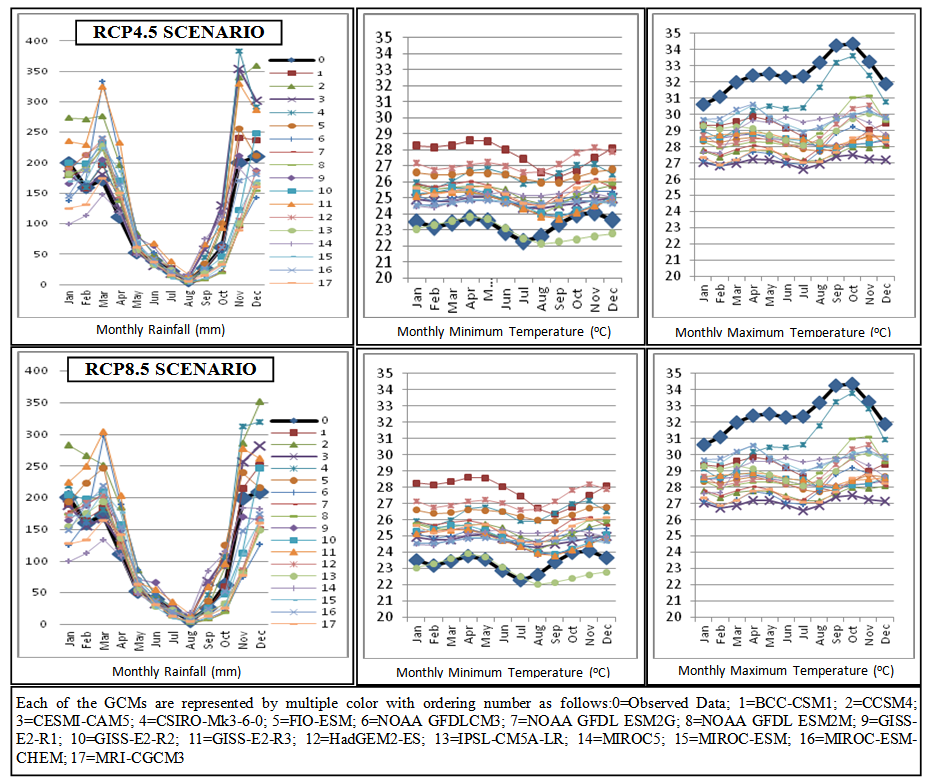
Figure 3. Comparison of simulated monthly rainfall, and minimum and maximum temperature assessed by 17 GCMs under RCP4.5 and RCP8.5 with observed data for the period of 1981 – 2010
The simulation of monthly minimum temperature generated by all GCMs, but IPSL-CM5A-LR, appears to overestimate the observed data. The minimum temperature tend to decrease in the onset and drop to the lowest in the mid of dry season. Then, it increases to peak at the onset and decreases afterward until the mid of rainy season. The seasonal cycle of the minimum temperature is well represented by NOAA-GFDL-CM3 and NOAA-GFDL- ESM2G. Contrary to that of minimum temperature, the model simulation of monthly maximum temperature is seen to underestimate the observed data. However, it shares a seasonal cycle pattern with that of the minimum temperature. The GCM that best replicates the pattern is CSIRO-Mk3-6-0.

3.2. Changes in Rainfall and Temperature

The projection of rainfall generated by the 17 GCMs for near-future and far-future periods under climate change scenarios of RCP4.5 and RCP8.5 is presented on Figure 4.
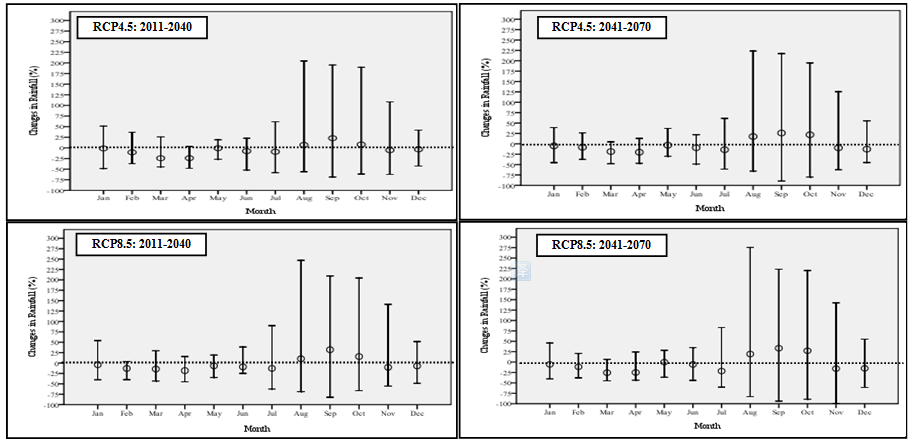
Figure 4. Changes in monthly precipitation (%) relative to baseline projected by the 17 GCMs under RCP4.5 and RCP8.5 for near-future and far-future periods
The rainfall projections generated by most of GCMs for near- future under RCP4.5 indicates a slight decrease in rainfall for almost the whole months, except August, September, and October, where rainfall show a slight increase. The highest reduction in rainfall occurs in March and April, whose median value of the 17 GCM projections are 24.36% and 24.10%, respectively. For the other months, the median value of rainfall reduction tends to fluctuate, ranging from the lowest of 3.51% in December to the highest of 10.47% in February. Meanwhile, the median projection of rainfall for August, September, and October are estimated to increase by 6.98%, 22.82%, and 7.83%, respectively.
With regards to the range of projections generated by the 17 GCMs, it is obvious from Figure 4 that the range of projection for August, September, and October is substantially wider in comparison to that for the other months. This could be justified by the erratic rains projected to occur by the three variants of NOAA-GFDL during dry season. According to the monthly rainfall pattern for baseline period (Figure 3), August indicates the month where rainfall is at the lowest, while September and October are a transition period from dry to rainy season. On annual basis, the projected changes in rainfall generated by the 17 GCMs ranges from the lowest of -35.02%, as estimated by CCSM4 to the highest of 30.67%, as recorded by MRI-CGCM3, while the median projection is reported at -2.14% as assessed by IPSLCM5A-LR. The pattern of the 17 GCM projections for rainfall changes is shared accross scenarios and time slices of projection, where the RCP8.5 scenario and far-future time slice indicate slightly higher degree of change to both positive and negative direction. According to [31], though it has no direct link with any of the plant processes, rainfall determines irrigation supply to fulfill crop water requirement.
Figure 5 presents the change in minimum temperature for near- and far-future projections generated by the 17 GCM models under RCP4.5 and RCP8.5 emission scenarios. Most GCMs under RCP4.5 for near-future suggest a decrease in monthly minimum temperature, as indicated by the median value of the 17 GCMs, which fluctuates below zero all year arround. The highest reduction occurs in July, where the median pojection of the minimum temperature decreases by 1.71℃ and the lowest occur in October with a reduction level of 0.66℃. According to monthly minimum temperature pattern for baseline (Figure 3), the highest decrease coincides with the lowest level of minimum temperature, while the lowest decrease coincides with the highest minimum temperature. The range of projections generated by the 17 GCMs are relatively consistent accross months all year round. According to [32] low minimum temperature affects crops by reducing their metabolic reactions.
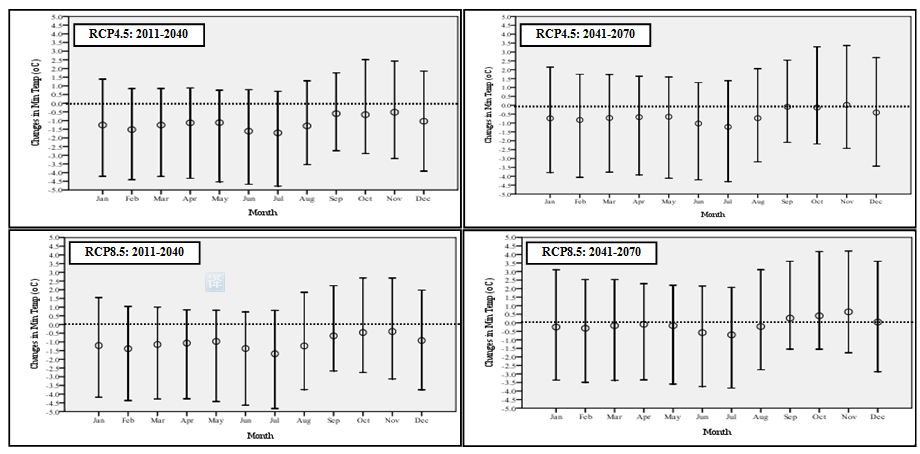
Figure 5. Changes in monthly minimum temperature projected by 17 GCMs under RCP4.5 and RCP8.5 for near-future and far-future
The general pattern of change in the projection of minimum temperature suggested by the 17 GCMs under RCP4.5 for near-future extends to the far-future period, but the level of reduction tend to decrease, shifting the general pattern up to approach zero level. Even, during the transition from dry to the onset of rainy season (September, October, and November), the change in minimum temperature is crossing the zero level or being positive. The tendency of possitive change in monthly minimum temperature are being more visible for far-future projection under RCP8.5. On annual basis, the minimum temperature is projected to increase at a level ranging from as low as 1.84℃, as estimated by GFDLESM2M to as high as 4.10℃ as recorded by GFDL-CM3, with a median value of 2.62℃, as projected by CSIRO. Large number of studies confirm that increasing in night time (minimum) temperature is the main contributing factor to reduction in crop yield [33, 34, 35, 36].
Figure 6 suggests that all GCMs are in agreement to estimate a substantial increase in monthly maximum temperature. The highest increase occur in September and October at a level of 6.29℃ and 6.18℃, respectively, coincides with the transition from the peak of dry season to the onset of rainy season. The level of increase is then decreasing to achieve the lowest of 2.77℃ in January and it increases again afterward. With regards to the range of projection generated by the 17 GCM models, it is obvious that higher median value of projection coincides with wider range of projection. On annual basis, all GCM models confirms an increase in maximum temperature with a median projection of 2.37℃ as indicated by GISSE2R3, and ranging from the lowest of 1.73℃ to the highest of 3.80℃, as made by GFDLESM2G and GFDLCM3, respectively. According to [36], any further increase in temperature during the sensitive stages of rice development may be supra-optimal and consequently reduce the yield. This is because most rice is currently grown in regions where current temperatures are already close to optimal.
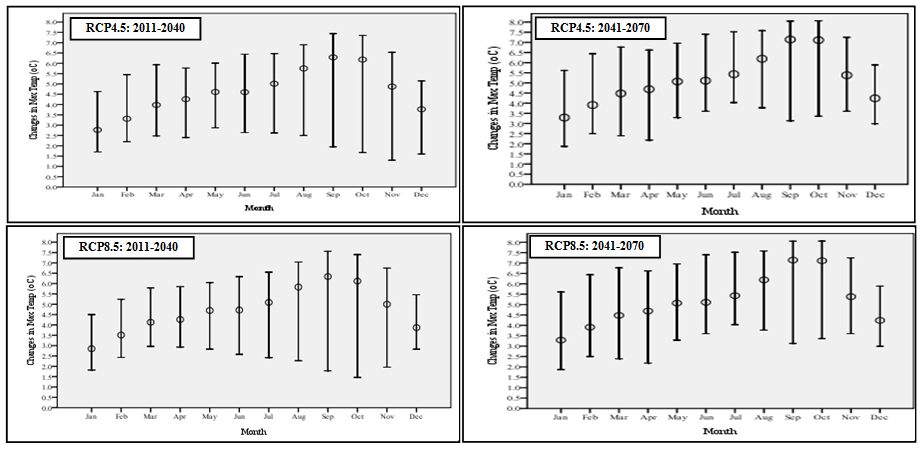
Figure 6. Changes in monthly maximum temperature projected by 17 GCM models under RCP4.5 and RCP8.5 for near-future (2011-2040) and far-future (2041-2070) periods

3.3. Yield Response of Rice to Future Climate

The yield response of rice to the 17 GCM climate projections is estimated by using a crop simulation model of CROPWAT 8.0 for different planting time and irrigation scheduling under both rain-fed and irrigated rice field. The output of CROPWAT 8.0 is presented on Figure 7 for rain-fed rice and Figure 8 for irrigated rice.
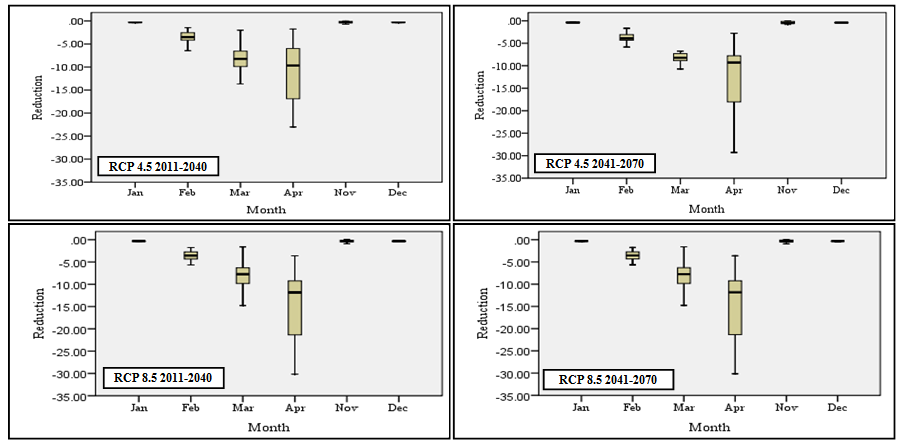
Figure 7. Changes in rain-fed rice yield estimated by by 17 GCMs under RCP 4.5 and RCP 8.5 for near-future and far-future
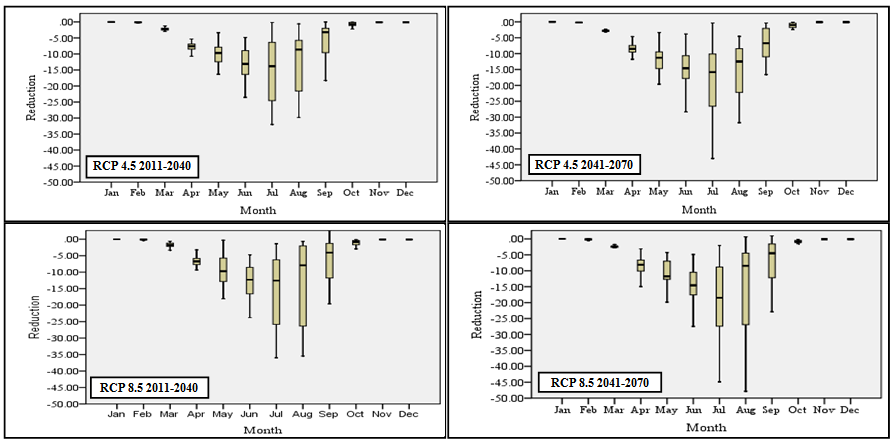
Figure 8. Changes in irrigated rice yield estimated by 17 GCMs under RCP4.5 and RCP8.5 for near-future and far-future
Figure 7 indicates that all GCMs confirm a decrease in rain-fed rice yield with a different degree of reduction for different planting time and irrigation scheduling. The lowest reductions are recorded for the planting time of November, December, and January, where all GCMs are in agreement to show a low level of yield reduction at less than 1.0%. For those planting times, rice yield is closed to the yield potency of the variety planted in this area, in this case Ciherang variety, recorded on average during the last 5 years at 39.31 kwintal/ha [37]. The low yield reduction of wet-season planting was also reported by previous study in other dry land area of Indonesia, where the yield reduction was recorded at a level of less than 5% [38].
The yield reduction then deviates across models for planting time of February, March, and April. The highest deviation across models occurs in April, where the yield reduction for near-future under RCP4.5 is projected to range from as low as 1.75% as estimated by MIROC-ESM to as high as 23.03% as assessed by GISS-E2-R3. The yield reduction for near-future is slightly higher under RCP8.5, ranging from the lowest of 3.45% as estimated by MIROC-ESM to the highest of 28.17% as estimated by GISS-E2-R3. Higher degree of yield reduction is observed for far-future under both RCP4.5 and RCP8.5. The level of reduction under RCP4.5 ranges from as low as 2.79% to as high as 29.30% as estimated by IPSL-CM5A-LR and GISS-E2-R3, respectively. Under RCP8.5, the yield reduction ranges from 3.62% as estimated by MIROC-ESM to 30.16% as estimated by GISS-E2-R3. This finding is consistent with previous study, where the highest rainfed rice yield reduction was recorded at a level of around 30% [39]. The general pattern of projections generated by the 17 GCM models indicate that the higher the degree of projected yield reduction, the wider the range of projection across the GCM models.
Figure 7 also suggests that under rain-fed farm, shifting planting time from April to March results in a decrease of yield reduction from 23.03% to 13.67% and from 25.96% to 16.86% for near-future at the highest projection under RCP4.5 and RCP8.5, respectively. The decrease in yield reduction extends to the far-future under both RCP8.5 and RCP4.5, with a slightly higher degree of decrease. The magnitude of change in yield reduction between planting time of April and that of March gives an indication of the degree to which the local farmers’ autonomous response to climate change has been effective in minimizing the climate change-induced yield reduction impact on rice. The potencies of shifting planting time from April to March is still high, taking into consideration the fact that planting area of April is still substantially higher than that of March (see Figure 2b). However, the shifting in planting time is only possible for those farmers who own adequate resources to make the necessary adjustment through among others investment on irrigation infrastructure to give more flexibility for farmers in determining the onset of planting or using high-yielding varieties to shorten growing period.
Similar to that in rain-fed farms, the safest period for planting in irrigated farms lasts from November to February, when reduction in yield is low, fluctuating below 1.00%, as estimated by all GCM models for both near- and far-future, under RCP4.5 and RCP8.5 (Figure 8). For those planting times, rice yield is closed to the yield potency of the variety planted, in this case Ciherang variety, recorded on average during the last 5 years at 64.95 kwintal/ha [37].
The highest yield reduction occurs in July, as estimated consistently by GISS-E2-R3 for both near- and far-future under RCP4.5. Meanwhile, under RCP8.5, a slight shifting in the peak of yield reduction is observed for far-future, where it occurs in August, instead of July, linking to substantial decrease in August rainfall (see Figure 2). GISS-E2-R3 estimates the highest yield reduction of 32.00%, 33.58%, and 31.81%, for near- and far-future under RCP4.5, and near-future under RCP8.5, respectively. For the far-future under RCP8.5, the highest reduction in yield is estimated by MIROC5 at a level of 34.81%. The highest yield reduction during this period reflects the combined impact of increased temperature and decreased precipitation. In this regards, sets of interventions to improve the current irrigation scheduling and shift current planting time to better match the pattern of rainfall is required through among others introduction of shorter life cycle drought-tolerant varieties and water pump or various water harvesting methods.
Figure 7 and 8 indicate a substantially lower yield reduction under irrigated farming, relative to that recorded under rain-fed farming for the same planting time. Taking the planting time of April as an example, we can calculate a difference in yield reduction of 16.16% (28.17% vs. 12.01%) and 15.18% (30.16% vs. 14.98%) at the highest projection as recorded by GISS-E2-R3 for near- and far-future projection under RCP8.5, respectively. The difference in yield reduction between rain-fed and irrigated farms of 16.16% and 15.18% provide an indication of the degree to which the irrigation scheme applied by local farmers is adequate to address the climate change-induced yield reduction impact on rice. Though, the autonomous response of local farmers seems to be quite effective to bring about a substantial decrease in yield reduction, they still leave un-tapped a residual climate change impact of 12.01% for near-future and 14.98% for far-future projection.
Furthermore, still similar to that in rain-fed farms, the annual yield reduction of irrigated rice can be minimized if adequate resources can be made available for farmers (e.g. by giving better access to water supply and high yield varieties with shorter life cycle) to do the first planting earlier in November or even in October, rather than in December. The earlier first planting will subsequently allow farmers to do earlier second planting in February or March, instead of April. This has been supported by [39] who suggested that a 30-day monsoon delay could result in a fall in rice yield by 11%, on average. A combined impact of a decrease in precipitation and an increase in temperature will even lead to massive drop in rice yield.
The most critical time for planting ranges from May to September, since water has been critically limited, and at the same time minimum and maximum temperature show a substantial increase leading to higher evapo-transpiration that result in increased requirement of water. Without any adjustment in water management, planting during this period is almost impossible for most farmers in the study area. This is why the area of planting in this period is very small (see Figure 2b), only limited to those farm areas belong to farmers who own adequate resources to make necessary adjustment through supplementary irrigation and/or adoption of drought-tolerant varieties. Another potency to address the problem is promotion of the locally limited practices of zero-tilled direct seedling. This seems to be promising since it does not require any additional high-cost investment. However, an in-depth research should be conducted prior to its broadening application, taking into consideration the currently lower yield of this practice, as often reported by the local farmers and being verified by previous study [40].
To get an insight into the extent to which climate change affected regional rice availability in the study area, changes in average annual climatic condition (temperature and rainfall) and its implication on rice yield reduction were calculated. The result indicated that average projection for annual rainfall decreased by 8.17%, from 1.336 mm in the baseline to 1.227 mm in the near-future, while that for maximum temperature increased by 1.06℃, from 27.73℃ in the baseline to 28.81℃ in the near future. The changes in climatic conditions led to 23.57% reduction in rice yield projection for the near future. The reduction extended to far-future period at a slightly higher level under both the RCP8.5 and RCP4.5. These findings are consistent with the results of previous studies, which estimated Indonesia’s annual rice yield to decline to the extent ranging from 15% to 25% [41, 42, 43]. Other study suggested that a combination of 2℃ increase in temperature and 246 mm decrease in rainfall has resulted in a decrease of rice yield by 38% [44].

4. Conclusions

The results of the study confirm that climate change has been occurring in the study area. Most GCM models show a substantial decrease in annual rainfall for the near- and far-future in comparison to that for the baseline period. However, there is no consistent pattern for the changes in monthly rainfall. The projection is highly variable across the GCM models, but the general tendency shows a decreasing trend in wet-season rainfall and an increasing trend in dry-season rainfall. With regards to projection of temperature, all GCM models are in agreement to show a substantial increase in maximum temperature for the whole months. The general pattern of GCM-model projection for minimum temperature shows a slight decrease for medium-term. However, the level of reduction tends to lessen for the far-future, shifting the general pattern up to approach, and even cross the zero level or being positive, in September, October, and November.
The output of CROPWAT simulation model confirms a reduction in rice yield to occur in the near-future projection at a degree highly variable across the various GCM models under both RCP8.5 and RCP4.5. The yield reduction extends to the far-future projection with a slightly higher degree of change. The degree of rice yield reduction is highly sensitive to the time of planting and irrigation scheduling. On the basis of the above results, it is firm to say that the current local farmers’ autonomous adaptation responses have been effective to reduce the degree of climate change-induced yield reduction in rice. However, they are not adequate yet to address fully the climate change-induced impacts on rice yield, for both near- and far-future projections. This has been indicated by the fact that the current autonomous responses still leave un-tapped a large amount of climate change-induced residual impact on rice yield. The combined impact of the current practices of shifting the planting time as well as adjustments on irrigation schedule and methods of planting, still leave 5.86% rice yield reduction un-tapped.
These findings suggest that interventions to enhance the current local farmers’ autonomous adaptation responses are urgently required. In this regards, the current limited supports of government to the areas under study need to be strengthened. The findings of this study could be valuable inputs for relevant authorities to understand the whole continuum of climate change-induced impact on rice yield, based on which sets of locally specific adaptation interventions for the areas could be developed, accordingly.

References

[1]  [BPS] Statistic Agency of Sumedang District. 2010. Population Sensus 2010. BPS, Jakarta.
[2]  Food Law No. 18 on Food. 2012. Available from: www.setneg.go.id/index.php?catname=UU&catid=1&tahun=2012&Itemid=42&option=com_perundangan&task=&act= [Accessed 29 June 2014].
[3]  Dasgupta, S. 2013. Impact of Climate Change on Crop Yields with Implications for Food Security and Poverty Alleviation.
[4]  [FAO] Food and Agriculture Organization. 2009. CROPWAT Software.
[5]  Hulme, M and N. Sheard. 1999. Climate Change Scenarios for Indonesia. Climatic Research Unit, Norwich, UK, 6pp.
[6]  Boer, R. and A. Faqih. 2004. Current and Future Rainfall Variability in Indonesia. In An Integrated Assessment of Climate Change Impacts, Adaptation and Vulnerability in Watershed Areas and Communities in Southeast Asia. Report from AIACC Project No AS21. Int. START Secretariat. Washington, DC.
[7]  Susandi, A. 2007. Impact of climate change on Indonesian sea level rise with reference to it`s socioeconomic impact. Department of Meteorology.
[8]  Hulme, M and N. Sheard. 1999. Climate Change Scenarios for Indonesia. Climatic Research Unit, Norwich, UK, 6pp.
[9]  Lasco, R.D., C.M.D. Habito, R.J.P. Delfino, F.B. Pulhin, R.N. Concepcion. 2011. Climate change adaptation for smallholder farmers in Southeast Asia. World Agro-forestry Center, Philippines.
[10]  World Bank. 2007. Indonesia and Climate Change: Current Status and Policies. Jakarta.
[11]  Bappenas. 2011. Indonesia Adaptation Strategy: Improving Capacity to Adapt. Bappenas. Jakarta.
[12]  Bernie, D. 2010. Temperature implications from the IPCC 5th assessment Representative Concentration Pathways (RCP). Work stream 2, Report 11 of the AVOID programme (AV/WS2/D1/R11).
[13]  Jubb, I., P. Canadell and M. Dix. 2010. Information Paper. Australian Climate Change Science Program.
[14]  [BPS] Statistic Agency of Sumedang District. 2013. Kabupaten Sumedang dalam Angka Tahun 2012.
[15]  Indonesian Center for Food Crops Research and Development. 2013. High Yielding Varieties of Rice.
[16]  [ADO] Agricultural District Office of Sumedang. 2013. Laporan Tahunan Dinas Pertanian Kabupaten Sumedang.
[17]  Moss, R.H., J.A. Edmonds, K.A. Hibbard, M.R. Manning, S.K. Rose, D.P. van Vuuren, T.R. Carter, S. Emori, M. Kainuma, T. Kram, G.A. Meehl, J.F.B. Mitchell, N. Nakicenovic, K. Riahi, S.J. Smith, R.J. Stouffer, A.M. Thomson, J.P. Weyant, and T.J. Wilbank. 2010. The next generation of scenarios for climate change research and assessment. Nature vol. 463.
[18]  Rogelj, J., M. Meinshausen and R. Knutti. 2012. Global warming under old and new scenarios using IPCC climate sensitivity range estimates. Nature Climate Change.
[19]  Riahi, K., S. Rao, V. Krey, C. Cho, V. Chirkov, G. Fischer, G. Kindermann, N. Nakicenovic, and P. Rafaj. 2010. RCP 8.5 – A scenario of comparatively high greenhouse gas emission. Climatic Change (2011) 109:33-57.
[20]  Xin, X.G., T.W. Wu, and J. Zhang. 2013. Introduction of CMIP5 experiments carried out with the climate system models of Beijing Climate Center.Adv.Clim.Change Res.,4,41-49.
[21]  Gent, P.R., G. Danabasoglu, L.J. Donner, M.M. Holland, E.C. Hunke, S.R. Jayne, D.M. Lawrence, R.B. Neale, P.J. Rasch, M. Vertenstein, P.H. Worley, Z.L. Yang, and M. Zhang. The Community Climate System Model Version 4, J. Climate, 24, 4973–4991.
[22]  Rotstayn, L.D., M.A. Collier, M.R. Dix, Y. Feng, H.B. Gordon, S.P. O’Farrell, and I.N. Smith. 2010. Improved simulation of Australian climate and ENSO-related rainfall variability in a global climate model with an interactive aerosol treatment, Int. J. Climatol., 30(7), 1067–1088.
[23]  Song, Y., F. Qiao, and Z. Song. 2012. Improved simulation of the South Asian summer monsoon in a coupled GCM with a more realistic ocean mixed layer, J. Atmos. Sci., 69, 1681–1690.
[24]  Donner, L.J., B.L. Wyman, R.S. Hemler, L.W. Horowitz, Y. Ming, M. Zhao, and J.C. Golaz. 2011. The dynamical core, physical parameterizations, and basic simulation characteristics of the atmospheric component AM3 of the GFDL global coupled model CM3, J.Clim., 24(13): 3484–3519.
[25]  Kim, D., A.H. Sobel, A.D. Del Genio, Y. Chen, S. Camargo, M.S. Yao, M. Kelley, and L. Nazarenko. 2012. The tropical subseasonal variability simulated in the NASA GISS general circulation model. J. Climate, 25, 4641–4659.
[26]  Jones, C.D. 2011. The HadGEM2-ES implementation of CMIP5 centennial simulations. Geosci. Model Dev., 4, 543–570.
[27]  Watanabe, M., T. Suzuki, R. O’ishi, Y. Komuro, S. Watanabe, S. Emori, and T. Takemura. 2010. Improved climate simulation by MIROC5: Mean states, variability, and climate sensitivity. J. Climate, 23, 6312–6335.
[28]  Yukimoto, S., Y. Adachi, M. Hosaka, T. Sakami, H. Yoshimura, M. Hirabara, T.Y. Tanaka, E. Shindo, H. Tsujino, M. Deushi, R. Mizuta, S. Yabu, A. Obata, H. Hakano, T. Koshiro, T. Ose and A. Kitoh. 2012. A new global climate model of the Meteorological Research Institute: MRI-CGCM3—Model description and basic performance. J. Meteor. Soc. Japan, 90A, 23–64.
[29]  Clarke, D. 1998. CropWat for Windows: User Guide. University of Southampton.
[30]  [FAO] Food and Agriculture Organization. 2006. ‘CROPWAT Model’. Food and Agriculture Organization. Rome, Italy.
[31]  Hoogenboom, G. 2000. Contribution of agrometeorology to the simulation of crop production and its applications. Agric. and Forest Meteoro.l 103, pp137-157.
[32]  Sage, R.F. and D.S. Kubien. 2007. The temperature response of C3 and C4 photosynthesis. Plant Cell Environ 30: 1086-1106.
[33]  Kukla, G. and T.R. Karl. 1993. Night time warming and the green house effect. Environmental Science and Technology 27, 1468–1474.
[34]  Ziska, L.H. and P.A. Manalo. 1996. Increasing night temperature can reduce seed set and potential yield of tropical rice. Australian Journal of Plant Physiology 23,791–794.
[35]  Peng, S., J. Huang, J.E. Sheehy, R.C. Laza, R.M. Visperas, X. Zhong, G.S. Centeno, G.S. Khush and K.G. Cassman. 2004. Rice yields decline with higher night temperature from global warming. Proceedings of the National Academy of Sciences, USA 101, 9971–9975.
[36]  Shah, F., J. Huang, K. Cui, L. Nie, T. Shah, C. Chen, and K. Wang. 2011. Climate change and paper: Impact of high temperature stress on rice plant and its trait related to tolerance. J.Agr.Sc. p.1-12.
[37]  [ADO] Agricultural District Office of Sumedang. 2013. Laporan Tahunan Dinas Pertanian Kabupaten Sumedang.
[38]  Bana, S, S. Prijono, Ariffin, and Soearno. 2013. Evaluation crop water requirement on the dryland at the West Bangkalan Sub District of Jeneponto Regency. International Journal of Ecosystem, 3(3): 30-36.
[39]  Naylor, R.L., D.S. Battisti, D.J. Vimont, W.P. Falcon, and M.S. Burke. 2007. Assessing risks of climate variability and climate change for Indonesian rice agriculture. PNAS, Vol. 104 No. 19.
[40]  Hayashi, S., A. Kamoshita, J. Yamagashi, A. Kotchasatit and B. Jongdee. 2007. Genotypic differences in grain yield of transplanted and direct seeded rainfed lowland rice (Oryza sative L.) in northeastern Thailand. Field Crop Res. 102(1): 9-21.
[41]  [ADB] Asian Development Bank. The economics of cliate change in Southeast Asia: A Regional Review.
[42]  Parry, M. 2007. The iplications of climate change for crop yields, global food supply, and risk of hunger. ICRISAT Open Access Journal.
[43]  Muller, G.C., M.W. Rosegrant. 2010. Climate change impacts on agricultural yields. Developent and climate change, World Bank.
[44]  Syaukat, Y. 2011. The impact of climate change on food production and security and its adaptation programs in Indonesia. J. ISSAS, Vol. 17, No. 1, pp.40-51.