-
Paper Information
- Previous Paper
- Paper Submission
-
Journal Information
- About This Journal
- Editorial Board
- Current Issue
- Archive
- Author Guidelines
- Contact Us
International Journal of Ecosystem
p-ISSN: 2165-8889 e-ISSN: 2165-8919
2014; 4(4): 184-189
doi:10.5923/j.ije.20140404.04
The Influence of Peacock-eye Disease and Fruit-fly Infection on Olive Oil ∆7 Stigmasterol in Northern West Bank
 Abstract
 Reference
 Full-Text PDF
 Full-text HTML
Orwa Jaber Housheya1, Mohamad AbuEid2, Odayy Zaid2, Motasem Zaid2, Omaya Hamad2, Majed Yasin Jeneedi2
1Arab American University, Department of Chemistry, P.O. Box 240, Jenin, Palestine
2Ministry of Agriculture, National Agricultural research Center (NARC), Jenin, Palestine
Correspondence to: Orwa Jaber Housheya, Arab American University, Department of Chemistry, P.O. Box 240, Jenin, Palestine.
| Email: |  |
Copyright © 2014 Scientific & Academic Publishing. All Rights Reserved.
The purpose of the study was to evaluate the effects of the peacock-eye disease and the fruit-fly infection on the quality of olive oil, and measure how these diseases might influence the concentration of ∆7 Stigmasterol content in the oil. The study was begun by collecting Nabali-Baladi variety of olives from the northern governorates of Palestine (85% of olive trees in the north is Nabali-Baladi). The olives picked had a specific percentage of infection from peacock and fruit-fly. Olives were collected from the 2011 and the 2012 seasons. Olive samples were pressed using a two cycle olive oil mill to extract the oil. The unsoapenifable ∆7 Stigmasterol was isolated from the olive oil taken from the samples within the study area. Then, the concentration of the ∆7 Stigmasterol was evaluated using a GC-MS instrument. Area under the peak of ∆7 Stigmasterol was compared to that of a standard GC trace and the concentration was calculated from the calibration curve. The unsoapenifable Δ7 Stigmasterol was isolated from the olive oil taken from the samples within the study area. Then, the concentration of the Δ7 Stigmasterol was evaluated using a GC-MS instrument and correlated with the diseases. The level of Δ-7- Stigmasterol contained in olive oil was within the IOC limits. The Δ7 Stigmasterol concentration ranged from 0.015 to 0.47 with average of 0.28 for all samples.
Keywords: Palestine olive oil, Peacock eye, Fruit fly, Δ-7-Stigmasterol
Cite this paper: Orwa Jaber Housheya, Mohamad AbuEid, Odayy Zaid, Motasem Zaid, Omaya Hamad, Majed Yasin Jeneedi, The Influence of Peacock-eye Disease and Fruit-fly Infection on Olive Oil ∆7 Stigmasterol in Northern West Bank, International Journal of Ecosystem, Vol. 4 No. 4, 2014, pp. 184-189. doi: 10.5923/j.ije.20140404.04.
Article Outline
1. Introduction
- This Olive oil plays an essential part of the Mediterranean diet. This oil has several complex chemical components. The composition of olive oil can give valuable information in understanding their functional, quality and nutritional properties. It also can be used as a fingerprint for reliable identification and classification of olive oils according to the olive variety and the geographic origin. Several studies have correlated the chemical components of olive oil geographic origin [1-6] frequently determined by chromatographic methods. Among the most interesting healthy constituents in olive oil is the sterols class. The level of this type of sterol, especially the D-7 stigma sterol has been the subject of a recent paper that reported a slight increase of Δ-7-Stigmasterol in Palestinian oil [7]. Therefore, the aim of our research study the influence of peacock eye disease and fly-infection on Δ-7-Stigmasterol Palestinian olive oil. The origin, cultivar, extraction technology, condition of ripening of the fruit, climatic conditions, and rainfall all influence biosynthesis within the fruit which can influence the composition and quality of the oil. Olive oil is an integral part of the Palestinian economy. About 95% of the olives picked in the Palestinian territories is converted to olive oil, most of which is exported internationally. However, there are several obstacles facing olive oil exports. One of which is the compliance with international standards that deal with oil composition and quality. Olive oil chemical content can be divided into two main categories: major components and minor components.The major component of olive oil is called glycerides that account for 98.5 to 99.5% of the oil. These glycerides are distributed among three types: Triaceylglycerol, 97-98%, Diaceylglycerols 2-3%, and Monoacyglycerols 0.1-0.2%.The minor components represent a range of 0.5 to 1.5% of the olive oil. The minor components can be described as Squalene, Alcohols, Sterols, Phenols, Tocopehrols, Phospholipids, Pigments, and other volatile compounds. Sterols account for about 80 to 260 milligram per 100 gram of oil contents. Of the total sterols, β-sitosterol represents 65-97%, Δ-5-Avenasterol represents 5-31%, Camperstrol represents 2-4% and finally Δ-7-Stigmasterol can range from 0.0-0.8%. The Sterols have high molecular weight and contains a number of aromatic rings. It is considered non saponifiable material that have elevated melting point, and is considered one of the most important materials non-saponification in vegetable oils, fats and grease which are of different crystalline forms.Olive oil has to adhere to these international standards, otherwise it could be judged as an adulterated oil especially if the levels of D-7 stigmasterol is higher than 0.5 %. Most of the studies on Δ-7-Stigmasterol showed a wide range of fluctuation of the Δ-7-Stigmasterol concentration in olive oil produced due to a number of factors. [7, 13] the aim of this study was to evaluate low incidence from peacock eye disease and olive fruit fly infections on Δ-7-Stigmasterol concentration. The peacock eye disease is fungal olive leaf pathogen, which causes of the disease of olive peacock spot, also known as olive leaf spot and bird's eye spot as shown in top part of picture 1. The olive fruit infections comes from the fly that is called Bactrocera oleae, which lays its eggs inside the fruit. Its larvae results in damaging the olive fruits as shown the middle af bottom parts of picture 1.
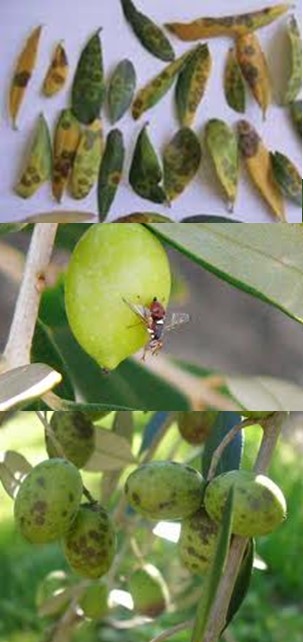 | Picture 1. Illustration of the peacock eye disease and the fruit fly infection |
2. Methodology
- The study focused on peacock eye disease and fly-infection parameters that might have influence on the concentration of D-7 stigmasterol in olive oil. The project was initiated by collecting “Nabali Baladi” olive fruits from three different governorates in Palestine for comparison purposes: Jenin, Qalqiliya and Salfit. A total of 13 samples were collected during the harvest season. Each sample was about 20 kilograms of fresh olive fruits picked from specific trees. Each of those samples were converted into olive oil after pressing using two cycle oil press. To obtain the sterols from the seed oil, we saponified 2.5 g of sample for the SPE method and 5.0 g of sample for the TLC method, in accordance with AOCS official method Ca 6a-40. The sample was weighed into a 250 mL Erlenmeyer flask, and 30 mL of 95% ethyl alcohol and 5 mL of 26.73 M aqueous potassium hydroxide (60 g of potassium hydroxide in 40 mL of water) were added to the flask along with boiling chips. The mixture was refluxed for 1 h, cooled to room temperature, and transferred to an extraction cylinder. The flask was washed into the cylinder with two 10-mL portions of hot distilled water and two 10-mL portions of room-temperature distilled water until we collected 80 mL. The 80-mL mixture was transferred to a 250-mL separatory funnel and extracted five times with 50-mL portions of petroleum ether. Each 50-mL portion was collected into a 500-mL separatory funnel. The combined extracts were washed with four 30-mL portions of a 10% ethyl alcohol solution. The washed ether extract was transferred to a 250-mL flat bottomed boiling flask, and the ether was evaporated on a steam bath under a fume hood. In preparation for the TLC method, the ether was reduced to approximately 1 mL. Isolation and recovery of the sterols by TLC: We washed the ether sterol extract with a 10% ethyl alcohol solution and then evaporated it on a steam bath until approximately 1 mL of solution was left. Throughout the tests, we used commercially prepared, 20 cm 3 20 cm, 60-Å pore diameter, Whatman K6 silica gel TLC plates (Whatman Inc., Clifton, New Jersey) with a 250-mm layer thickness. We placed two 50- mL spots of a 100 g/L cholesterol solution in chloroform 10 mm from the left-hand and right-hand edges of the plate. The unsaponifiable compounds were spotted on the plate in a continuous line of 50-µL spots between the two cholesterol reference spots. We placed the plate in a developing tank containing chloroform as the developing solvent. The plate was left in the tank until the solvent reached a point of 10 mm from the upper edge. Then we removed the plate and allowed it to dry. The sterol fraction was identified by the two cholesterol reference spots on each edge. The sterols were scraped from the plate into a 25-mL conical flask. To extract the sterols, we placed 5 mL of ethyl ether in the flask and refluxed it gently for 15 min. The ether was filtered through 9.0-cm circles of Whatman number 5 paper into another 25-mL conical flask. The original flask then was washed by the addition of another 5 mL of ether and refluxing. This process was repeated three times. The solvent was removed from the combined filtrates under a stream of nitrogen. The sterol crystals were dissolved in a minimal amount of acetone (approximately 300 mL) and injected into the gas chromatograph for sterol composition analysis. Then, the sterols were analyzed by GC-MS according to the following procedure:Chromatographic conditions.—Analyze standards and samples according to the instrumental conditions: Column.—Capillary column, split mode (25 m × 0.32 mm) cross-linked 5% phenylmethyl silicone or methyl silicone gum; film thickness: 0.17 μm. Detector.—Hydrogen FID. Temperatures.—Column: 190°C, hold 2 min; increase 20°C/min to 230°C, hold 3 min; increase 40°C/min to 255°C, hold 25 min; injector: 250°C; detector: 300°C. Flow rates.—Carrier: 2 mL/min, split vent ca 15 mL/min, purge vent ca 3 mL/min helium (split ratio should be ∼7); makeup: 20 mL/min helium; hydrogen: 35 mL/min; air: 280 mL/min. Injection volume.—1 μL. Finally, the percent by mass of each sterol from the total sterol was calculated. A standard calibration curve is generated by using the ratio of the analyte area vs the area of the IS for each concentration level. A calibration curve is produced for each analyte. Dilute high-level test solutions to fall within the standard range 3.
3. Results and Discussion
- Sterols, such as Δ-7-Stigmasterol, are alcohols with the cyclopentanophenanthrene ring system (atoms 1 through 17 in the structure Figure 1). This substructure is also found oils and fats. Δ-7-Stigmasterol is classified as an alcohol because it has a hydroxyl group (-OH) in position 3 of the ring system.
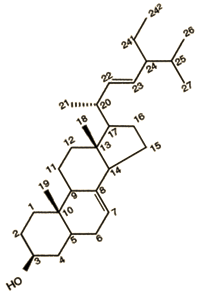 | Figure 1. Structure of D-7- stigmasterol |
 | Figure 2. GC trace sterol in a sample |
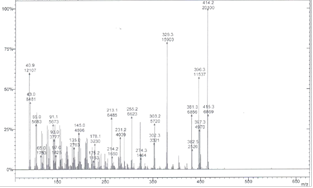 | Figure 3. MS of the corresponding GC trace in figure 1 showing the m/z at 414 and its fragment ions |
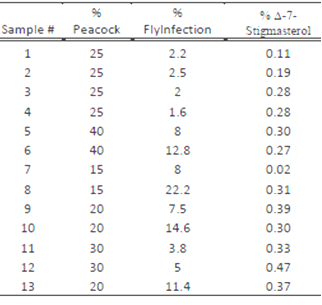
 where An is the area of the peak corresponding to sterol “n” and ΣA is the sum of the total sterol peak areas. The concentration of the sample was figured out by multiplying the integrated area under the peak for the sample by concentration of the standard divided by the integrated area under the peak for the standard. Table 1 shows the code for each sample and the location at which each sample was collected. Table 2 summarizes the percent of infection in and the percent Δ-7-Stigmasterol in each sample. The Δ-7-Stigmasterol concentration was below 0.5% for each geographical location. The highest Δ-7-Stigmasterol value was 0.47 % of sample number 12 and the lowest was 0.02 % for sample number 7 as shown in Figure 6.
|
|
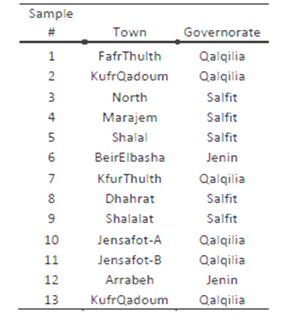
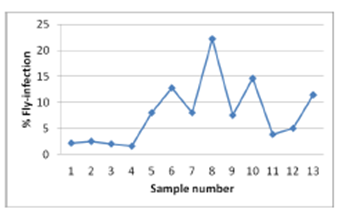 | Figure 4. Percent olive fruit fly infection in each sample |
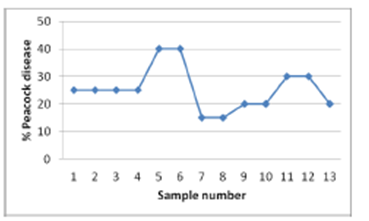 | Figure 5. Percent peacock-eye disease for each sample |
 | Figure 6. Percent Δ-7-Stigmasterol in each sample |
4. Conclusions
- The GC-MS analysis has been performed on sample with fly infection and peacock disease. The results reveals that the concentration of delta 7 stigamsterol in the Nabali Baladi samples were less than 0.5%, provided the conditions of the experiments. Regardless of the geographical location, the D-7 concentration ranged from 0.02 to 0.47%, which are within the IOC suggestions. The peacock eye disease and the olive fruit fly infection did not seem to have a great impact on the Δ-7-Stigmasterol concentration. Further studies are underway to determine the Δ-7-Stigmasterol concentration in the event we have 100% infection from olive fruit fly and 100% infection the peacock eye disease.
ACKNOWLEDGEMENTS
- The researchers are grateful for the IAO who funded this project over the past two years.