-
Paper Information
- Next Paper
- Previous Paper
- Paper Submission
-
Journal Information
- About This Journal
- Editorial Board
- Current Issue
- Archive
- Author Guidelines
- Contact Us
International Journal of Ecosystem
p-ISSN: 2165-8889 e-ISSN: 2165-8919
2014; 4(4): 170-175
doi:10.5923/j.ije.20140404.02
U-Shaped Pattern of Employees’ Job Satisfaction: Polynomial Model Approach
 Abstract
 Reference
 Full-Text PDF
 Full-text HTML
Md. Rafiqul Islam1, Md. Sabbir Hossain2, Omar Faroque3
1Department of Population Science and Human Resource Development, University of Rajshahi, Rajshahi-6205, Bangladesh
2Department of Business Administration, Bangladesh Islami University, Dhaka-1203, Bangladesh
3Department of Management, Bangabandhu Sheikh Mujibur Rahman Science & Technology University, Gopalganj-8100, Bangladesh
Correspondence to: Md. Rafiqul Islam, Department of Population Science and Human Resource Development, University of Rajshahi, Rajshahi-6205, Bangladesh.
| Email: |  |
Copyright © 2014 Scientific & Academic Publishing. All Rights Reserved.
Employee productivity, organizational citizenship, employee loyalty, efficiency etc. totally depend on job satisfaction. Job satisfaction is an important indicator of how employees adjust about their jobs. The purpose of this study is to fit some mathematical models to percentages of employees’ job satisfaction (PEJS) for men, women and both sexes. For this, the secondary data are used. Quasi Newton Method is employed to fit these mathematical models using the software STATISTICA. Moreover, t-test, F-test and cross validity prediction power (CVPP) are used to check the accuracy as well as validation of the model. In this study, it is seen that these PEJS for men, women and both sexes are showing U-shaped pattern in accordance with age. It is also found that PEJS is increasing with age after age 30 years. And it is seen that the PEJS for women is comparatively higher than that of men at every age group. Furthermore, it is found that PEJS for men, women and both sexes follow second degree polynomial models. These models are well fitted in accordance with t-test, F-test and CVPP. The stabilities of these models are more than 96.9%.
Keywords: Percentage of Employees’ Job Satisfaction (PEJS), Polynomial Model, t-test, F-test, Cross Validity Prediction Power (CVPP)
Cite this paper: Md. Rafiqul Islam, Md. Sabbir Hossain, Omar Faroque, U-Shaped Pattern of Employees’ Job Satisfaction: Polynomial Model Approach, International Journal of Ecosystem, Vol. 4 No. 4, 2014, pp. 170-175. doi: 10.5923/j.ije.20140404.02.
Article Outline
1. Introduction
- Employee productivity, organizational citizenship, employee loyalty, efficiency etc. depend on job satisfaction. Job satisfaction is an important indicator of how employees feel about their jobs and a predictor of work behaviors such as organizational citizenship (Organ & Ryan, 1995); and withdrawn behaviors such as absenteeism (Wegge et al., 2007) and turnover (Saari & Judge, 2004). Job satisfaction made optimistic contributions to the organizational effectiveness and continuous performance (Sinha, 2013) and it increases employee job involvement, organizational commitment and effective job performance (Davis & Newstrom, 2006). Job satisfaction plays an important role to reduce negative behaviors at the organization such as frequent absence, indiscipline in performance and high turnover (Anitha, 2011; Rego & Cunha; 2008; Davis & Newstrom, 2006; Spector, 1997). Job satisfaction among the employees shapes genial and supportive working environment in the organizational level. Satisfied employees work more hours with better efficiency compared to unsatisfied employees (Sohail & Delin, 2013) and unsatisfied employees always try to switch their organization or profession (Smith, 2007). Job satisfaction is used to measure the intentions of employees towards their work (Sweeney et al., 2002). Actually, job satisfaction is a factor which induces employees to work in the term (Mudor & Tooksoon, 2011).Job satisfaction is a set of favorable or unfavorable feelings and emotions with which employees view their work and an effective attitude as a feeling of relative like or dislike toward something (Davis & Newstrom, 2006); an effective or emotional response by an employee concerning his or her particular job (Cranny et al., 1992); individual’s cognitive, affective and evaluative reactions towards job (Greenberg & Baron, 1997); and a collection of feelings that an individual holds toward his or her jobs (Robbins, 2005). In fact, it is ‘the extent to which people like their jobs’ (Ellickson & Logsdon, 2002; Spector, 2000); a pleasurable or positive emotional state resulting from the evaluation of one’s job experience (Locke, 1976); how an employee pleased is with his or her job (Vietoria, 2010). Job satisfaction is the combination of ‘positive or negative’ feelings of workers about their job (Brikend, 2011) and ‘cognitive and affective reactions to the differential perceptions of what an employee wants to receive compared to what he or she actually receives (Weiss, 2002). Thus, it is investigated that a number of research on job satisfaction has been done but mathematical modeling is nonexistent in this area. For that, in this paper, an attention is concentrated to observe the pattern of the percentages of employees’ job satisfaction (PEJS) using some mathematical models. To do so, a polynomial model is considered to study the pattern of PEJS for men, women and both sexes. It is mentioned that polynomial model was used in several studies (Islam and Ali, 2004; Islam, 2004a; 2004b; 2005a; 2005b; 2007a and 2011; Islam et al., 2004; Islam and Sabbir, 2014a and 2014b).Thus, the fundamental objectives of this study are addressed below:i) to study the pattern of the PEJS for men, women and both sexes, ii) to fit some mathematical models to PEJS for men, women and both sexes, and iii) to employ t-test, F-test and cross validity prediction power (CVPP) to check the accuracy as well as validation of the model.
2. Data and Data Source
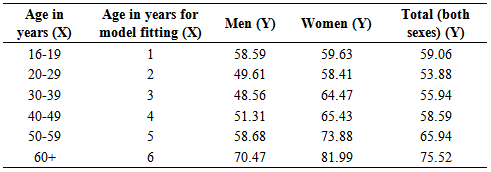
- The data are used in this paper taken from the paper of Clark et al. (1996) which are drawn from the British Household Panel Study funded by the Economic and Social Research Council. Information was obtained through interviews from the 5192 employees from a respondent’s home covering household composition, finances, personal and family backgrounds, employment characteristics, history and attitudes, and feelings of happiness and general mental health. The percentages of employees’ job satisfaction (PEJS) for men, women and both sexes by ages are presented in Table 1.
|
3. Methods and Methodological Issues
3.1. Model Fitting
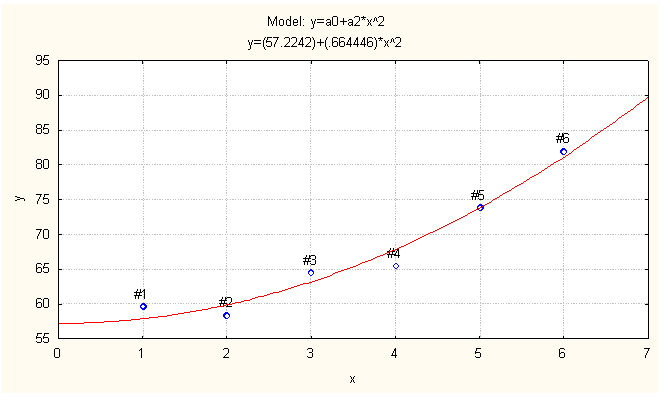
- Using the scattered plots (Fig.1-Fig.3) of PEJS by age, these seem that the data can be fitted by polynomial models with respect to different ages in years. Therefore, an nth degree polynomial model is considered and the form of the model is
 ;where, x indicates age group; y is PEJS;
  is the constant;
  is the coefficient of
  (i =1, 2, 3, ..., n) and u is the disturbance term of the model. Here, a suitable n is found for which the error sum of square is minimum.
  | Figure 1. Observed and Fitted PEJS for Men. X: Age in Years and Y: PEJS |
 | Figure 2. Observed and Fitted PEJS for Women. X: Age in Years and Y: PEJS |
 | Figure 3. Observed and Fitted PEJS for Both Sexes. X: Age in Years and Y: PEJS |
3.2. Model Validation Technique
- To check how much these models are stable over population, the cross validity prediction power (CVPP),
 , is applied. Here
  (Stevens, 1996)where, n is the number of cases, k is the number of predictors in the model and the cross validated R is the correlation between observed and predicted values of the dependent variable. The shrinkage coefficient of the model is the positive value of (
 - R2); where
  is CVPP and R2 is the coefficient of determination of the model. 1-shrinkage is the stability of R2 of the model. The information on model fittings and estimated CVPP have been demonstrated in Table 2. This technique is also used as model validation technique (Islam, 2007b; 2008; 2012a; 2012b; 2013; Islam & Hossain, 2013a; 2013b; Hossain & Islam, 2013; Islam et al., 2013).
3.3. F-test
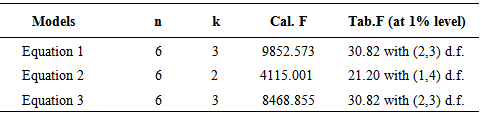
- To verify the measure of overall significance of the model as well as the significance of R2, the F-test is employed here. The formula for F-test is given below:
 where k = the number of parameters is to be estimated, n = the number of cases and R2 is the coefficient of determination of the model (Gujarati, 1998). These estimates are shown in Table 3.
4. Results and Discussion
- Employee satisfaction is typically measured using an employee satisfaction survey. These surveys address topics such as compensation, workload, perceptions of management, flexibility, teamwork, resources, etc. The PEJS by age and sex is presented in Table 1. It is observed that job satisfaction is very high for the people age above 60 years. And it is investigated that the PEJS for women is comparatively higher than that of men at each cases. The modeling approaches for the percentages of employees’ job satisfaction (PEJS) for men, women and both sexes are discussed below.The polynomial model is constructed for PEJS for men and the fitted equation is as follows:
 | (1) |
 | (2) |
 | (3) |
 corresponding to their
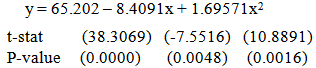
  are shown in Table 2. The observed and fitted values are depicted in Figure 1 to Figure 3. In this table, all fitted models from equation (1) to equation (3) are highly cross validated and their shrinkage’s are very small. Moreover, it is observed that all the parameters of the fitted models are statistically significant in terms of t-test with large proportion of variation explained and their proportion of variation are more than 99%, 96% and 99% respectively. And the stabilities of these models are more than 97%, 93% and 96% respectively. The stabilities of of these models are also more than 96.9%. The calculated values of F-statistic of the models (1) to (3) and their corresponding tabulated values at 1% level of significance are shown in Table 3. Therefore, from these statistics it is concluded that all these constructed models are highly statistically significant. Hence, the fits of all these models are well.
|

|
5. Conclusions
- In this study, it is found that job satisfaction is U-shaped for men, women and both sexes. It is also observed that job satisfaction is increasing after age 30 years. And it is seen that the PEJS for women is comparatively upper than that of men at every age group. Also it is investigated that PEJS for men, women and both sexes follow quadratic polynomial models with explaining large proportion of variance. The stabilities of these models are more than 93%. Moreover, the stabilities of of these models are more than 96.9%. It is found that the overall significance of these models is very high due to F-statistics.