Md. Rafiqul Islam 1, Md. Sabbir Hossain 2
1Professor and Ex-Chairman, Department of Population Science and Human Resource Development University of Rajshahi, Bangladesh
2Department of Business Administration, Bangladesh Islami University, Dhaka, Bangladesh
Correspondence to: Md. Rafiqul Islam , Professor and Ex-Chairman, Department of Population Science and Human Resource Development University of Rajshahi, Bangladesh.
| Email: |  |
Copyright © 2014 Scientific & Academic Publishing. All Rights Reserved.
Abstract
Comprehensive, reliable and timely data on literacy rate is important for formulating policies and improving the state of literacy level in a country. The purpose of this study is to estimate age specific adult literacy rates (ASALRs) for male, female and both sexes population of urban area in Bangladesh. And, to fit some mathematical models to these ASALRs and their forward cumulative distribution. For this, the secondary data on literacy number and corresponding population obtained from population census 2001 are used to fulfill these objectives. Quasi Newton Method is employed for the estimation of these models. F-test, t-test and cross validity prediction power (CVPP) are also applied to check the accuracy of these fitted models. It is found that all the curves are showing decreasing with increase of ages. After all, it is found that ASALRs for male, female and both sexes of urban area in Bangladesh follow third degree polynomial model. And their forward cumulative distribution follow second degree polynomial model. It is observed that the models are well fitted in accordance with t-test, F-test and CVPP. The stability of all these models is more than 97%. The result of this study will help to increase literacy rates of urban area by using effective steps or strategies.
Keywords:
Age specific adult literacy rates (ASALRs), Polynomial model, Quasi Newton Method, Smoothing technique, Cross validity prediction power (CVPP), t-test and F-test
Cite this paper: Md. Rafiqul Islam , Md. Sabbir Hossain , Some Models Associated with Age Specific Adult Literacy Rates of Urban Area in Bangladesh, International Journal of Ecosystem, Vol. 4 No. 2, 2014, pp. 66-74. doi: 10.5923/j.ije.20140402.04.
1. Introduction
The term literacy is related with prosperity of health, nutritional status, economic growth, population control, empowerment of women and improvement of weaker section of the society. From the independence of Bangladesh, many new and new policies were taken in both Government and private level to expand literacy and remove illiteracy. The common situation of Bangladesh is the uneven distribution of wealth, income, resources and social services such as health, education and housing and any other opportunities which are necessary to sustain a normal and healthy life in any rural or urban area of a country. Poverty and unemployment are the main problem for the poor majority living in the area of rural or urban area. Government and NGOs are trying to promote education as an important social indicator to enhance the level of literacy which is still very low among low income group in Bangladesh. There is no alternative way for overall development of a country without the improvement of literacy. And development is a set of achievements that include reducing poverty and hunger, achieving universal primary education and gender equality, reducing infant and child mortality and maternal mortality, reversing the spread of HIV/AIDS and other communicable diseases (IMF, 2005). In Bangladesh, literacy rates available from different surveys and studies are significantly different. This is mainly due to the fact that the definition of a literate person is not uniform and standardized. Low level of literacy has not only been a source of poverty. Lack of a literate workforce of aged 15 and above is the main cause of house-hold poverty. The literate population of aged 15 and above is mentioned as adult literate population. The estimated population of Bangladesh in 2001 was 123.85 million. The percentages of urban and rural population are 23.1 and 76.9 respectively. It has an area of 147,570 square kilometers. The adult literacy rates for male and female of the urban area in Bangladesh, 2001 are 70% and 57.4% respectively and for rural area are 48% and 36.5% respectively (BBS, 2012). It is observed that male-female differences of rural and urban area are 12.6% and 11.5% respectively while rural-urban difference is remarkable high. Difference in literacy rates between Muslims and non-Muslims was small in rural areas compared to the difference between two religious groups in the urban areas. The literacy rate of non-Muslim is significantly higher than that of Muslims in urban area. The difference was maximum in Barisal and Rajshahi urban areas (BBS, 2008). Moreover, Islam and Hossain (2013a) reported that ASALRs for male, female and both sexes population of rural area follow third degree polynomial model. And their forward cumulative distribution follow second degree polynomial model.Therefore, the main objectives of this study are addressed below:i) to estimate ASALRs for male, female and both sexes population of urban area in Bangladesh in 2001,ii) to assess the level and pattern of ASALRs for male, female and both sexes population of urban area in Bangladesh in 2001, andiii) to fit some mathematical models to ASALRs and forward cumulative ASALRs for male, female and both sexes population of urban area in Bangladesh in 2001.
2. Data and Data Source
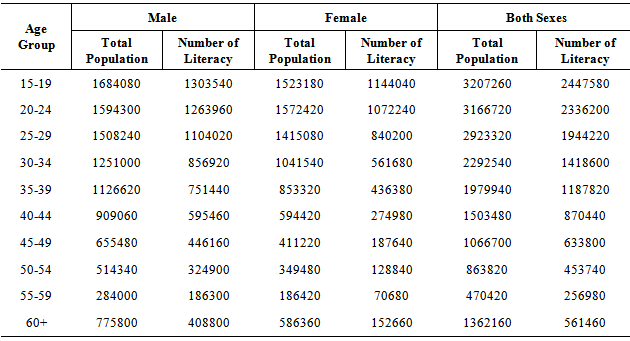
A secondary data on adult literacy number and their corresponding population due to age for the estimation of ASALRs for male, female and both sexes population of urban area in Bangladesh have been taken from Population Census 2001 (BBS, 2003) which is shown in Table 1. Table 1. Age Specific Adult Literacy Rates by Sex of Urban Area, 2001
 |
| |
|
3. Methods and Methodological Issues
3.1. Estimation of ASALRs
To estimate ASALRs for male, female and both sexes population of urban area, the following formula is used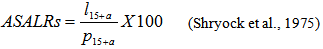 where
where  is the number of literates of urban area in age group 15+a and
  is the population of urban area in age group 15+a. These estimated ASALRs are demonstrated in Table 2.
Table 2. Observed and Smoothed ASALRs by sex of Urban Area, 2001
 |
| |
|
3.2. Smoothing of Age Data Related to ASALRs
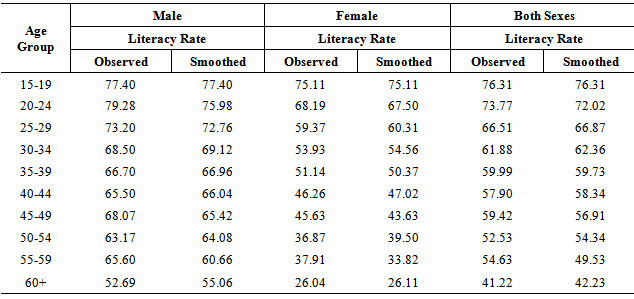
It is observed that there is some kind of unexpected distortions in the data aggregate when the data on ASALRs for male, female and both sexes of urban area in Bangladesh by age group is put on graph paper. Therefore, an adjustment is important and needed to lessen these unpredicted distortions before going to fit the models to these data. As a consequence, a modification is made here using the Package Minitab Release 12.1 by the most up-to-date smoothing technique “4253H, twice” (Velleman, 1980). After that, the smoothed data are used to fit model for male, female and both sexes population of urban area in Bangladesh and these smoothed data is launched in Table 2 and their forward cumulative distribution are presented in Table 3.Table 3. Forward Cumulative Distribution of Smoothed ASALRs by Sex of Urban Area, 2001
 |
| |
|
3.3. Model Fitting to ASALRs
a) Using the scattered plot (Fig.1-Fig.3) of smoothed ASALRs by age group in years for male, female and both sexes population of urban area in Bangladesh, it seems that smoothed ASALRs for male, female and both sexes of urban area in Bangladesh can be fitted by polynomial model with respect to different ages. Therefore, an nth degree polynomial model is considered and the form of the model is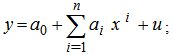 where, x is the mean value of the age group; y is smoothed ASALRs of urban area;
  is the constant;
  is the coefficient of
  (i =1, 2, 3, ..., n) and u is the disturbance term of the model. Here a suitable n is found out for which the error sum of square is minimum.
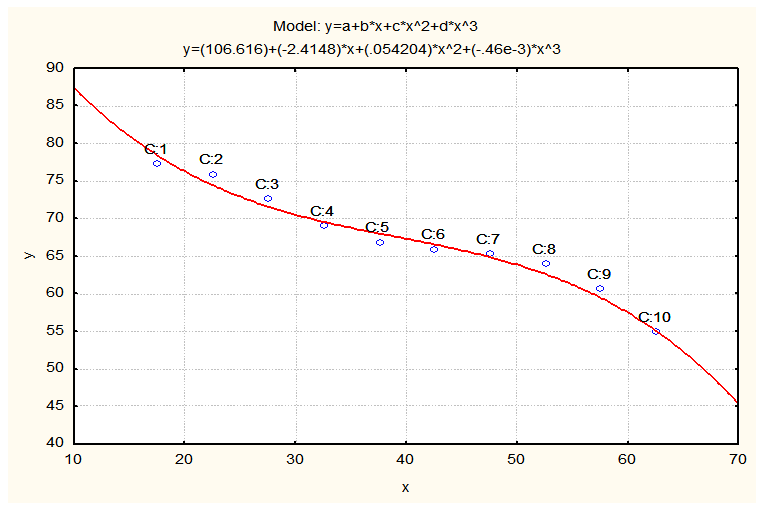 | Figure 1. Smoothed and Fitted ASALRs for Male of Urban Area in 2001. X: Age in Years and Y: Smoothed ASALRs for Male |
 | Figure 2. Smoothed and Fitted ASALRs for Female of Urban Area in 2001. X: Age in Years and Y: Smoothed ASALRs for Female |
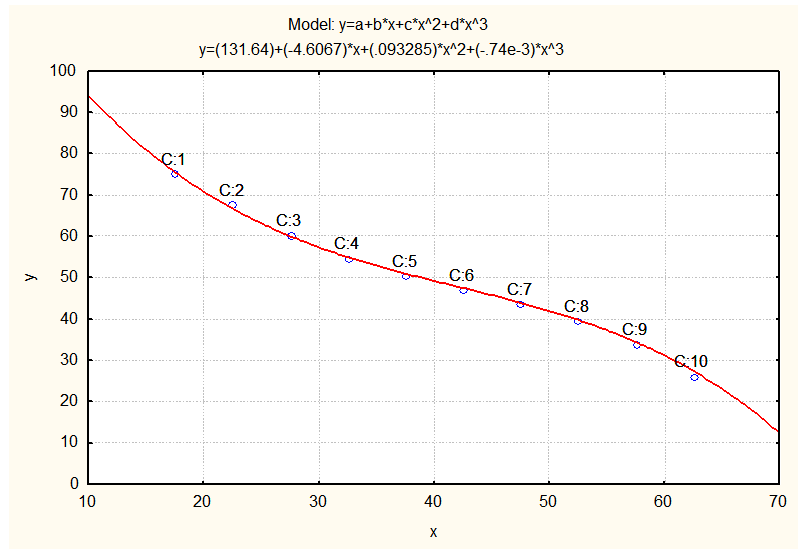
 | Figure 3. Smoothed and Fitted ASALRs for Both Sexes of Urban Area in 2001. X: Age in Years and Y: Smoothed ASALRs for Both Sexes |
b) Using the dotted plot (Fig.4 – Fig.6) of forward cumulative distribution of smoothed ASALRs for male, female and both sexes population of urban area in Bangladesh by age groups, it is observed that these follow nth degree polynomial model with respect to ages. Therefore, the structure of the model is ;where, x is the average value of the age group; y is forward cumulative distribution of smoothed ASALRs;
  is the constant;
  is the coefficient of
  (i =1, 2, 3, ..., n) and u is the disturbance term of the model. A suitable n is selected such that the error sum of square is lowest.
 | Figure 4. Smoothed and Fitted ASALRs for Male of Urban Area in 2001. X: Age in Years and Y: FCD of Smoothed ASALRs for Male |
 | Figure 5. Smoothed and Fitted ASALRs for Female of Urban Area in 2001. X: Age in Years and Y: FCD of Smoothed ASALRs for Female |
 | Figure 6. Smoothed and Fitted ASALRs for Both Sexes of Urban Area in 2001. X: Age in Years and Y: FCD of Smoothed ASALRs for Both Sexes |
The software STATISTICA was used to fit these mathematical models.
3.4. Model Validation Technique
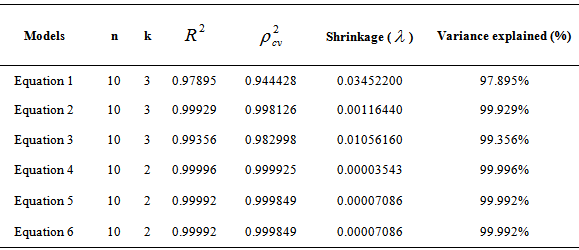
To check how much these models are stable over the population, the cross validity prediction power (CVPP),  , is applied. Here,
 ; where, n is the number of cases, k is the number of predictors in the model and the cross validated R is the correlation between observed and predicted values of the dependent variable (Stevens, 1996). The shrinkage coefficient of the model is the positive value of (
 -R2); where
  is CVPP and R2 is the coefficient of determination of the model. λ=1-shrinkage is the stability of R2 of the model. The information on model fittings and estimated CVPP has been demonstrated in Table 4. Note that CVPP was also employed as model validation or accuracy test (Islam, 2005a; 2007a; 2008; 2011; 2012a; 2013; Islam and Hossain, 2013b; and Islam et al., 2004 and 2013).
3.5. F-test
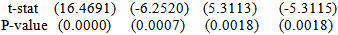
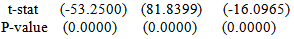
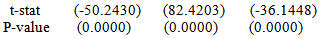
To verify the measure of the overall significance of the model as well as the significance of R2, the F-test is employed here. The formula for F-test is given below: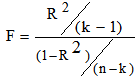 where k = the number of parameters is to be estimated, n = the number of cases and R2 is the coefficient of determination in the model (Gujarati, 1998). The information of F-test is shown in Table 5. Islam (2005b; 2007b and 2012b) and Hossain and Islam (2013) used F-test as overall significance of a model.
4. Results and Discussion
The ASALRs for male, female and both sexes population of urban area in Bangladesh in 2001 have been estimated and presented in the Table 2 and their smoothed data are also shown in Table 2. To see the level and pattern of smoothed ASALRs for male, female and both sexes population of urban area in Bangladesh, the data have been plotted in graph paper which is shown in Fig. 7. It is found that the ASALRs for male, female and both sexes are showing gradually decreasing curve with increase of age as the tradition of Bangladesh. The adult literacy rates for male population of urban area in 1974, 1981 and 1991 were 62.5%, 58% and 62.5%; for female population 33.1%, 34.1% and 44% respectively. And the adult literacy rates for male population of rural area in 1974, 1981 and 1991 were 34.6%, 35.4% and 38.7%; for female population 12.1%, 15.3% and 21.5% respectively (BBS, 2003). As usual, urban population is more literate than rural population. But, the urban-rural variation of adult literacy rates for male population in 1974, 1981, 1991 and 2001 were 27.9, 22.6, 23.8 and 22; and for female population were 21, 18.8, 22.5 and 20.9 respectively. In literature, it is seen that adult literacy rate of urban area is always more than that of rural area. The urban-rural variation of adult literacy rates for male population is almost declining from census 1974 to census 2001. Table 3 is prepared for forward cumulative distribution of smoothed ASALRs for male, female and both sexes population of urban area in Bangladesh and which help to take clear concept about the total ASALRs of urban area at every age group.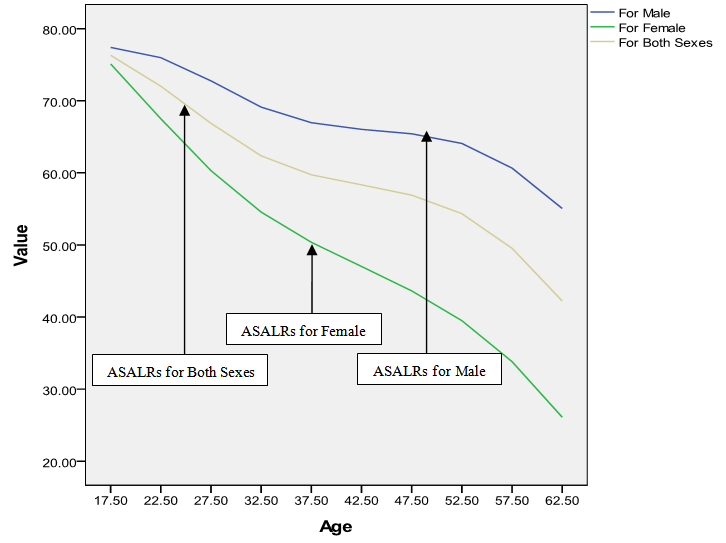 | Figure 7. Smoothed ASALRs for Male, Female and Both Sexes Population of Urban Area in 2001 |
The polynomial model is constructed for smoothed ASALRs of urban area for male population of Bangladesh in 2001 and the fitted equation is  | (1) |
 Again, another polynomial model is fitted for smoothed ASALRs of urban area for female population of Bangladesh in 2001 and the model is as follows:
 | (2) |
 The equation for smoothed ASALRs of urban area for both sexes population of Bangladesh in 2001 is
  | (3) |
 Furthermore, the fitted equation for FCD of smoothed ASALRs of urban area for male population of Bangladesh in 2001 is as follows:
 | (4) |
 Again, another polynomial model is fitted for FCD of smoothed ASALRs of urban area for female population of Bangladesh in 2001 and the equation is given by
 | (5) |
 Finally, the fitted equation for FCD of smoothed ASALRs of urban area for both sexes population of Bangladesh in 2001 is
 | (6) |
 The estimated CVPP,
  corresponding to their
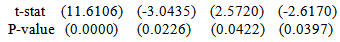
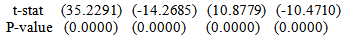
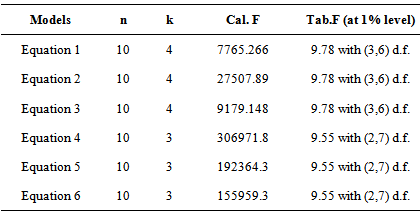
  are shown in Table 4. The observed and fitted values are depicted in Figure 1 to Figure 6. In this table, all the fitted models are highly cross validated and their shrinkage’s are very small. Moreover, it is observed that all the parameters of all these fitted models are highly statistically significant with large proportion of variation explained. The calculated values of F-statistic of the models (1) to (6) are 7765.266 with (3, 6) degrees of freedom (d.f.), 27507.89 with (3, 6) d.f., 9179.148 with (3, 6) d.f., 306971.8 with (2, 7) d.f., 192364.3 with (2, 7) d.f., 155959.3 with (2, 7) d.f. respectively where as the corresponding tabulated values are only 9.78, 9.78, 9.78, 9.55, 9.55 and 9.55 at 1% level of significance, respectively. Therefore, from these statistics it is concluded that overall significance of all these models are highly statistically significant. Hence, the fits of all these models are well.
Table 4. Information on Model Fitting and Estimated CVPP of the Predicted Equations of Smoothed ASALRs and its Forward Cumulative Distribution of Bangladesh in 2001
 |
| |
|
Table 5. The Information of Calculated and Tabulated F of the Predicted Equations of Smoothed ASALRs and its Forward Cumulative Distribution of Bangladesh in 2001
 |
| |
|
5. Conclusions
In this study, literacy rates at the age 15-19 for male, female and both sexes population of urban area in Bangladesh are 77.4%, 75.11% and 76.31% respectively. As usual it is observed that ASALRs for male population of urban area is higher than that of female population at all ages. But, male-female variation of ASALRs is very high at the age 55 years and above whereas it is negligible at the age 15-19. In addition, the ASALRs of urban area for male, female and both sexes population follow cubic polynomial models containing four parameters but FCD of ASALRs of urban area for male, female and both sexes population follow quadratic polynomial models with three parameters. Government, different NGOs and development agencies should expand and accelerate their efforts to develop education to increase the literacy rates especially female literacy rates which are linked to poverty reduction and overall development of the country. It is not necessary that a person should receive any formal education or pass any minimum education standard. Number of literacy can also be increased through adult literacy training or any non-formal education system. This research will keep contribution to researchers and educators to observe continuous tradition and investigate literacy challenges in Bangladesh.
References
| [1] | BBS. (2003). Population Census 2001, National Report, Government of the People’s Republic of Bangladesh, Dhaka. |
| [2] | BBS. (2008). Literacy Assessment Survey 2008, Bangladesh Bureau of Statistics, Government of the People’s Republic of Bangladesh, Dhaka. |
| [3] | BBS. (2012). Statistical Year Book of Bangladesh 2011, Government of the People’s Republic of Bangladesh, Dhaka. |
| [4] | Gujarati, Damodar N. (1998). Basic Econometrics, Third Edition, McGraw Hill, Inc., New York. |
| [5] | IMF. (2005). Bangladesh: Poverty Reduction Strategy Paper, November 2005, IMF Country Report No. 05/410. |
| [6] | Islam, Md. Rafiqul, Md. Nurul Islam and M. Mujibur Rahman (2004) Trends and Patterns of Reproductivity Decline in Bangladesh: 1956-1998, Man in India, Vol. 84, No. 1 & 2, pp. 85-97. |
| [7] | Islam, M. R. (2005a) Construction of abridged life tables and indirect estimation of some mortality measures of Bangladesh in 2005. Journal of Population, Indonesia 11(2), 117-130. |
| [8] | Islam, Md. Rafiqul (2005b) Mathematical Modeling of Age Specific Marital Fertility Rates in Urban Area of Bangladesh, Pakistan J. of Statistics, Vol. 21, No. 3, pp. 289-295. |
| [9] | Islam, Rafiqul. 2007a. Predicting Population for Male of Rural Area in Bangladesh, J. of Statistical Research of Iran, Vol. 4(2): 227-238. |
| [10] | Islam, Md. Rafiqul. 2007b. Construction of Abridged Life Tables and Indirect Estimation of some mortality measures of Bangladesh in 2005, Journal of Population, Indonesia, V. 11, No. 2, pp. 117-130. |
| [11] | Islam, Rafiqul. 2008. Modeling Age Structure for Female Population in Rural Area of Bangladesh. J. of Interdisciplinary Mathematics, Vol. 11(1): 29-37. |
| [12] | Islam, M. R. (2011) Modeling of diabetic patients associated with age: Polynomial model approach. International Journal of Statistics and Applications 1(1), 1-5. |
| [13] | Islam, M. R. (2012a) Mathematical modeling of age and of income distribution associated with female marriage migration in Rajshahi, Bangladesh. Research Journal of Applied Sciences, Engineering and Technology 4(17), 3125-3129. |
| [14] | Islam, Md. Rafiqul (2012b). Modeling and Projecting Population for Muslim of Urban Area in Bangladesh, International Journal of Probability and Statistics, Vol. 1(1): 4-10. |
| [15] | Islam, M. R. (2013) Modeling age structure and ASDRs for human population of both sexes in Bangladesh. International Journal of Anthropology. 28 (1), 47-53. |
| [16] | Islam, Md. Rafiqul and Md. Sabbir Hossain. (2013a). Mathematical Modeling of Age Specific Adult Literacy Rates of Rural Area in Bangladesh, American Open Demography Journal, Vol. 1(1): PP: 01 - 12. |
| [17] | Islam, Md. Rafiqul and Md. Sabbir Hossain. (2013b). Mathematical Modeling of Age Specific Participation Rates in Bangladesh, International Journal of Scientific and Innovative Mathematical Research (IJSIMR), Vol. 1(2): 150-159. |
| [18] | Islam, Md. Rafiqul, M. Korban Ali and Md. Nurul Islam (2013). Construction of Life Table and Some Mathematical Models for Male Population of Bangladesh, American Journal of Computational and Applied Mathematics, Vol. 3(6): 269-276. |
| [19] | Hossain, Md. Sabbir and Md. Rafiqul Islam (2013). Age Specific Participation Rates of Curacao in 2011: Modeling Approach, American Open Computational and Applied Mathematics Journal, Vol. 1, No. 2, PP: 08 - 21. |
| [20] | Shryock, H.S, Siegel, J.S. and Associates. 1975. The Methods and Materials of Demography, Vol. I & II, U.S. Government Printing Office, Washington, 1973. |
| [21] | Stevens, J. 1996. Applied Multivariate Statistics for the Social Sciences, Third Edition, Lawrence Erlbaum Associates, Inc., Publishers, New Jersey. |
| [22] | Velleman, P. F. 1980. Definition and Comparison of Robust Nonlinear Data Smoothing Algorithms, Journal of the American Statistical Association, Vol. 75. Number 371, PP 609-615. |
 Abstract
 Reference
 Full-Text PDF
 Full-text HTML