-
Paper Information
- Paper Submission
-
Journal Information
- About This Journal
- Editorial Board
- Current Issue
- Archive
- Author Guidelines
- Contact Us
International Journal of Ecosystem
p-ISSN: 2165-8889 e-ISSN: 2165-8919
2014; 4(2): 43-52
doi:10.5923/j.ije.20140402.01
Dynamics of Watershed Ecosystem Values and Sustainability: An Integrated Assessment Approach
 Abstract
 Reference
 Full-Text PDF
 Full-text HTML
Aloyce S. Hepelwa
Department of Economics, University of Dar es Salaam, Dar es Salaam, +255, Tanzania
Correspondence to: Aloyce S. Hepelwa , Department of Economics, University of Dar es Salaam, Dar es Salaam, +255, Tanzania.
| Email: |  |
Copyright © 2014 Scientific & Academic Publishing. All Rights Reserved.
In this work, we undertook an integrated assessment of water and forest ecosystem to develop the value-based sustainability indicators (VBSI) of watershed resource. This is a new approach proposed to be used to gauge the sustainability of ecosystems goods and services by taking into account the economic values to the local community in place. A conservation idea as implied in the concept of payment for environmental services (PES) through the willingness to pay (WTP) is used to define the sustainability indicators. We employed the DPSIR - Driving forces - Pressure – State – Impact - Response and the Total Economic Value (TEV) frameworks in the process of establishing the VBSI. A multi stage regression analysis was employed to establish environmental, economic and demographic attributes influencing the willingness to pay. The study estimated the marginal effect of each variable on the ecosystem value and these were aggregated to establish the VBSI. We defined and classified watershed resource sustainability indicators based on predictors of ecosystem values represented by the WTP premium in the study area. We argue that extending the horizon to include the economic values when instituting the sustainable watershed resource management is paramount. We estimated the VBSI (=0.25), which was below the average VBSI (=0.5) threshold for the sustainable state. This result indicated that, the watershed ecosystem in the study area not sustainable. Deliberate efforts were needed to address the water resource management in the area.
Keywords: Ecosystem value, Sustainability indictors, Watershed
Cite this paper: Aloyce S. Hepelwa , Dynamics of Watershed Ecosystem Values and Sustainability: An Integrated Assessment Approach, International Journal of Ecosystem, Vol. 4 No. 2, 2014, pp. 43-52. doi: 10.5923/j.ije.20140402.01.
Article Outline
1. Introduction
- Environmental resources form an important source of livelihoods worldwide. For example, in many developing countries, watersheds are the main source of livelihood to the majority of the households for goods and services including non timber forests products (NTFPs) and freshwater supply services. These resources offer avenue mostly to poor people to undertake economic activities for poverty reduction and sustainability of livelihoods [1, 2, 3]. Because of these, many watersheds are under increasing pressure and consequently they degrade due to over use. Because of high pressure due to over use, the sustainability of most of ecosystems goods and services and the livelihoods important in supporting the welfare of majority poor people is questionable. This would translate to more poverty especially to people who depend mostly on watershed resources [4]. In rural Tanzania, most people harvest wood and non-wood products (charcoal, firewood, poles, grasses, medicines, wild meat and fruits) for energy, food and income needs. The tendency has been increasing consumption demand of these products. The increasing demands of these goods exert pressure which leads to degradation of watershed ecosystems. FAO [5] estimated forest cover decrease of about 61,840 km2 in Tanzania during the period of 1990 to 2005. It is argued that such relatively high rate of forest loss during the period 1990 to 2005 was mainly due to the greater demand for energy. The main economic activity by most rural households is crop production and harvesting of watershed ecosystem goods and services. Crop output and harvested goods are for both as source of food and cash income. These activities are characterized by low productivity. In crop production for example, smallholder farmers experiences low technical efficiency [6, 7]. Due to low technical efficiency majority households engaged in the livelihoods are unable to meet households’ demands. The outcome of this has been that, households tend to increase land holdings as strategy to increase crop output (for more income and other demands). Such actions however, results to forest cover loss and thus degradation of the watershed ecosystems. This means that the state of watershed resources which forms major sources of forest resources are subject to degradation. This would therefore result to the loss of welfare of the people who gets support in terms of livelihoods by the watershed ecosystems. In Tanzania, water resources consisting of the coastline and inland water bodies provide water to domestic consumers, industry, irrigated agriculture, fisheries and hydro-power generation. Most of water in the country is abstracted and used for irrigation agriculture. It is estimated that more than 89% of water use in Tanzania is in agriculture. High dependency on water would also demand proper management of these resources. In terms of water use in agriculture, the dominant method of irrigation is the surface irrigation which is characterized by high inefficiency in irrigation water use. The overall water use efficiency in the country is at an average of about 15 – 20% [8]. In terms of natural resource management, the country experiences unsatisfactory water resources management. The pioneered integrated water resource management practices have not been at the satisfactory level. In this situation the sustainability of watershed ecosystems is jeopardized. In this paper, the quest is to present the proposed new methodology geared towards integrating information by way of constructing water resources sustainability indicators. We use the concept of sensitive conservation initiative represented by the total economic value or benefits accruing to households [9]. The study integrate biophysical attributes, economic and demographic characteristics of the households to establish the new sustainability index based on the economic valuation of water - forests ecosystem. The index is obtained from the estimates of the insurance premium that water users attach to the forest ecosystem. The outline of the rest of paper is as follows. Section 2 presents materials and methods, section 3 presents the relevant literature reviewed. Section 4 presents framework of analysis and model specification. We define and classify the value based sustainability indicator (VBSI) in section 5. Section 6 presents the data and estimation results. The policy implication and concluding remarks are given in section 7.
2. Materials and Methods
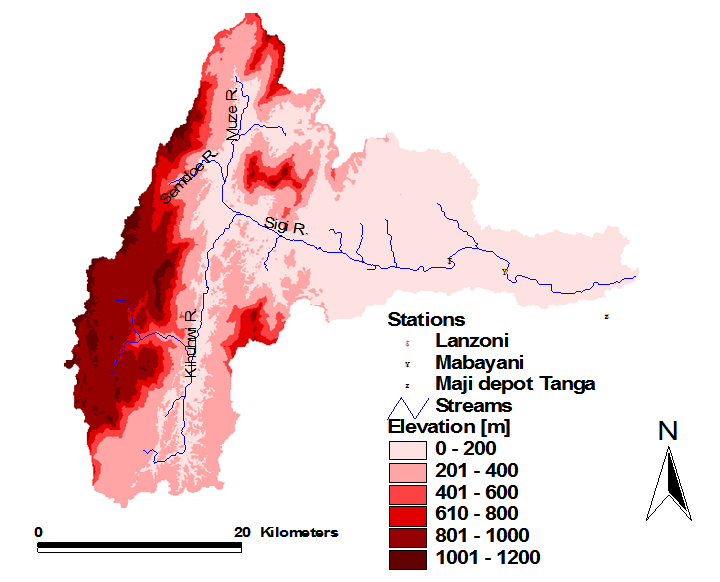
- The area for this study is the Sigi catchment, with a total area of 1100 km2. It is located between latitude 4° 80' and 5° 26' S and longitude 38° 58' and 39° 10' E in Tanga region, the North Eastern part of Tanzania (Figure 1). The basin is situated on the eastern slopes of the of the East Usambara mountain block of the Eastern Arc Mountain forests, at altitudes between 2 and 1200m above mean sea level. The basin comprises most of the forests of the East Usambara Mountain. These forests occupy most of the upstream of the basin.The watershed is formed by the permanent and seasonal rivers. Many rivers are small and highly dependent on rainfall variability. The permanent rivers include Kihuhwi, Semdoe, Muze and the Sigi River (Figure 2). All rivers flow from different sources and joins to form the main Sigi River. The Sigi River flows throughout the year to the Indian Ocean. The average monthly flow peaks occur in the period of April – June and in October – December and the annual average flow is 431mm.
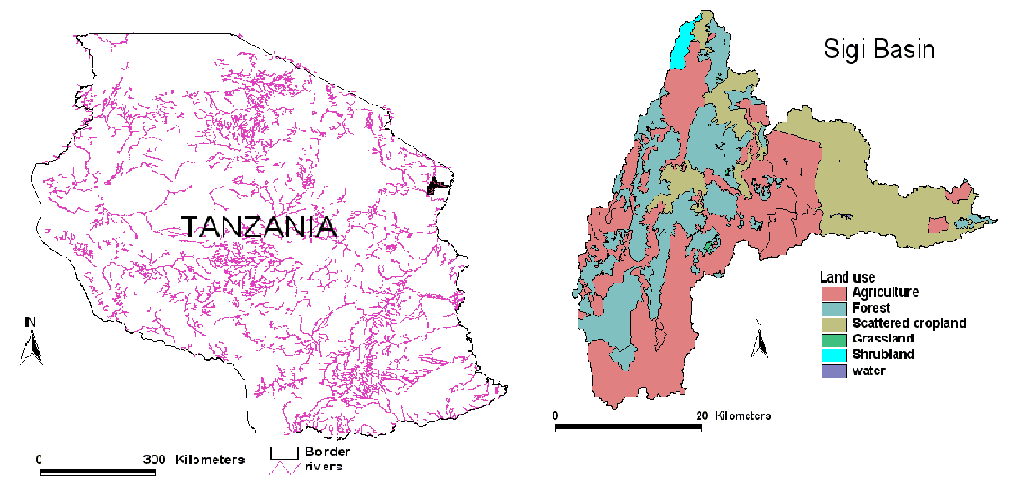 | Figure 1. Location of the study area in Tanzania |
3. Review of Relevant Literature
- Since early 1960s, efforts have been underway to develop a set of indicators and indices for water resources. Indicators have been used for a long time as a tool with which more information can be obtained about issues as varied as people’s health, weather, and economic welfare. Economists have used indicators to explain economic trends, a typical example being Gross National Product, but have only fairly recently been introduced to determine the sustainability of environmental systems as required by Agenda 21 [11,12, 13, 14, 15,16, 17, 18]. In water related indicators, the early efforts of UNESCO’s International Hydrological Decade, subsequent International Hydrology Programme (IHP) phases, FAO, IAEA and UNEP as well as professional organizations have produced several important methodological guidelines toward indicator development Water resources sustainability indicators include Water Poverty Index (WPI) by Sullivan [19], Environment Sustainability Index (ESI) by Esty & Levy [20], Canadian Water Sustainability Index (CWSI) by Policy Research Initiative (Policy Research Initiative, [21] and Watershed Sustainability Index (WSI) by Chaves and Alipaz [22]. Recently, UNESCO’s International Hydrologic Program-IHP adopted a framework which includes hydrology, environment, life, and policy (HELP) issues. The aim of this framework (the HELP platform) was to break the so called “paradigm lock” which hinders effective and integrated actions by different basin stakeholders [23]. The HELP index is a watershed specific index that takes into account cause-effect relationships and considers policy responses implemented in a given period as part of the basin’s sustainability [22]. Such many indicators have been subjected to criticism. For example the WPI a Water Poverty Index-WPI was developed [24] found to have strong correlation with the human development. The ESI is reported to lack practical credibility due to the high number of indicators and variables hinders its applicability in data-scarce regions. The ESI uses 5 components, comprising 21 indicators and 76 variables. The criticism for most of water related indices is that, they are not dynamic because they fail to take into account cause – effect relationship or consider policy responses that are implemented in a given watershed in a given year. Also majority environmental and water scarcity indices in the literature, are not basin-specific, and do not aim to access basin sustainability with respect to integrated water resources management, nor span the different variables of the problem. It should be noted that most indicator initiatives have been aimed at providing information at a national level for state-of-the-environment reporting [25, 26, 27, 28] or for answering specific policy questions at national and international levels [29, 30, 31]. This is a wakeup call to have down scaled indicators at small unit of analysis to address specific issue such as catchment level/watershed for water and forest resource management. The value based indicators for the sustainability of the natural resources are scant and therefore the motivation behind this paper is present the value based sustainability indicator recently developed at the watershed scale.
4. Methodology and Framework of Analysis
- We used indicator frameworks that provide the means to structure sets of indicators in a manner that facilitates their interpretation. We use the cause – effect framework where the relationship between environment and communities is shown and the variables to quantify the link are observed. We include the poverty level of communities in the study area being a main driver for communities to harvest watershed resources. In this area, communities harvest forest resources for both income and food and medicine and thus exerting pressure in the water and forests. We center on the idea of the catchment protection to ensure continued and increased water availability and supply to the people in the area. In addition, the TEV framework is used in estimating ecosystem values. The abstraction of water and harvesting other wood products in the watershed reflects ecosystem value to the community. Thus ecosystem goods and services need to be managed so that the benefits provided now will also be available in future. The conservation of these ecosystems is therefore important and that the local community has to be part of the management. The willingness to pay for conservation is assumed to reflect the participation of local community to the conservation of the watershed ecosystem. The main assumption is that, people are able to participate in the protection of the ecosystem if they perceive existence of the increased provision of goods and services from such an ecosystem as a result from their efforts made. As goods and services increases and therefore, utility will be higher and become a motivating factor to choose for contributing for the conservation, otherwise, they will not.
4.1. Empirical Model
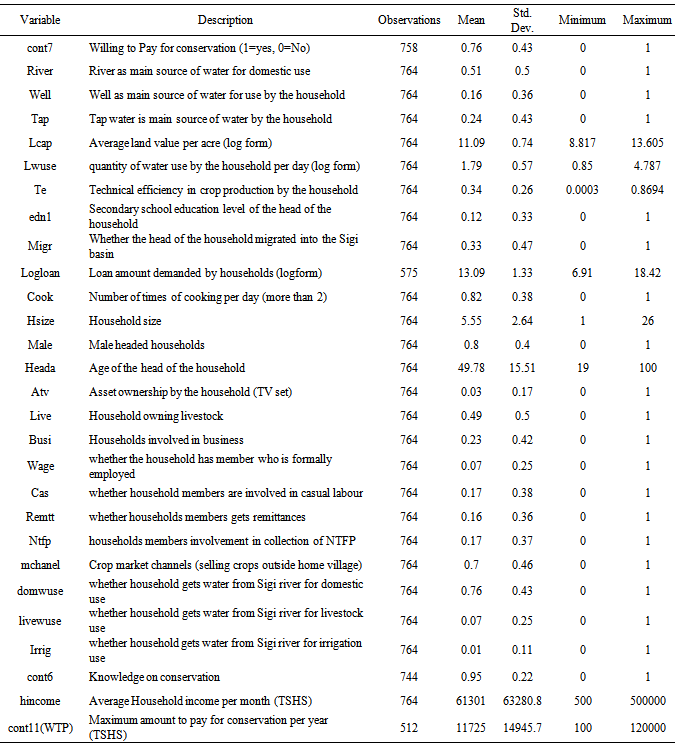
- To implement empirically, we first hypothesized that, the amount of willingness to pay (WTP) for conservation given by the household was reflected by socioeconomic and environmental attributes relevant to the water collecting household. These include household size, age, education level, occupation, income sources, amount of income, household wealth (land size, number of livestock, physical asset ownership), quantity of forests products harvested and used, source of water abstraction, quantity of water abstracted for domestic use and livestock, number of male and female in the household, residence time, knowledge or awareness on environmental matters by the household.From the improved availability and quality of water, people would attach insurance premium of certain value amount to reflect what could be lost if such as service would not be available. To estimate the value of water we employed the compensating surplus measure of welfare. In this case, individuals were asked on the amount of money would they be willing to place for the purpose of conserving forests in order to have increased water flow in Sigi catchment and be available for them to abstract for various uses. In setting up the empirical model, we can decide to model the value of water in the study into two classes of models and we call them as “intangible” and “tangible”. These models are differentiated by the information constituted by the way in which the measure of the value of ecosystem in different scenarios of the WTP was done. The first model (intangible) is one where the measure of the ecosystem value is represented by the responses with “yes” or “no” given by respondents when asked on whether is willing or not to contribute for watershed protection (single bounded DC). The second measure (tangible) of ecosystem value is the one represented by the various bid values of WTP asked (in this study we asked Tshs 5,000; 10,000; 20,000) and the open ended question on the maximum amount that one is willing to pay. The responses in the referendum were interpreted in terms of maximum WTP by placing a bound based on the meaning of the response. This was ascertained from the answers given for the follow-up and open ended question on the maximum willingness to pay by the respondents. This variable accumulates all responses with “yes” answer in the single bound and has a “no” to all bid amounts set in this study. The respective covariate variables for both classes of model are the environmental, socioeconomic and demographic information discussed above. In the current paper, emphasis was made on the second class of modelling to estimate the tangible class model. In this case, a Tobit model was applied to household survey data and the biophysical data to explain willingness to pay amount. We estimated the coefficients of factors influencing the WTP as indicated by respondents. To estimate the bid value functions, the model specification followed the [32]. We transformed the dependent variable by taking logarithm of the bid amount
 and specified the model represented in equation 1.
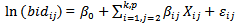 | (1) |
4.2. Defining and Classifying the Sustainability Indicators
- We established the sustainability indicator (SIWTP) based on the estimated coefficients of all significant variables (equation 1). All factors that are significantly influencing the WTP amount offered by the respondent were regarded as candidate to influence the sustainability of watershed ecosystem in question. We performed the second stage of analysis to estimate the marginal effect. The marginal effects represent the unconditional marginal effects of each variable on the probability that a respondent would be willing to contribute amount of money for conservation. The established marginal effects are used to generate the weight index of the class of the factors found to influence the sustainability (equation 2). We estimate the scores using an additive linear equation1.
 | (2) |
 | (3) |
 | (4) |
 | (5) |
|
5. Data Types and Sources
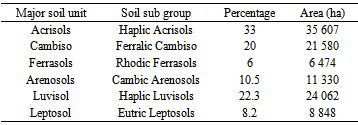
- This study makes use of biophysical and socioeconomic data. The biophysical data include land use and land cover data, weather data, soil data, and a digital elevation model. The origin of land use and land cover data used in this study is the work under the Tropical Forest Action Plan (TFAP) for Tanzania and the Valuing the Arc (www.valuingthearc.org) [4]. Digital elevation modelThe digital elevation model data was used to provide the physical characteristics of the study area that were required for the hydrologic analysis. The topographic map was obtained from the Shuttle Radar Topography Mission (SRTM) through the Consultative Group of International Agriculture (CGIAR) in http://srtm.csi.cgiar.org. The 90m by 90m resolution DEM of the Sigi basin was downloaded and was processed.The soil dataThe soil data for the Sigi basin is from soil datasets by the Food and Agriculture Organization of the United Nations [33]. These were obtained from Institute of Resources Assessment (IRA), the University of Dar es Salaam. The soil data was used in SWAT model through the integration process which involved the use of lookup tables and linked along with spatial soil data (Table 2 and Figure 4).
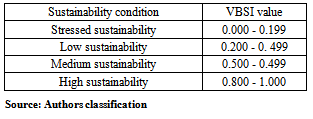
 | Figure 2. Value-Based Sustainability indicator classes |
 | Figure 3. Sigi catchment, topography, river networks and stations |
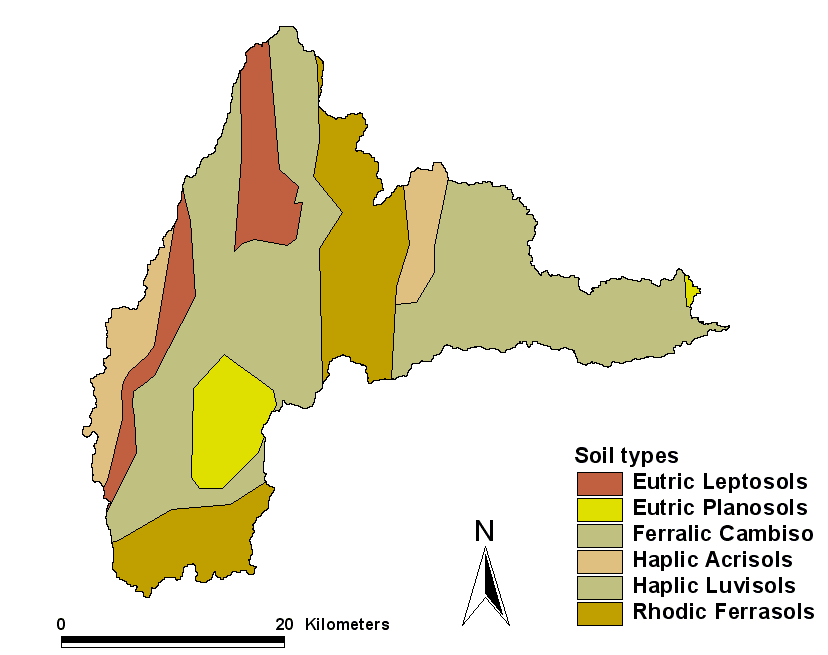 | Figure 4. The soil map for the Sigi catchment [33] |
|
6. Descriptive and Regression Results
- The survey results further shows that, the average of the head of the household is 50 years, with a maximum of 86 and a minimum of 19 years (Table 3). This result also confirms and signifies the adequateness of the sample covered in the study. Since the study is levered at household, then it is quite good that, all respondents have the age within range of being heads of households and thus being able to and confident with the correctness and truth of the information given concerning the respective household.
|
6.1. Results on the Willingness to Pay for Conservation
- Households obtain water for use by direct abstraction from the river. The study applies the contingent valuation and establishes the amount of money that households in the study are willing to contribute for the conservation of the watershed. In the process of estimation, we first established the percentage of households who expressed their WTP for the conservation and the average amount of money. Second, the percentage of those who are willing to pay is used to estimate the potential number of households in the catchment who are willing to pay for the conservation. The procedure is as summarized in the Equation 6 and 7 below:
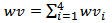 | (6) |
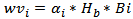 | (7) |
|
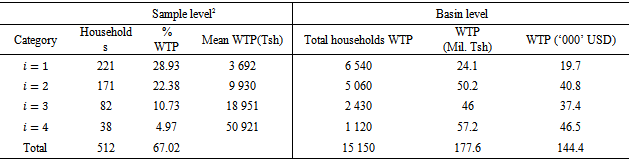
|
6.2. Regression Results
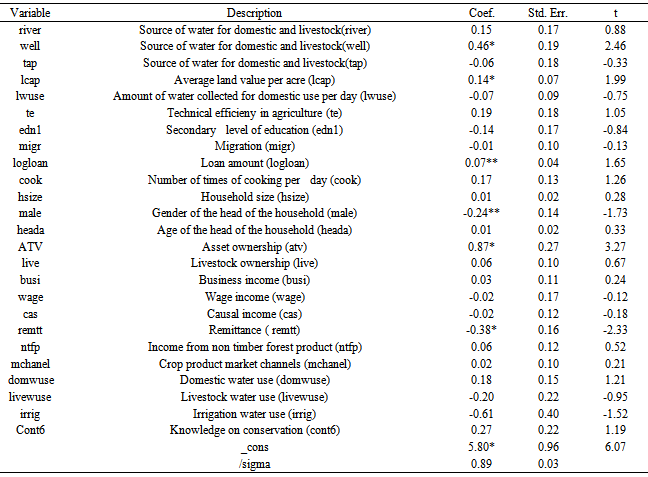
- Implementation of the multiple regression for the WTP as dependent variable and the set of explanatory variables have revealed that, most of the hypothesized predictor variables were statistically significant in influencing households WTP for the conservation. Table 5 indicates significant variables these include wealth (asset ownership, land value, loan amount, remittances), sources of water (well) and knowledge on conservation are significant in influencing WTP. In addition, respondent’s gender is statistically significant, but with negative sign implying that male headed households place less willing to pay for conservation.
6.3. Establishment of the VBSI
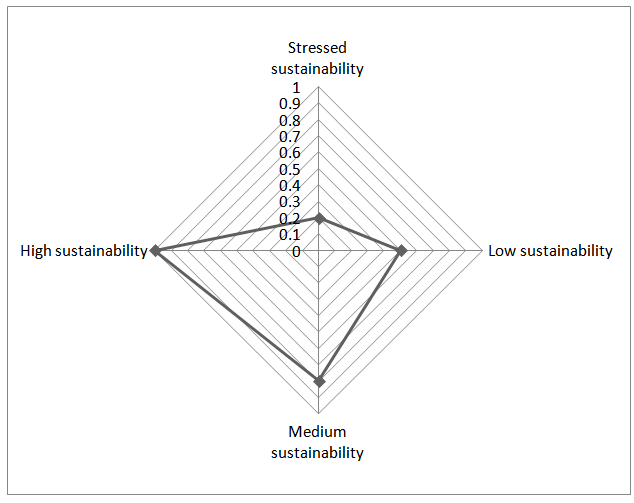
- Estimated Tobit regression and the respective marginal effects were used to generate the VBSI. There are six variables found to be significant in influencing the WTP amount (Table 5). Four variables have positive signs indicating sustainability. Environmental variables (source of water and land holding value) are found to be effective and have VBSI of 0.29 and 0.09 respectively. The value based indicators which include asset ownership and loan amount have VBSI of 0.56 and 0.04 respectively. Aggregating through (equations 2 - 5) the weights to obtain the sustainability index we have VBSI of 0.25 this is in the low sustainability state. From the results above, provision of water for domestic and livestock have an implied value of the ecosystem to the beneficiaries and thus put significant value to the ecosystem resources as established through the WTP. In general, these results are comparable to the biophysical indicators and other opinion from social studies. For example, Chaves [34] points out that watershed are unsustainable if the forest cover is less than 40%. In our study area, the forest cover is about 29% is below the threshold of 40% [34]. In addition, Hepelwa [6] indicates that the Sigi basin is not sustainable due to low technical efficeincy in crop production my most smallholder farmers in the study area. These findings signifies that, to achieve the sustainability indicators of the watershed resources both quantitative and qualitative information are necessary. Such indicators include the stakeholder participation in the watershed management and awareness on the environmental resource issues have a role to play in the sustainable management of naturl resources. The lack of participation of the entire range of stakeholders can weaken the effectiveness of the management strategies implemented in the area. Such assessment would enable to identify the knowledge gap and therefore come up with the right policy option with regard to the conservation and development in the study area.
7. Policy Implication
- We analyzed and developed the VBSI based on the marginal effect of all significant variables found to influence willingness to pay for conservation. This is a new way to gauge the sustainability of ecosystems goods and services in conjunction with the socioeconomic attributes exhibiting by the local community in place. We argue that extending the horizon for considering sustainable watershed resource management is paramount. The results indicate that, the sustainability of watershed in the area is well indicated by the value based indicators. The watershed in question is not sustainable. The sustainability of watershed would be achieved if the local communities understand the value derived from the use of the ecosystem. The findings are new in addressing sustainability and are comparable with other studies elsewhere. It is imperative therefore to involve value based variables when assessing watershed resources.
Notes
- 1. An additive utility function assumes that the decision maker is risk neutral (Prato 2003). 2. Excludes all households that did not express their willingness to contribute due to various reasons such as not being able to pay, others viewing that conservation is not their responsibility.