-
Paper Information
- Previous Paper
- Paper Submission
-
Journal Information
- About This Journal
- Editorial Board
- Current Issue
- Archive
- Author Guidelines
- Contact Us
International Journal of Ecosystem
p-ISSN: 2165-8889 e-ISSN: 2165-8919
2014; 4(1): 12-18
doi:10.5923/j.ije.20140401.02
Assessment of Vegetation Cover Degradation and Regeneration after Removal of Pastoralists in Usangu Wetlands – Mbeya, Tanzania
 Abstract
 Reference
 Full-Text PDF
 Full-text HTML
Ubald Wampembe1, Evaristo Liwa2, Hagai Martine2
1Iringa Municipal Council, Iringa Tanzania
2School of Geospatial Sciences and Technology, Ardhi University, Tanzania
Correspondence to: Evaristo Liwa, School of Geospatial Sciences and Technology, Ardhi University, Tanzania.
| Email: |  |
Copyright © 2012 Scientific & Academic Publishing. All Rights Reserved.
Assessment of vegetation cover degradation and regeneration Usangu wetlands ecosystem in Tanzania is very vital for its sustainable management. In recent years, the wetlands vegetation cover has degraded due to overgrazing and irrigation. This forced the Government of Tanzania to evict pastoralists and agro-pastoralists from the wetlands. After eviction, no quantitative research has been carried out to assess the magnitude of vegetation degradation and vegetation regeneration in the wetlands. The objective of this research is to investigate the vegetation cover degradation in the wetlands in the period between 1994 and 2006 and vegetation regeneration in the period between 2006 and 2008. Remote sensing techniques have been applied to analyze satellite images from Landsat TM of 1994 and Landsat 7 ETM of 2006 and 2008. The results show that between 1994 and 2006 there was vegetation cover degradation which led to decrease in Grassland by 14.1% ha, 5.4% ha of Bushy Grassland and 0.5%, ha of Swamps. Between 2006-2008 there was vegetation regeneration in the wetlands which caused an increase of 3.8% ha in surface area of Water, 2.6% ha of Bushy grassland, 2.1% ha of Wooded Grassland, and 1.3%, ha of Swamps.
Keywords: Change detection, Vegetation regeneration, Wetlands
Cite this paper: Ubald Wampembe, Evaristo Liwa, Hagai Martine, Assessment of Vegetation Cover Degradation and Regeneration after Removal of Pastoralists in Usangu Wetlands – Mbeya, Tanzania, International Journal of Ecosystem, Vol. 4 No. 1, 2014, pp. 12-18. doi: 10.5923/j.ije.20140401.02.
Article Outline
1. Introduction
- Wetlands include a variety of transitional areas where land based and water based ecosystems overlap[1]. Around 4–6% of earth’s surface is covered by wetlands, and the ecosystems have great functional diversity; they stretch from mountains to seas and they include a wide variety of habitats. Wetlands are among the most productive ecosystem of the planet, producing more organic matter per unit area than forest, grassland, and cultivation[9, 11].Wetlands have considerable control over the entire ecosystem they fringe, performing a variety of functions of vital importance. Hydrologically, wetlands regulate water flow by retaining storm rain water flows for short period thus reducing flood peaks. Wetlands control biogeochemical processes by retaining or transforming excess nutrients and by trapping sediment and heavy metals[17, 18]. Biologically, Wetlands provide many wildlife habitat components such as breeding grounds and nesting sites as well as other critical habitats for a variety of fish and wildlife species, and provide unique habitats for a variety of fish and wildlife species, and provide unique habitat requirements for many threatened and endangered plants and animals[6]. All these societal benefits have a quantifiable economic value and therefore, wetlands impairment and degradation have associated costs[6]. Whereby it is easy to destroy wetland and deprive it is its capacity to provide goods and services, it takes much longer and costly to reverse the effects of wetlands loss, and in many cases, the effects of wetlands loss are irreversible.In Tanzania, wetlands are distributed almost all over the country (Figure 1). The estimates by Kamukala[5] indicate that almost 10% of the country’s surface area is covered by wetlands.The wetlands found in Tanzania are classified into three groups according to their origin and physiographic characteristics:-(i). Wetland which have long rivers originating in the highlands meander through the plains forming lakes, swamps, and flood plains. They drain their water either into the ocean or land basins. Examples of these Wetlands include Malagalasi-Moyowosi system and Usangu wetlands.(ii). Coastal valley Wetlands which include mangrove swamps, estuaries, and deltas. Examples include Pangani estuaries in Pangani system and Rufiji River delta, and (iii). Rift valley Wetlands which are found in rift depressions and are characterized by salt Lakes, playas, swamps and short streams with inland drainage e.g. Lake Manyara.
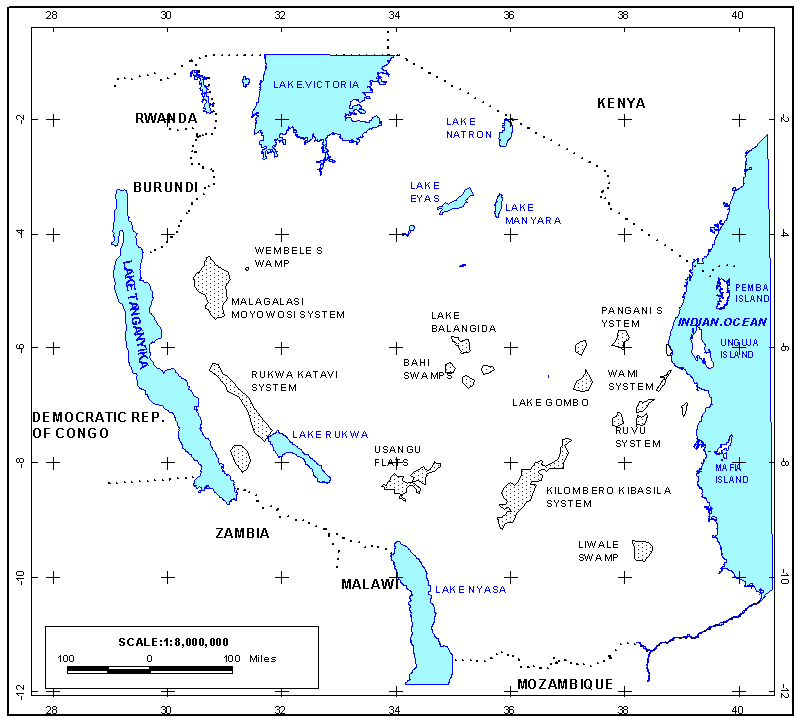 | Figure 1. Map of Major Wetlands in Tanzania (Source: Mwanukuzi, 1991) |
1.1. Description of the Study Area
- The study area for this research is the Usangu wetlands located in semi-arid Usangu plains in Mbarali District in Mbeya Region, South Western Tanzania (Figure 2). The plains lie to the North of the Chimala Escarpment along the northern edge of the Kipengere Mountains. To the West, are the Mbeya Mountains extend north beyond Chunya and to the North and East, which lie gently rising hills of Nyasuguni and Magogoma cloaked in Miombo woodland towards Iringa region border. The northern half of the plains is largely uninhabited due to inhospitable ecological conditions. Pastoral and agricultural activities are concentrated in the Southern half of the plains which contain Ihefu Swamps[13]. The size of the Wetland is around 2,000 square kilometers, and (Ihefu) the permanent swamp itself located within the wetlands is only some 80 square kilometers. Agriculture is the dominant economic activity in the Usangu catchment - cropping and livestock husbandry together account for more than 80% of employment within the area.
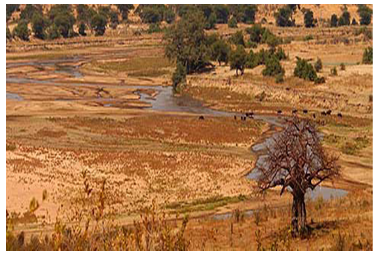 | Figure 2. Drying Ruaha River after invasion by pastoralists |
2. Methods
2.1. Sources of Data
- This research utilized two types of data namely, secondary and primary data. The collected secondary data include; Maps (Standard Topographical map sheets of the series Y742 at 1: 50 000 scale of Utaya (sheet No 230/4 and Ikonga (sheet No 231/3). The topographical maps were obtained from the Ministry of Lands, housing and Human Settlements Development and Usangu Valley land cover/land use map was obtained from Institute of Resource Assessment (IRA) of the University of Dar Es Salaam. The maps were used for location of the study area, extraction of information for ground truthing, and facilitated the delineation of vegetation cover types of training data sets. These maps also provided the data for assessing the accuracies of classified images of 1994 and 2006 which had no field data collected for such assessment. Other data were Livestock statistics, Rainfall statistics, agricultural data and Satellite images. The livestock distribution and rainfall statistics were obtained from Mbarali District Agriculture and Livestock Development Office. This Agriculture data was also collected in Mbarali District from the District Agriculture and Livestock Development Office. Livestock distribution from 1995 to 2007 and rainfall data recorded for the period of fourteen years from 1994. Livestock distribution information was used to show the relationship between occurrence of vegetation cover degradation and livestock population as compared to grazing areas. The last sets of secondary data are the Landsat TM image of 1994, Landsat 7 ETM+ of 2006 and Landsat 7ETM+ 2008. Landsat TM 1994 was obtained at the Ministry of Lands, Housing and Human Settlement Development (MLHHSD) and the images of Landsat 7 ETM 2006 and 2008 (instead of ETM+) were obtained from, Unites States Geological Survey. (USGS) Data Interface from the Global Visualization Viewer (Glo Vis) at http:glovis.usgs.gov.Unstructured interviews were also conducted to key informants from the Mbarali District Agriculture and Livestock Development Office. A total of two interviews were conducted in Mbarali. Each was done based on unstructured questionnaires prepared prior to the field visit as guidelines to the interviews. Two people namely the Agricultural Officer and Veterinary Officer, were interviewed. Ground truth information for purposes of supervised image classification and for accuracy assessment of classification results were collected using a hand held GPS receiver. The coordinates of GPS points representing land use and cover classes of interest were measured directly in the field. A total of 15 points at each land cover were sampled for this purpose. The trip for the ground truthing was performed in 2007 during the wet season similar to acquisition of Landsat satellite images.
2.2. Data Processing
- The Erdas Imagine software version 9.0 was used to process the data. Image classification was performed by using Hybrid classification method. Hydbrid method was found to be useful because both supervised and unsupervised classifications features were utilized. Hybrid classification method is particularly useful to analyze where there is complex variability in the spectral response patterns for individual cover types present[7]. This condition was found in Usangu wetlands in which there is distinct variability in land use cover and vegetation patterns from highland to lowland areas including the wetlands. The change detection was performed to assess how vegetation and land use covers in Usangu wetlands have changed from 1994 to 2008. Through field visits, the actual identified vegetation cover found in usangu wetlands include; agricultural area, water (the perennially flooded swamp – Ihefu swamp), mix of seasonally flooded open grassland, seasonally flooded bush (bushy grassland), wooded grassland, woodland, and forest. These vegetation covers were also adopted for the classification scheme.The results of classification were assessed using error matrices. An error matrix compares classification results to additional ground truth information as a standard. The strength of an error matrix lies in the fact that it identifies the nature of classification errors, as well as their quantities[7, 8]. Classification results were compared to ground truth data that was not used for training.This study made use of post classification comparison and GIS analysis of land use maps compiled from satellite images to detect changes in land use categories. Classification results formed input to map calculation and overlay analysis functions where change maps and change matrices were generated.
3. Results
3.1. Image Classification Results
- Results include the classified images, accuracy analysis, and change detection. Figure 3 shows one of the maps of classified images of 1994. The Error Matrices of the classified images of 1994 and 2006, showed the overall accuracies achieved were 71.8% for image of 1994 and 74.4% for the image of 2006 respectively. These accuracies were sufficient for the intended purpose of change detection.
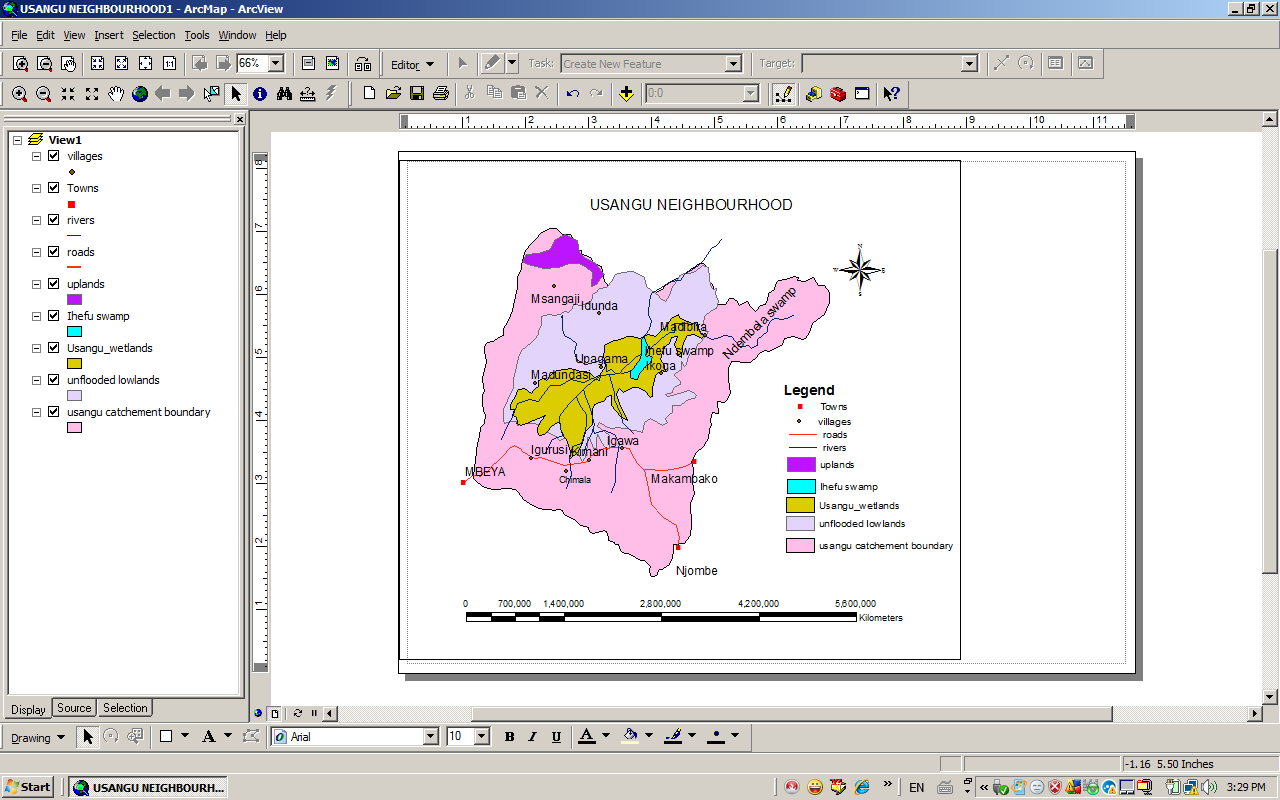 | Figure 3. Usangu plains neighbourhood map (Source: SMUWC, 2002) |
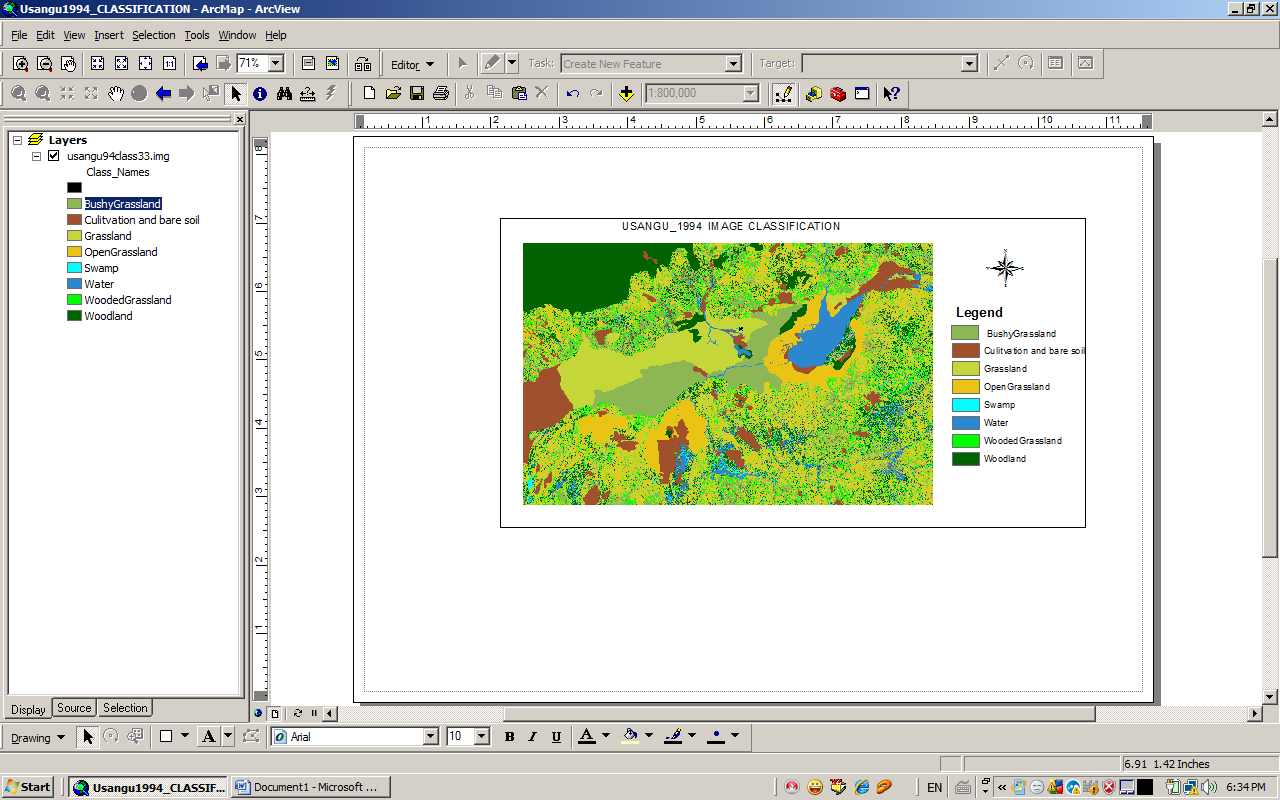 | Figure 4. Usangu classified image of 1994 |
3.2. Change Detection Interpretation
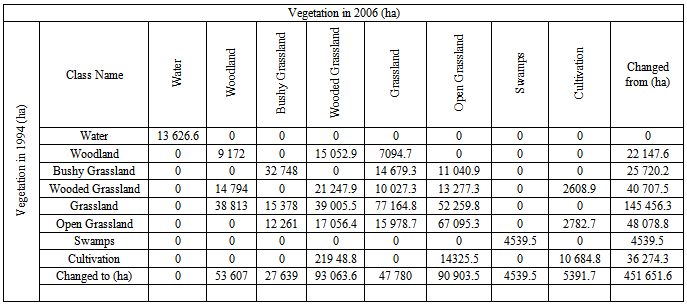
- Change detection for this study provides information on area change and rate of change of land-cover types for a period of 12 years from 1994 to 2006 and two years from 2006 to 2008 that is to investigate vegetation cover degradation in a period of 12 years and vegetation regeneration in the period of 2 years. In order to observe the changes in vegetation covers it was necessary to study the changes between three bounding vegetation/land use cover classes starting from the centre of the ecosystems which holds water permanently (Ihefu swamp) to the peripheral which contains the Woodland. The land cover change matrices which show the changes in statistical figures are presented in Tables 1 and 2. They show the area (in hectares) changes by class that occurred between 1994 and 2006 (during the degradation period) and between 2006 and 2008 (the regeneration period) respectively. In the Tables, the diagonals show vegetation caver by area that stayed the same. For example, in Table 1 the number 9 172 ha indicates that this area did not change and stayed woodland in the period. The rows indicate loss. For example, 15 052.9 ha of woodland changed into wooded grassland and 7 094.7 ha changed into grassland, making the total loss from woodland to be 22 147.6 ha. The columns indicate gain, that is, during the period, 14 794 ha of wooded grassland and 38 817 of grassland changed into woodland, making a total gain of 53, 607 ha. There was, therefore, a net gain of 1460 ha to woodland. Similar relationships were established for other vegetation classes in both tables.
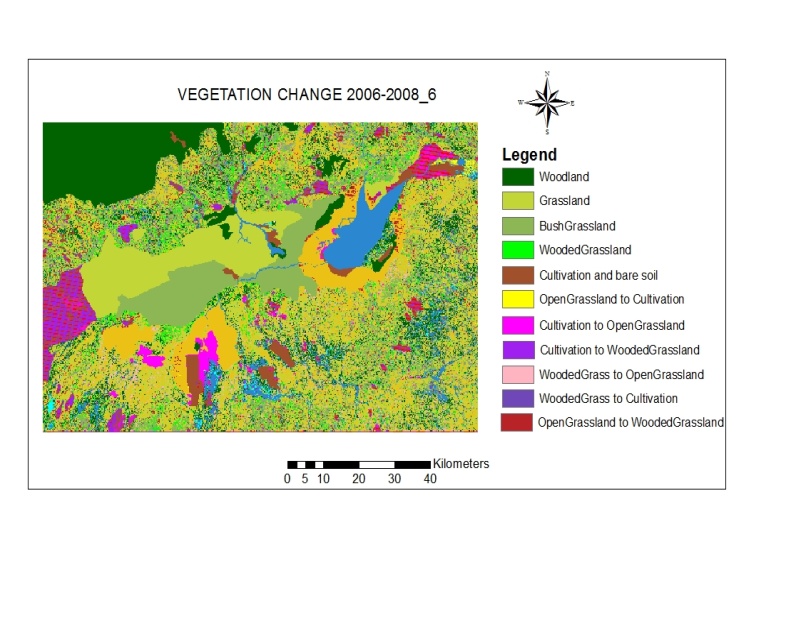 | Figure 5. Vegetation Change 2006-2008 by considering classes, Grassland, WoodedGrassland, and Cultivation |
|
|
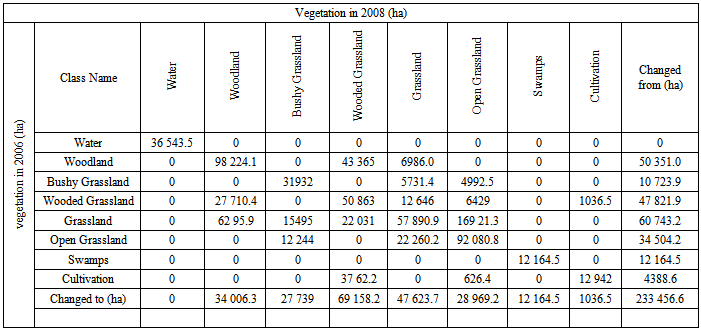
4. Discussion
- Studies done in different parts of the world have revealed that vegetation types, particularly in wetlands can change within one growing season[14, 15]. Therefore, the twelve - year period selected to assess vegetation cover degradation from 1994 to 2006 and two years used to assess regeneration of vegetation cover in Usangu wetlands from 2006 to 2008 in this study were appropriate. Classifications have segmented the vegetations/land use into change covers which shows that a total of 47.3% (451 651.6 ha) changed from one class in 1994 to another in 2006 (Table 1), and a total of 24.5% (233 456.6 ha) changed from one class in 2006 to another class in 2008 (Tables 2). The direction of vegetation change in the wetlands follows a sequence of plant species supported by the wetlands from the centre (Ihefu swamp) which retains water permanently to the outer most areas in the sequence which is Woodlands. The sequence arrangement starts with water in Ihefu swamp then followed by Open Grassland, Bushy Grassland, Wooded Grassland and the outer vegetation over being the Woodland. Cultivation is located between Grassland and Wooded Grassland with most of the farms located in Wooded Grassland vegetation cover area.From the changes presented in the thematic maps, it is noted that vegetation communities appear to switch in progression from one community to another along the direction from the centre of the wetlands to the peripheral. (i.e., Open Grassland<-> Bushy Grasslands<-> Grassland<-> Wooded Grassland<-> Woodland). This means that, there was no transition for example, from Open Grassland to Woodland or from Woodland to Busy Grassland. The observed changes were due to the natural succession process. This sequence has also been observed in other parts of the world where wetland vegetation dynamics have been studied [17].
4.1. Vegetation Change during Degradation Period (1994-2006)
- These are the changes that took place before the interventions by the government in the Usangu wetlands. Several factors might have contributed to the vegetation/land use changes. For example, decrease of water in Usangu wetlands between 1994 and 2006 is an indication that there was little water that flowed into the wetland. Water decrease might have been due to drought because rainfall data for the period between 1994 and 2006, had been sufficient only in the three periods of 2000/2001, 2001/2002 and 2004/2005. But it had previously been observed that, the wetlands do receive and depend on the water from highlands which normally receive high rains[5]. Therefore, reduction of water into the wetlands must be from other factors and not from drought. The factors which were very likely to reduce the amount of water flowing into the wetlands were irrigation and by livestock utilization. These were the prominent activities using a lot of water in Usangu plains at that particular time[4].
4.2. Vegetation Change during Regeneration Period (2006 – 2008)
- This is the period after intervention by the Government. The intervention involved removal of excess livestock in Usangu wetlands to other areas in the country. During the period an increase of area of coverage in hectares of some land cover classes was observed. For example, water area increased by 3.8% (36 543.58 ha), Bushy Grassland by 2.6% (2421.6 ha), Wooded grassland by 2.1% (20 479 ha), and Swamps increased by 1.3% (12 164.51 ha). However, Woodland decreased by 2.9% (27 669 ha), Grassland by 1.8% (16 998 ha) and Cultivation continued to decrease by 0.9% (8 123 ha). Several factors, including sufficient rainfall and in particular, the measures taken by the government may have contributed to the increase of water in the wetlands. In addition to the removal of excess livestock in Usangu plains, other intervention measures taken by the government include: control of the water used in large irrigated farms, prohibition of cultivation by small scale farmers in the tail end areas to allow the water from large farms to flow into the wetlands, and to ban fishing in Ihefu swamp[12]. These measurers led to changes in the landscape. For example, some of the roads which used to be passable between 1994 and 2006 were no longer accessible and some have disappeared due to vegetation regeneration and water fill up. Thus, vegetation regeneration is taking place in Usangu wetlands.
5. Conclusions
- Previously in this research it was believed that between 1994 and 2008 the major threat to the integrity of Usangu wetlands vegetation cover were irrigation activities in Usangu wetland together with grazing. The obtained results in this research indicates that, there was a decline in irrigation in Usangu wetlands by (5.6%) equal to 53 377.8 ha of the study area between 1994 and 2006, and (0.9%) equal to 8123.6 ha between 2006 and 2008. This implies that between 1994 and 2008 there was no remarkable irrigation activities which could lead to vegetation degradation in Usangu wetlands. In this period there was no serious expansion of farms which could remove vegetation cover or use more water. This evidence removes irrigation from the two major assumed threats of vegetation cover in Usangu wetlands between 1994 and 2006. Consequently, the presence of excess number of livestock in Usangu wetlands remained to be a single major factor of vegetation cover degradation in Usangu wetlands between 1994 and 2006.
ACKNOWLEDGEMENTS
- We would like to thank Mr. Willie. J.B.N. Mwaluvanda of Rufiji Basin Water Office at Iringa for his initial inputs which marked the start of this study. Also, staff of TANAPA of Ruaha National Park, Staff of Mbarali District Executive Director’s Office, and Mbarali District Commissioner’s Office for their cooperation during data collection.