-
Paper Information
- Next Paper
- Previous Paper
- Paper Submission
-
Journal Information
- About This Journal
- Editorial Board
- Current Issue
- Archive
- Author Guidelines
- Contact Us
International Journal of Ecosystem
p-ISSN: 2165-8889 e-ISSN: 2165-8919
2013; 3(6): 185-195
doi:10.5923/j.ije.20130306.04
Spatio-temporal Study of Zooplankton Community in Mahanadi Estuary, Bay of Bengal
 Abstract
 Reference
 Full-Text PDF
 Full-text HTML
Subrat Naik1, Debasish Mahapatro1, Durga Prasad Behera1, Manish Kumar2, C. R. Panda2, R. K. Mishra3
1Department of Marine Sciences, Berhampur University, Berhampur, 760007, Odisha, India
2Institute of Minerals and Materials Technology, Bhubaneswar, 751013, Odisha, India
3National Centre for Antarctic and Ocean Research, Headlanda Sada, Goa, 403804, India
Correspondence to: R. K. Mishra, National Centre for Antarctic and Ocean Research, Headlanda Sada, Goa, 403804, India.
| Email: |  |
Copyright © 2012 Scientific & Academic Publishing. All Rights Reserved.
Spatio-temporal variation in zooplankton biomass, abundance, composition and hydrography were studied during 2009 in the Mahanadi estuarine complex. The estuarine system was strongly influenced by southwest monsoon and changed in the abiotic and biotic attribution system. There was an increasing trend of salinity observed from monsoon to post-monsoon, winter and followed by pre-monsoon which was peaked with 6.6 ± 5.37 psu, 10.5± 8.34 psu, 15.5 ± 4.38 psu and 24.10 ± 3.80 psu respectively. Dissolved oxygen was varied from 6.2 to 7.6 mg l-1. However the pH was maintained a consistent trend and showed slightly alkaline in nature. Among 19 groups of zooplankton community, the preponderance of copepods (38 species) was observed as the major followed by mysids and chaetognaths. The dominant species were prevailed Paracalanus, parvus claus and Pontella andersoni sewell sp, which were conspicuous at river mouth. Whereas, Lucifer hanseni was observed at the river mouth during winter season only. Pearson correlation analysis indicated that total zooplankton population and biomass were positively correlated with PO4, NO2 and salinity (p< 0.01) and showed marked variations in density, biomass, species composition and relative abundance. This represented a complex ecosystem of Mahanadi estuary where many parameters were influenced together due to their cumulative impacts which result a major ecological driver of the estuarine system.
Keywords: Zooplankton Abundance & Biomass, Water Quality, Cluster Analysis, Mahanadi Estuary
Cite this paper: Subrat Naik, Debasish Mahapatro, Durga Prasad Behera, Manish Kumar, C. R. Panda, R. K. Mishra, Spatio-temporal Study of Zooplankton Community in Mahanadi Estuary, Bay of Bengal, International Journal of Ecosystem, Vol. 3 No. 6, 2013, pp. 185-195. doi: 10.5923/j.ije.20130306.04.
Article Outline
1. Introduction
- Estuarine biotopes can be described as the opening of river to the nearby sea or ocean and often designated as the most dynamic and productive ecosystem of the world. It is due to the nutrient flux from continental drainage and also from marine intrusion. The intermixing of riverine system with marine system creates a typical transitional water mass that favours to colonise a wide range of organisms. Zooplankton plays a very important role in marine ecosystem in terms of the secondary production[1]. Thus study of zooplankton dynamics is imperative for a better understanding of the functioning of coastal ecosystem. This knowledge (i.e. variability of the zooplankton communities and the environmental preference of its constituents) can help to predict the effects of changes, whether natural or man induced[2]. Zooplankton forms the vital links in the pelagic food chain. In addition to their role in food chain and food web, zooplankton also contributes to the nutrient regeneration and release of organic carbon process in the ambient medium. Being the prominent phytoplankton grazers, zooplankton controls the fishery production of any aquatic ecosystem. Many micro-zooplankters also constitute the major food item of the larvae of crustaceans, molluscs and fishes. Thus abundance of zooplankton practically acts as an ideal index to assess the fertility of water mass. Furthermore, many zooplankton species are used as the water quality indicators including pollution[3]. In Indian subcontinent, most of the estuarine systems are under stress from natural and anthropogenic inputs so as the river Mahanadi, east coast of India. Presence of many industries and increased port activities provides an unconducive environment to the biota of this estuarine ecosystem. Thus, the present study was carried out to delineate the qualitative and quantitative analysis of zooplankton of Mahanadi estuary in relation to the hydrographic characteristics on spatio-temporal scale. This study can serve as baseline information for future ecological assessment related to Mahanadi estuary and also for other similar ecosystems.
2. Materials and Methods
2.1. Study Area
- The Mahanadi river system is the third largest in the peninsula of India and the largest river in the east coast of India. The river basin extends over an area of approximately 141,600 km2, with a total length of 851 km and the peak discharge of 44,740m3 s-1[4]. Land run-off through such a large basin is the principal source of nutrient elements in the coastal waters. Large scale introduction of industries in Paradip caused the risk of pollution of the estuary and coastal water environment. It is also receives a large amount of agricultural run-off along its course. Human influences are pronounced at Sambalpur, Cuttack and Paradip where the proliferation of industries and sewage discharge is prominent. All the nutrient rich water after travelling all the distances enters to the coastal water Bay of Bengal through the Mahanadi river mouth (situated at Paradip) which make the place ecologically and environmentally sensitive area and known as ESA.
2.2. Sampling and Analytical Strategy
- The sampling stations are located at Mahanadi estuary which fall in between 200 17' 16" Latitude and 860 42' 28’’ Longitude. The water sampling were carried out from three locations for four seasons such as Winter (January), Pre-monsoon (May), Monsoon (August) and Post-monsoon (November) respectively during 2009 (Figure 1). The onboard measurements of pH, water temperature, salinity were carried out immediately after the collection of the sample using a battery operated Water Quality Checker (Model No.- WQC 22A). The analysis of Dissolved oxygen (DO) was conducted by Winkler’s solution method and analyzed following standard guidelines and procedures[5]. Biological oxygen demand (BOD) was measured by using Winkler’s method and the BOD was calculated from the difference of DO concentration after 5 days of incubation at 20℃. Water samples for nutrients analysis were drawn into pre-cleaned polythene bottles and were transported to the laboratory and kept in an ice box under dark conditions till analysis. Samples for nutrient analysis were filtered against Millipore filter paper prior to chemical analysis. Estimation of nutrients such as NO2–N, NO3–N, PO4–P and SiO4–Si, was done adopting the spectrophotometric method[6]. Each analysis was done in triplicate and the mean value is reported. Zooplankton samples were collected by surface hauling with the help of a zooplankton net (pore size- 300µ) on seasonal basis. Immediately after collection, the plankton samples were preserved in 4% formaldehyde solution. Then, 1 ml of zooplankton sample was taken on a Sedgwick Rafter counting chamber and screened under a stereo research microscope (Leica MZ 95). The zooplanktons were identified up to species level by the help of ICES Zooplankton methodology manual and total number is expressed as nos.m-3[7]. The biomass of the zooplankton was estimated by volume displacement method and expressed as g m-3[7, 8]. The residual plankton on the filter was resuspended in 4% formaldehyde solution and was used for qualitative analysis. The present study involves statistical analysis viz. Correlation matrix understand the type of relationship between the biotic and abiotic parameters by using SPSS 17.0. In order to understand the similarity between the zooplankton group, Cluster analysis was done after square root transformation of zooplankton abundance data set followed by nm MDS (non-metric multidimensional scaling) plot was also made by using PRIMER 6.0 Statistical softwares.
3. Results and Discussion
3.1. Hydrographical Characteristics
- Variations in different water quality parameters were within the expected levels in the estuary and its adjoining river mouth environment, suggesting that the area was free from any environmental stress (Table 1). Changes in water temperature were mainly induced by variations in atmospheric temperature. The temperature was varied from 22.6 to 30.4℃. The values of pH ranged from 7.2 to 8.6, represented slightly alkaline in nature with higher values during pre-monsoon and lower values during post-monsoon. The highest value is always associated with the high tide condition in all four seasons. There was no remarkable seasonal difference in pH of Mahanadi estuarine water. However, a slightly higher value was observed during post-monsoon period. This is due to high rate of photosynthesis during winter season and higher alkaline condition is due to uptake of CO2 from the water column[14-16]. Dissolved oxygen varied from 6.2 –7.6mg l-1 and the lowest and highest values were observed during winter and post-monsoon seasons respectively. The highest DO was noticed during post-monsoon season. The high DO level in the upstream station of the estuary could be due to photosynthetic release by autotrophs which act as the major factor controlling the oxygen distribution in estuary[17]. Biochemical oxygen demand fluctuated between 1.3 and 2.8 mg l-1 and the highest value was recorded during winter season. Fairly high level of DO and low BOD indicated effective assimilation of organic load. The salinity showed wide variation and it was ranged from 2.8 – 26.8 PSU. During pre-monsoon period salinity increased to 26.8 PSU and the entire water column was homogeneous due to limited fresh water influx. During monsoon season due to intrusion of freshwater, salinity drastically decreased to 2.8 PSU. Nutrients in the studied area indicated seasonal variations with maximum concentration during monsoon period[18]. The nutrients like NO2, NO3, PO4 and SiO4 is varied from 0.38 to 1.84 mol l-1, 1.14 to 4.28 mol l-1, 3.4 to 18.26 mol l-1, and 2.26 to 8.24 mol l-1 respectively. The NO2, NO3 and PO4 showed a similar trend of variation, where much higher and lower concentrations are associated with monsoon and pre-monsoon seasons respectively. The higher concentrations during the monsoon seasons are related to agricultural run-off through flood water[15], land drainage and precipitation[19-21]. The silicate concentration showed remarkable higher values during monsoon, probably on account of the input of more siliceous sediments gathered from its upstream catchments[22-24]. The lower values of silicate during post monsoon may be related to high biological uptake by diatoms and a biological removal of dissolved silicate by adsorption on suspended solids at higher salinity values[18, 26]. Besides the seasonal variation of nutrients a well-defined tidal variation was also observed.
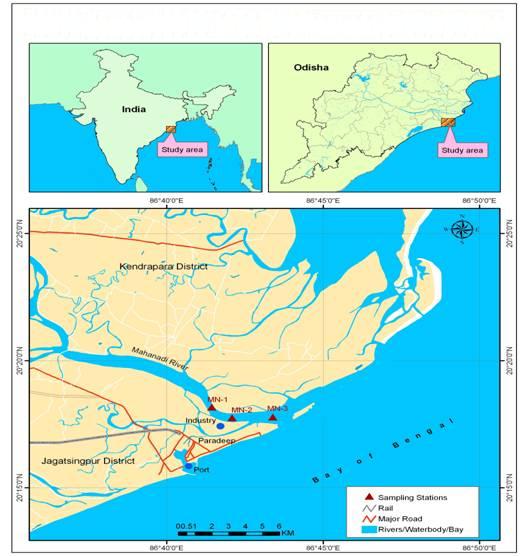 | Figure 1. Map Showing Study Area in the Mahanadi Estuary |
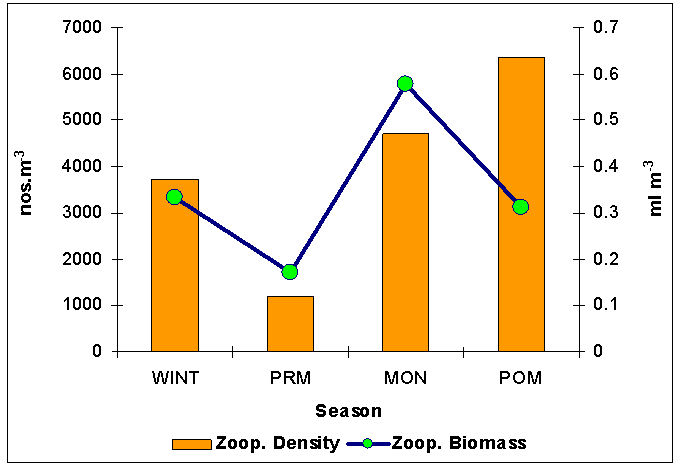 | Figure 2. Seasonal distribution of zooplankton population (nos.m-3) and biomass (ml m-3) of Mahanadi estuary |
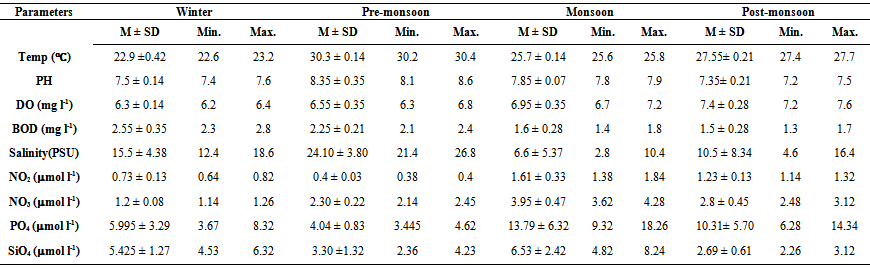 | Table 1. Mean (M), standard deviation (SD), minimum and maximum values of environmental variables in Mahanadi estuary and river mouth environment |
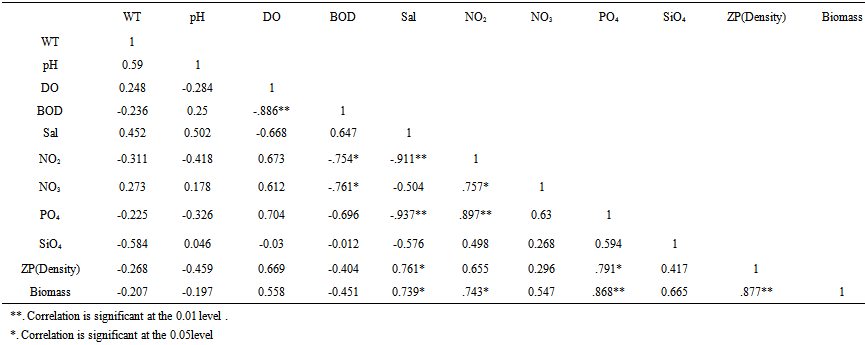 | Table 2. Correlation Matrix of Various Environmental Variables in the Mahanadi Estuary |
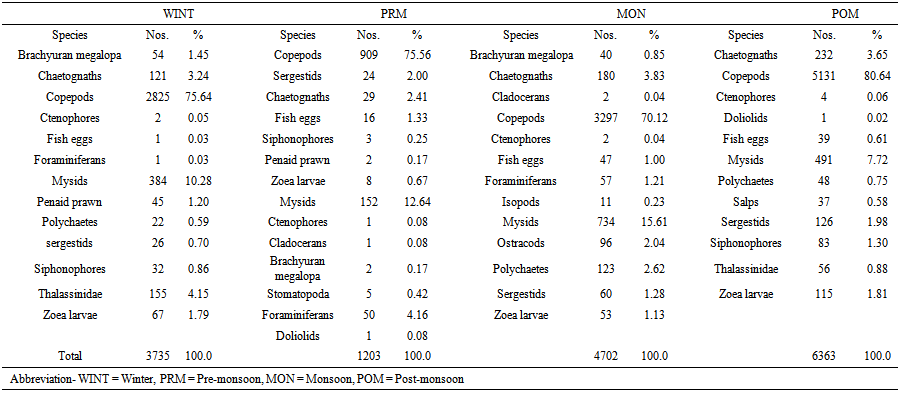 | Table 3. Population and percentage composition of different group of zooplankton in the Mahanadi estuary in different seasons |
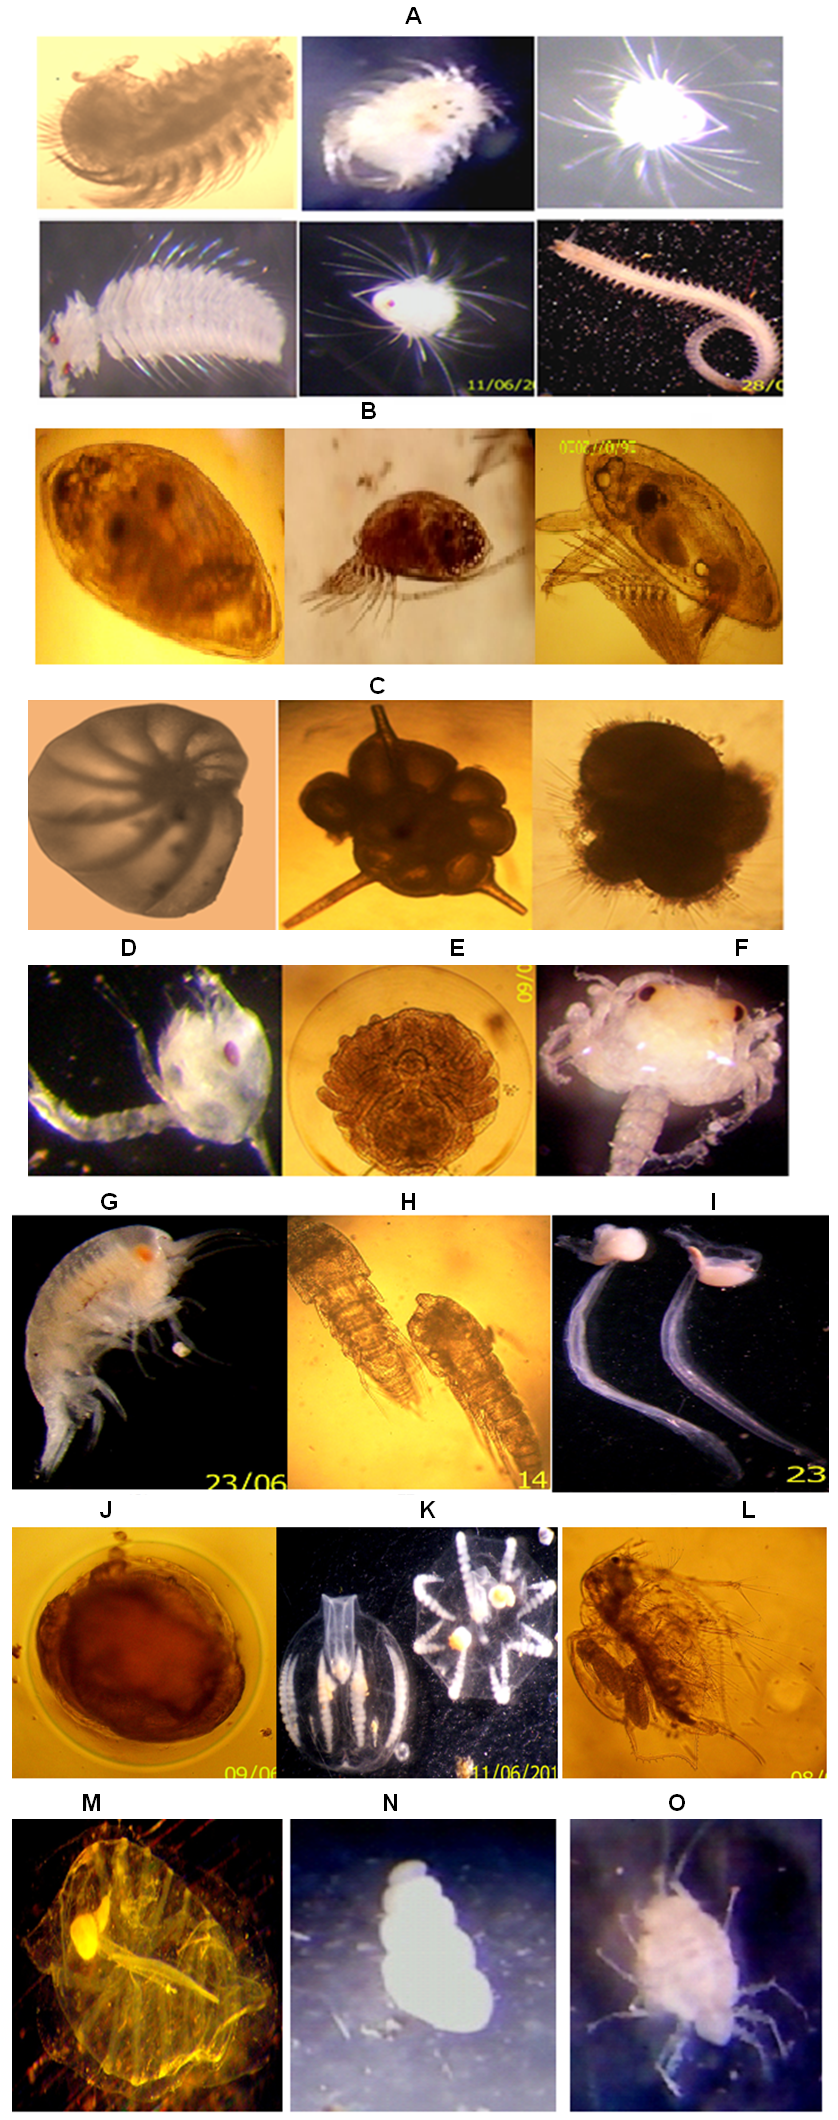 | Figure 3. A = Polychaete and polychaete larvae, B= Crustacean cypris larvae, C = Foraminiferans, D =Zoea larva, E= Brachiopoda larva F= Megalopa larva, G= Amphipods, H= Copepods, I= Appendicularians, J= Fish Egg, K= Ctenophore, L= Cladocerans , M= Salps, N =Gastropod Larva , O= Isopods |
3.2. Biomass and Population Density
- The zooplankton biomass varied from 0.17 to 0.57 ml m-3 and population density ranged between 1203 and 6363 nos m-3 (Figure 2). Maximum biomass was noticed during monsoon at station located at river mouth and during post - monsoon at other stations. Peak in zooplankton production was noticed during monsoon to post-monsoon. High saline periods are known to accelerate zooplankton production [27-29]. While in this study zooplankton abundance was observed between monsoon and post - monsoon when relatively low and moderate salinities prevailed over the river mouth areas. This was probably due to the phytoplankton abundance which could possible due to the nutrient input from riverine influx to the estuarine system and nearby marine ecosystem. Zooplankton population and biomass exhibited a significant positive correlation at both stations. The seasonal variability of zooplankton could be ascribed as predation pressure from higher trophic level.
3.3. Zooplankton Composition
- Abundance of various zooplanktons in the estuary was fluctuated in accordance with salinity regime. Copepods, mysids, decapods and chaetognaths which contributed to the major part of zooplankton were studied in details and other group were clubbed together as other taxonomic groups (Table 3). Copepods was the largest fraction of zooplankton in Mahanadi estuary contributing 75.15% with a population density ranging from 909 to 5131 nos m-3. The peak in copepod population was observed during monsoon period. A total of 38 species were encountered during sampling periods. Out of 38 species of copepods recorded from Mahanadi estuary, species such as Acrocalanus gracilis, Centropages furcatus, C. tenuiremis, Pontella andersoni, Paracalanus parvus, Labidocera acuta, Acartia erythraca were restricted exclusively to the river mouth, while Mesocyclops, Pontellopsis herdmani, Eucalanus elongates, E. crassus were noticed mainly in those stations located at the river mouth. Neodiaptomus sp., Temora sp., Pseudodiaptomus sewelli, Helicyclops were observed during monsoon period suggesting their preference to very low saline or limnetic conditions. Mysids was second largest in population and precent composition of total zooplankton abundance. The group contributed 10.88% of total zooplankton population. Decapods were largely constituted by larval stage. This group was third largest population of zooplankton in the order of abundance as well as percentage composition (Table 3). Highest density was recorded in post-monsoon period at near shore station. Sixteen forms of planktonic decapods belonging to sergestids, penaidae, Thalassinidae and Brachyuran were encountered during the sampling periods. On an average sergestids formed major part of the decapods population throughout the sampling periods at both stations. Sergestids was represented by sergestes, Lucifer hanseni and protozoea of Lucifer. This group became the fourth largest group of zooplankton. Some Chaetognaths such as Sagitta bedoti was common at all station while, Sagitta enflata was largely noticed in the river mouth. Chaetognaths were fairly abundant throughout with peak recorded in post-monsoon period. Other groups were also investigated during all sampling periods. Siphonophores were most abundant at river mouth station during monsoon season. Even though ctenophores were well represented in the estuary, the population density was low during post-monsoon season. Polychaetes were more abundant at river mouth station. Planktonic gastropods and bivalves were common at all stations. Salps and doliolids were sparsely represented towards the river mouth. Fish eggs were commonly found at all stations and occasionally found in large number. On an average in the river mouth sustained relatively higher population of fish eggs and larvae than the riverine zone. The zooplankton groups are shown (Figure 3). The correlation study shows that there was positive correlation of biomass with population density, salinity, PO4 and NO2 (Table 2).
3.4. Cluster Analysis
- The cluster analysis followed by nm MDS were done by using the mean values of zooplankton abundance data from three sampling stations of Mahanadi estuary. As the sampling stations were belonging to estuarine zone thus, no great variations in the group composition of zooplankton were observed. The nm MDS plot and cluster analysis made by using Bray-Curtis similarity matrix between the zooplankton groups only. The results obtained from Figure 4A and 4B revealed the zooplankton groups like stomatopod, dollioloid, foraminiferans and isopods were not grouped in any cluster. Copepods and mysids were grouped in cluster-I, penaid prawn, brachyuran megalops and thalassinidae were grouped in cluster-II, cladocerans and ctenophores were in another cluster-III, whereas siphonophores, chaetognaths, zoea larvae and salps were grouped in cluster-IV. Finally there was a major cluster formed which was possessed with sergestids, zoea larvae, polychaeta, fish eggs, ostracods, chaetognaths, labelled as cluster-V. There was clear distinction between the meroplankton (zoea larvae, fish eggs, penaid prawn & megalopa larvae) and holoplankton (copepods, mysid, doliolid and salps) suggesting a good colonisation of different zooplanktonic representatives according to their habit and habitat. However, zooplankton groups that were not grouped with any one of the group in cluster might be due to the habitat preferences and a different kind of biological cycle which was not coincided with them. Foraminferans are well indicators of stress or pollution in an ecosystem whereas, isopods are mostly parasitic in nature. The distribution of isopod depended up on the presence and absence of a specific host available in the study area. The presence of juvenile like stomatopods, penaid prawn and megalopa larvae in the study area could be inferred as a predominance of prawn, crabs and squilla in the total fish catch from the Mahanadi estuary. Similarly presence of polychaetes and fish eggs, zoea larvae and chaetognaths might be interrelated in terms of habitat preferences due to which they might have grouped in same cluster. Chaetognaths are considered as the second most important group after copepods in estuarine and marine ecosystem. In the present study, the copepods and chaetognaths were fallen in different group of cluster which might be due to the prey-predator relationship between copepods and chaetognaths. Ctenophores also known were comb jellies are another dominant group of marine zooplankton that plays a vital role in marine food web and commonly feed on small zooplanktonic organisms. Cladocerans are commonly seen in neritic water of the ocean and feed on minute zooplanktonic organisms like ctenophores and probably this could be the reason that they were grouped in to the same cluster.
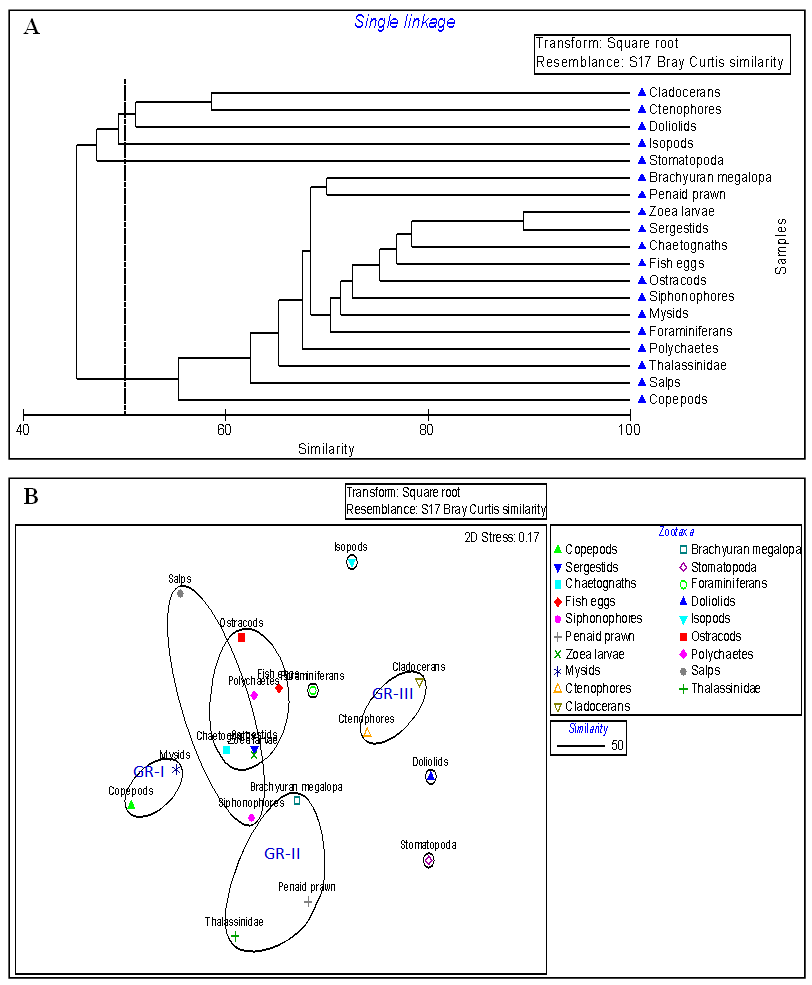 | Figure 4. A. Similarity Cluster analysis of Zooplankton in Mahanadi Estuary, bavours to colonise a wide rangnt ent condition of the estuary and also itional water mass that favours to colonise a wide rang, B. Non-metric Multi Dimensional Scaling ( nm MDS) of Zooplankton in Mahanadi Estuary |
4. Conclusions
- The zooplankton community in the estuarine system plays an important role in the fisheries production and also reflects the status of water quality. The present study pertained to Mahanadi estuary revealed 19 groups of zooplankton and out of which copepods was dominant group followed by mysids, chaetognaths and decapods. The spatio-temporal variability of zooplankton communities analysed by nm MDS which also showed the existence of total five assemblages of groups in the estuary. The correlation studies suggest that abundance, biomass of the zooplankton communities are strongly influenced by the nutrients of PO4 and NO2. The study indicates the Mahanadi estuary was rich in zooplankton communities in the marine zone as compared to the fresh water zone in the region. However the study nullifies the influence of any single parameter as the major ecological driver of estuarine system that specifically controls the zooplankton community. Therefore the cumulative impacts of several environmental parameters were considered for directly influence of the zooplankton community in the estuary.
ACKNOWLEDGEMENTS
- The authors are thankful to the Head, Department of Marine Sciences, Berhampur University and IMMT, Bhubaneswar for providing the laboratory facilities.