-
Paper Information
- Previous Paper
- Paper Submission
-
Journal Information
- About This Journal
- Editorial Board
- Current Issue
- Archive
- Author Guidelines
- Contact Us
International Journal of Ecosystem
p-ISSN: 2165-8889 e-ISSN: 2165-8919
2013; 3(5): 148-156
doi:10.5923/j.ije.20130305.07
Preliminary Assessment of the Effects of Anthropogenic Activities on Vegetation Cover and Natural Regeneration in a Moist Semi-Deciduous Forest of Ghana
 Abstract
 Reference
 Full-Text PDF
 Full-text HTML
Eric Adjei Lawer1, Bernard N. Baatuuwie2, Kwame Ochire-Boadu2, William Jasper Asante2
1University for Development Studies, Dept. of Range & Wildlife Mgt., Nyankpala Campus, P. O. Box TL1882, Tamale, Ghana
2University for Development Studies, Dept. of Forestry & Forest Resources Mgt., Nyankpala Campus, P. O. Box TL1882, Tamale, Ghana
Correspondence to: Eric Adjei Lawer, University for Development Studies, Dept. of Range & Wildlife Mgt., Nyankpala Campus, P. O. Box TL1882, Tamale, Ghana.
| Email: |  |
Copyright © 2012 Scientific & Academic Publishing. All Rights Reserved.
Tropical forests are being threatened daily by varied levels of anthropogenic activities which have resulted in the loss of biodiversity globally. The study was conducted to answer questions about the effects of human interferences on vegetation cover and natural regeneration. Two Landsat images of the study area were obtained for 1986 and 2003. Ground-truth data was recorded from the field for accurate classifications which was subsequently used to generate a change map. Six quadrats were then laid in primary (PF) and secondary (SF) forests based on the map. Diversity indices were estimated while differences in regeneration (seedlings and saplings) densities between PF and SF was analyzed using ANOVA. Estimated forest cover removed was 10.8 ha (1986) and 1,698.21 ha (2003). There was a significant difference in recruitment densities between the two forest types (p<0.001). Shannons’ index revealed that PF was less diverse (0.867) and had a higher Jaccard similarity index (0.222) among seedlings and saplings compared to SF (0.842 and 0.077). It is concluded that, the high level of forest cover loss and poor recruitment of seedlings into saplings for SF indicates a threatened state of the reserve. This information may be useful in identifying opportunities for restoration efforts to ameliorate present conditions in the reserve.
Keywords: Image Classification, Primary Forest, Secondary Forest, Regeneration, Vegetation Cover
Cite this paper: Eric Adjei Lawer, Bernard N. Baatuuwie, Kwame Ochire-Boadu, William Jasper Asante, Preliminary Assessment of the Effects of Anthropogenic Activities on Vegetation Cover and Natural Regeneration in a Moist Semi-Deciduous Forest of Ghana, International Journal of Ecosystem, Vol. 3 No. 5, 2013, pp. 148-156. doi: 10.5923/j.ije.20130305.07.
Article Outline
1. Introduction
- Timber is the most widely and controversially traded forest product which derives its bulk from natural tropical moist forests. Little of the accrued private profit or government revenue generated from the harvest of timber in tropical moist forests is used for restoration purposes in order to ensure future productivity of the forest resource[3] [30]. Situations in the world today where the environment is recklessly degraded by individuals and organizations reveal imminent danger to all life forms[29].Generally, natural forests are complex systems dominated by native species that regenerate themselves naturally. Logging in natural forests creates gaps which affect the regeneration process thereby resulting in the forest land being invaded by pioneer species. As such, the size of the gap created also influence the process of natural regeneration. Over the years, foresters have distinguished at least three growth and development reactions of trees to the environment (mostly in the case of gaps). They include light-demanding (heliophilous), half-tolerant and shade - tolerant (sciadophilous) tree species[26][31][32][33].Basically, the forest has been disturbed by human activities in varied forms (logging, agriculture, mining, etc.) and has thus degenerated into secondary forests resulting in vegetation cover changes[36]. Due to forces such as population pressure and poverty, humans have encroached on forest reserves to meet and satisfy their increasing and varying needs to the detriment of other less advantaged organisms resulting in their extermination or extinction through habitat loss[36]. The effect of these disturbances may result in the changing of particular vegetation cover types to others such as, from a forest to savannah grassland and subsequently a desert[14]. For instance, analysis of satellite images of some forest reserves in Ghana between 1990 and 2000 revealed rapid deforestation rates with some losing as much as 90 percent cover[27].The Tinte Bepo forest reserve like many other reserves in the world have not escaped the clutches and continue to suffer from these destructive human forces. As such this paper seeks to assess the effect of anthropogenic activities on vegetation cover as well as species richness and diversity of naturally regenerating tree species in the reserve.
2. Methodology
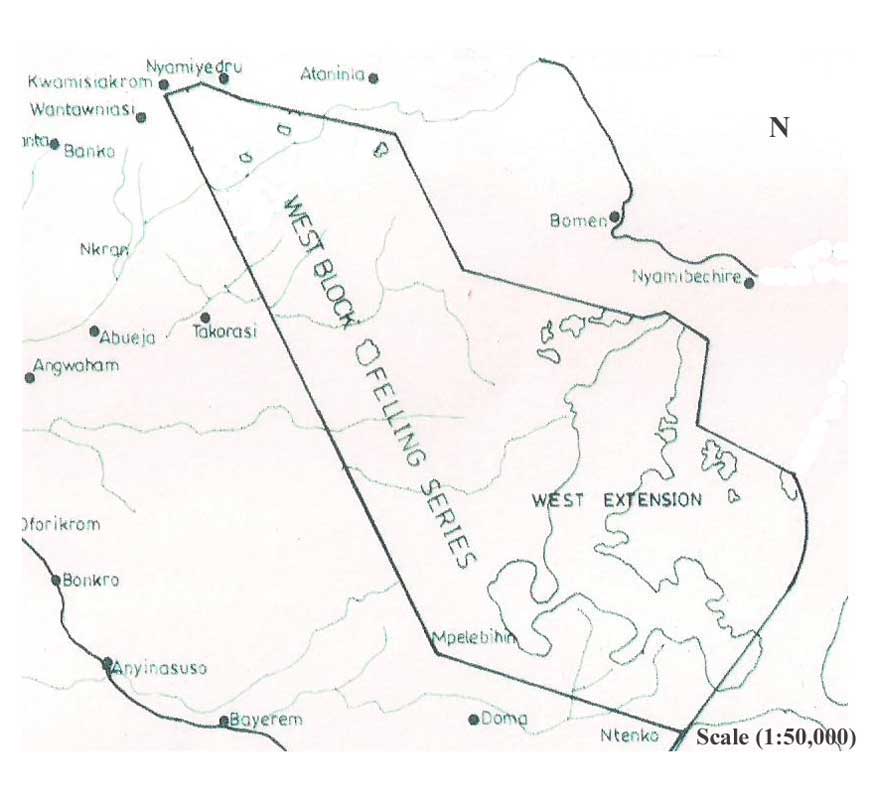 | Figure 1. Map of west block of Tinte Bepo forest reserve |
2.1. Study Area
- The study was conducted in the west block of Tinte Bepo forest reserve (Figure 1) located in the Ahafo Ano North District of the Ashanti Region, Ghana (latitude 6° 47′N and 7° 02′N and longitude 2° 26′W and 2° 04′W). The reserve is located in a moist semi-deciduous forest zone and has Celtis mildbraedii, Triplochiton scleroxylon and Nesogordona papaverifera being the dominant species within an estimated forest area of 11,551 hectares[17].
2.2. Data Collection
2.2.1. Satellite Images and Ground Data Collection
- Two Land Remote-Sensing Satellite (Landsat) TM digital images of the study area were obtained for the years 1986 and 2003 for analysis. To create accurate classifications one needs robust, ground-truth data obtained from a set of points called training samples. A Garmin 12XL GPS was used to randomly collect information on coordinates of various vegetation cover descriptions in 2009 for the validation of image classification.
2.2.2. Natural Regeneration
- A reconnaissance survey was carried out in the reserve to get a better idea of the field based on the change map generated. This aided in the classification of the forest into PF and SF thereby, minimizing differences in tree composition associated with elevation disparities. Six quadrats were then laid on a transect line identified and established in both forest types. Each quadrat had an area of 20x20 m2 and was separated by a minimum distance of 100 m. Composition of naturally regenerating timber species were collected of plants less than 2m of height[11]. Generally, they included seedlings (>1 cm collar girth and up to 0.5 m height) and saplings (>1 cm to <10 cm collar girth and >0.5 m to <2 m in height) with diameter at breast height less than 10 cm. Species were identified using a photo guide of forest trees in Ghana[21]. Identification of species was also done with the help of forest guards who knew their common and or local names. The local names were later cross-referenced with tree guides to obtain their scientific names. The frequencies of species in the reserve were also recorded.
2.3. Data Analysis
2.3.1. Satellite Image Processing
- Image classification is the process of taking the large quantity of complex data and simplifying it into meaningful categories. Classified images were created with two broad land cover categories namely forest (PF) and built-up (SF). Based on supervised classification of the processed images, the method of maximum likelihood was tested to map land cover and to define the forest areas removed. Unsupervised and supervised classifications were also performed resulting in pixel groups of similar levels of brightness (captures variation in soil reflectance/barren land), greenness (corresponds to vegetation) and wetness (associated with canopy and soil moisture) in order to generate a change map. The change map generated from images was used to identify decreases and increases in vegetation cover. A stratified random sample of the change image was then performed to measure selected points for quantifying the means of forest cover change.
2.3.2. Regeneration Density and Composition
- Difference in regeneration densities between forest types was analyzed using the General Analysis of Variance tool in GenStat (Version 10.3.0.0). This procedure is to determine how much of the variation in the observations are due to population differences and random variability[10]. Diversity of species within the forest was characterized using the Shannon-Weiner index[35] as indicated below.
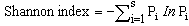 | (1) |
 | (2) |
3. Results
3.1. Vegetation Cover and Change
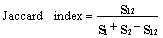
- The level of vegetation was determined through visual interpretation of the colors in the images of 1986 and 2003.The most significant change was observed in the classified image of 2003 as it contained a higher proportion of magenta indicating the volume of forest removed (Figures 2 and 3). The total areas of forest removed (built-up) in 1986 and 2003 were 10.8 ha (0.23%) and 1,698.21 ha (31.97%) respectively.The change map revealed that a very small proportion of removed forest had recovered and was thus represented by tiny specs of light green color. The patches of deep green which indicates the portion of forest unchanged is however reducing due to the significant pockets of red (forest removed) engulfing the reserve (Figure 4)
 | Figure 2. Classified image of the reserve (1986) |
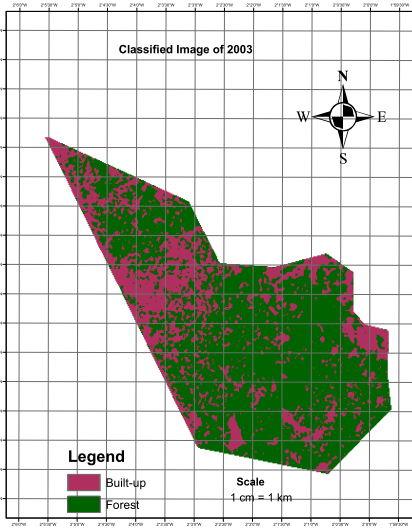 | Figure 3. Classified image of the reserve (2003) |
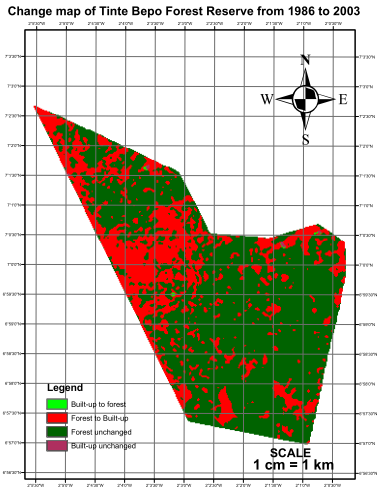 | Figure 4. Change map of the reserve (1986–2003) |
3.2. Natural Regeneration Composition, Density and Diversity
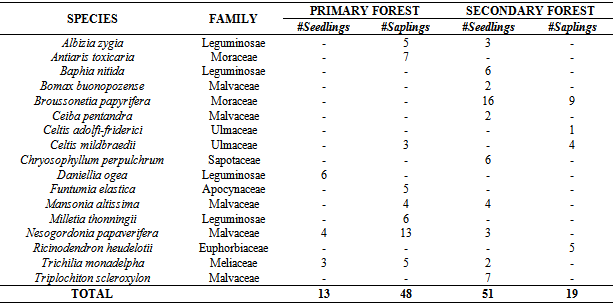
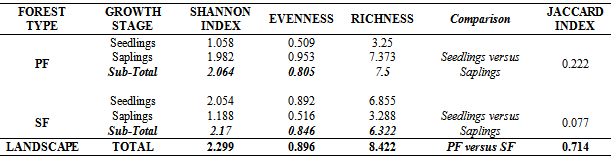
- A total of 17 species belonging to 8 families were identified during the study. The most diverse families were Malvaceae (29.4%) and Leguminosae (23.5%) with the least recorded by Sapotaceae, Apocynaceae, Euphorbiaceae, and Meliaceae having values of 5.9% each. Out of this, 9 species were found in PF while 13 species were recorded in SF (Table 1).
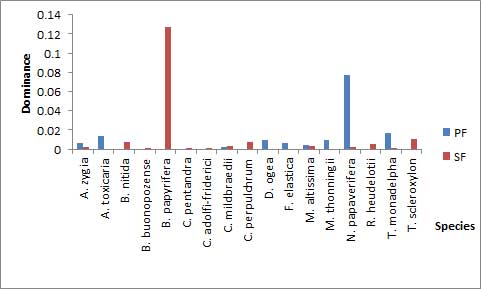 | Figure 5. Species concentration dominance in the reserve |
3.3. Similarity among Regenerating tree Species in the Reserve
- The results show that PF had a higher similarity index among seedlings and saplings (0.222) than SF (0.077) as indicated by the Jaccard index. Also, PF and SF showed some slight disparities in terms of all regenerating species found as it recorded a similarity index of 0.714 (Table 2). A tail of rare species (Figure 6) in SF as well as some uncommon species to PF was revealed in the study (Table 1 and Figure 5).
|
|
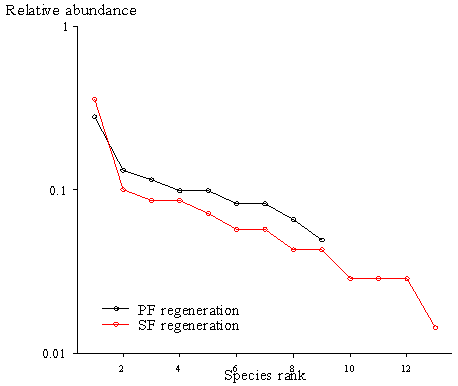 | Figure 6. Rank/abundance plot |
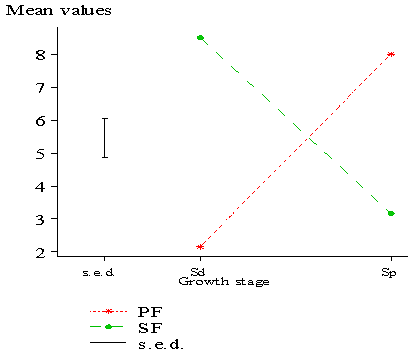 | Figure 7. Mean plot of seedlings (Sd) and saplings (Sp) |
4. Discussion
4.1. Vegetation Cover and Change Detection
- The mapped vegetation change indicated areas that had undergone some form of vegetation decrease or increase between image dates. The patches of forest cover as seen from the images could have been influenced by a varied number of anthropogenic factors and subsequent successions in the reserve[39]. Human activities that interfere with forest cover could be direct or indirect in forests[15]. Some of the direct causes that could have led to this include agricultural expansion (permanent cultivation), wood extraction (logging and wood for fuel) and infrastructure extension (development of roads) as this was evident in the field. The drivers (indirect) that might have led to this cover change in the forest could be economic (poverty and industrialization), technological (land-use intensification and wastage in wood sector) or demographic (population density and pressure)[1]. That apart, complex interactions between many factors such as, vegetation composition and structure, site quality (gradient) and fire intensity likely affected the degree of change observed in the study area[38]. The patches could have persisted due to the fact that species with greater sensitivity to site conditions such as light exposure and soil minerals were disfavored[28] resulting in little or no forest restoration and hence poor canopy closure. Thus, changes in vegetation cover over time and in space may have subsequent effects on natural regeneration of tree species.
4.2. Status of Natural Regeneration in the Reserve
- Creation of gaps in the forest canopy due to anthropogenic activities has an influence on forest condition and species composition. The decline in recruitment of seedlings to saplings in SF (examples: C. pentandra and T. scleroxylon) was also supported by[34]. They reported a decline in recruitment of individuals into higher girth classes for a forest following anthropogenic disturbance. Also,[13] reported that sapling densities of undisturbed forests were higher than disturbed forests. Thus, the greater number of saplings in PF indicates the composition of future vegetation[18].Based on the classification of[37], most of the species common to PF were non-pioneer (examples: F. elastic, Milletia thonnigii and A. toxicaria) while those common to SF (examples: B. papyrifera, B. nitida and R. heudelotii) were pioneer species[17][19][20]. On the whole, number of regenerated species (both seedlings and saplings) in SF was greater than PF. This difference was brought about by a higher number of seedlings in the former as a result of breakage in the canopy cover[31][33]. This breakage increased the intensity and amount of light reaching the forest floor to allow for light tolerant (pioneer) seed species in situ or transported from adjacent forest areas to regenerate. This may have accounted for the low similarity index among seedlings and saplings in SF due to succession by light loving species.[22] also affirmed that species composition in fragmented forests of Ghana differed among regenerating size groups. The gaps in SF favored the development of species not originally present or dominant (example: Broussonetia papyrifera) in the reserve whiles species originally present were reduced or are currently being threatened (examples: Celtis mildbraedii and Nesogordonia papaverifera). This may have resulted in the slight disparities in total regeneration similarity among PF and SF. For instance, Broussonetia papyrifera which was not found in PF was the most dominant species in SF. It has been reported to be an invasive species that is capable of colonizing large portions of degraded lands in most forest reserves of Ghana by some authors[2][12]. Thus, pioneer species are highly competitive in disturbed forests[4]. A study of Ghana’s tropical forests reveals that, the number of pioneer species increases while shade-tolerant species decreases following disturbance[8] and may have accounted for the low similarity index in SF. Forest degradation will thereby cause local extinction particularly of shade-tolerant species. As the intensity of human pressure increases, the importance of seedling recruitment from seed banks decreases[16] and shade-tolerant species become rarer[6][9]. Considering the ongoing anthropogenic disturbances and poor similarity in SF, the forest is likely to remain vulnerable for years to come. Only if the human exploitation is curtailed will the forest regain its natural state resulting in a higher similarity index. Conversely, the higher similarity index among seedlings and saplings for PF could be due to the continuous establishment of similar shade loving species under mature stands. Hence, the higher regeneration similarity for PF compared to SF is an indication of more rarer species shared by SF. The higher diversity index for saplings in PF compared to SF conforms with the findings of[20] who reported that the intensity of human pressure on forests had a direct and significant impact on species diversity. Some studies conducted on understorey diversity elsewhere reveal that, it peaks soon after disturbance followed by a long decline in diversity[5][24][40]. Though total regeneration diversity was high in SF, a much higher diversity index could have been measured for PF but the diversity values were reduced due to many individuals of a few species. This indicates that Shannon–Weiner diversity index is influenced by species richness and abundance[7]. Thus, the high diversity index for SF does not suggest that the reserve is healthy rather, it is threatened by reduction in numbers of dominant species and proliferation of invasive (and or pioneer) species .
5. Conclusions
- The study revealed that significant causes of change in the reserve was due to logging (especially illegal logging) and encroachment of reserve via farming particularly around the periphery where human settlements exist. The level of forest removed in 2003 was higher than in 1986. The research has shown that the recruitment of seedlings into saplings was significant in PF compared to SF. The diversity of saplings in PF was higher than SF indicating future vegetation composition. It was also observed that Broussonetia papyrifera was quickly invading the reserve. Thus, it indicates a threatened state of the reserve and its ability to continuously support timber and non-timber benefits derived by man. This information may be useful to managers in identifying opportunities for restoration efforts as well as formulation and implementation of management and conservation strategies to ameliorate the present condition.