Adnan Tarawneh1, Motasem Saidan2
1Princess Sumaya University for Technology, Environmental Management & Technology Department, Amman, Jordan
2University of Jordan, Chemical Engineering Department, Amman, Jordan
Correspondence to: Motasem Saidan, University of Jordan, Chemical Engineering Department, Amman, Jordan.
| Email: |  |
Copyright © 2012 Scientific & Academic Publishing. All Rights Reserved.
Abstract
Electronic waste is recently perceived as a problem confined to Jordan. The necessary regulations regarding the E-Waste are not yet in place. The principal aim of this study was to examine the public responses and level of awareness of E-waste among residential. Structured questionnaire survey was designed and demographically distributed to a random sample of households. The results were statistically analyzed and examined to represent the public responses and knowledge concerning the E-waste status. The research findings showed that a significant percentage of the responding sample have poor awareness and knowledge about the E-waste. However, more than 50% of the responding sample were aware about the importance of recovering of E-waste precious components. The fate of the E-waste based on the consumer behavior was investigated and the results showed potential change in E-waste generation if any cost-effective management policy is imposed. Mainly, since the prevailing public opinion (more than 90%) showed enthusiastic willingness for managing the E-waste. While, the percentages of responses of people who are willing-to-pay to manage the E-waste is relatively low, but it increases with the household income. The prevalent opinion was that the recycling companies and electronics producers/traders must be financially responsible for E-waste management program.
Keywords:
Electronic Waste, E-waste, Awareness, Public Opinion, Questionnaire
Cite this paper: Adnan Tarawneh, Motasem Saidan, Households Awareness, Behaviors, and Willingness to Participate in E-waste Management in Jordan, International Journal of Ecosystem, Vol. 3 No. 5, 2013, pp. 124-131. doi: 10.5923/j.ije.20130305.04.
1. Introduction
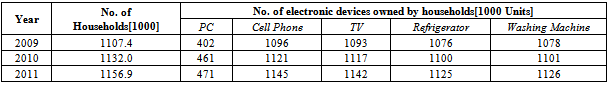
The usage of electronics has grown drastically in Jordan, due to rapid economic growth followed by urbanization, breakage of large traditional families into small families, large population growth, and growing rates of new households. Electronic waste (E-waste) is a generic term used to describe old, end-of-life or discarded appliances containing electrically powered components[1, 2]. It includes cell phones, refrigerators, and consumer electronics to computers which have been disposed of by their original users. E-waste contains both valuable materials as well as hazardous materials which require special handling and recycling methods.The E-waste in Jordan is still a new focus of environmental concern relatively. As any other developing countries, there is a difficulty to ascertain accurate data regarding the E-waste generation, reuse, recycling and disposal in Jordan. Mainly, because the E-waste is considered as part of the municipal solid waste. The total amount of Municipal Solid Waste (MSW) generated in Jordan in the period of 2002-2015 is projected to grow from 1.56 million tons in 2002 to 2.49 million tons over this period[3], and disposed at 20 sites[4]. The growth in MSW generation is 3.0%/year, and it is a function of population growth, economic growth and the extent to which people adopt "consumer" and "disposable" lifestyles. The data identify that; the amount of waste generated on a per capita basis will grow from around 303 kg/person/year to around 350 kg/person/year over the period of 2002-2015. By far, the majority of the MSW (85+ %) is managed through landfill disposal. Moreover, there is no specific literature on E-Waste generation and management in Jordan aside from few reports prepared by Ministry of Environment. A report was released by Ministry of Environment entitled “State of Electronic & Electrical Waste in Jordan” in 2009. Previously, an assessment of E-Waste and E-Waste recycling facilities was prepared by Jordan Environment Society (JES), 2006 – 2007, as a project of re-using computers. However, Jordan ranks an abysmal 84th on the 2005 Environmental Sustainability Index[5], and for Environmental Governance gets only the 55th rank, with a score of 0.27 (the highest being Iceland with 1.65 and the lowest Iraq with -1.52). Moreover, Jordan has a rank with 70th on the 2008 Environmental Performance Index with a score of 76.5[6]. In Jordan, as it is in the developing countries, electronic scrap is managed through various low-end management alternatives such as product re-use, conventional disposal in landfills, open burning and backyard recycling[7]. People in Jordan normally send their dysfunctional electronics to the electro-technicians to be repaired. It happens that they in turn get money selling their dysfunctional appliances or reparable devices. After that, the electro technicians’ garages become collecting points of E-waste that the waste-traders and recyclers are visiting periodically for bulk-purchasing purposes. Informal recycling of waste electronic goods in developing countries is emerging as a new environmental challenge for the recent century[8]. Clearly, the financial profit is the main incentive for the E-waste collectors, scavengers, and recyclers, but not environmental awareness. According to the annual reports of the Jordanian Department of Statistics in 2009, 2010, and 2011[9,10,11], the numbers of households that own electronic devices and the types of these electronic devices are shown in Table 1. Obviously, the total number of these electronic devices is drastically increasing due to the population growth and other factors as stated before.The principal aim of this study was to examine the people’s environmental knowledge, public responses and level of awareness of E-waste. The specific objectives of the research was to:§ identify the extent of awareness of the study community to E-waste concept;§ evaluate the citizens awareness to the ways of dealing with electrical domestic devices if damaged (or cannot be repaired);§ measure the citizen awareness to the importance of having a law or policy to regulate or manage Electronic Waste. | Figure 1. Map of Jordan |
2. Materials and Methods
2.1. Area of Survey
The structured questionnaire has been distributed in 2011-2012 by a survey in the North, Middle, and South of Jordan, in regions that have proper attitudes, values, traditions, etc. Mainly in Irbid, Zarqa, Amman, Karak, and Aqaba cities, as shown in Figure 1. The survey has taken into consideration rural and urban regions as well.
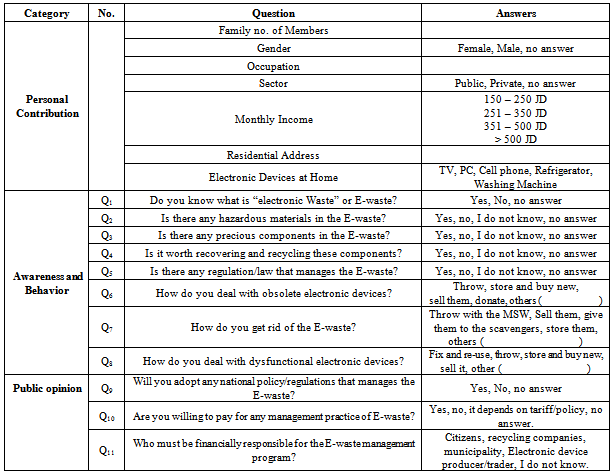
2.2. Questionnaire Design and Data Collection
A total sample of 816 persons and/or households have been randomly surveyed and the survey questionnaire has been administered by means of interviews. The sample represents perfectly the population in terms of gender, demographic distribution, work sector, monthly income, household number of members. In fact, how the sample of questionnaire respondents reflects the composition of the population of concern is very important.The structured questionnaire has been designed to have three components: (1) the people’s knowledge of E-waste; (2) the people’s E-waste consumption behavior and E-waste fate (3) the willingness of the survey sample to adopt E-waste collection and management system.The questionnaire covered three categories of questions with 10 multiple-choice questions as shown in Table 2. The first category of the questionnaire contains the personal contributions such as gender, occupation, number of the family’s members, and monthly income, as well as types of electronic devices at home. While the second category (Q1 – Q8) is designed to obtain data to verify the people’s E-waste consumption behavior and E-waste fate. The third category is (Q9 – Q11) to obtain inputs and responses to evaluate the willingness of the survey sample to adopt E-waste national policy and/or management system, and to identify the responsibility of managing such system/program.The data obtained from the survey were coded, processed, and then analysed using SPSS13.0. and Logistic Regression model to explore the influence factors on willingness and behavior of residents in the survey area.Statistical analysis of sampling accuracy indicated that a systematic random sample of 816 questionnaires will result in a mean sampling error (e) of ±3% at the 95% significance level (α =0.05), and a standard deviation (S) of 0.5[11, 12].
3. Results and Discussion
The results of the questionnaire analysis were divided according to the categories of questions into demographic factors analysis, awareness assessment, and consumer behavior analysis.Table 1. Electronic Devices owned by Jordanian households[9,10,11]
 |
| |
|
Table 2. The category and contents of the designed questionnaire
 |
| |
|
3.1. Social Characteristics
A total of 816 completed questionnaires were processed for the analysis of the public opinion and knowledge of the citizens on the E-waste. The analysis of this category included the responses to the questions concerning the gender, demographic distribution, work sector, monthly income, household number of members, and the electronic devices at home. All of the respondents (individuals and households), who have participated and been interviewed in this questionnaire survey, were Jordanians. As to households, the average number of family members were 4-5 members/per family, which is compatible with the number of family members estimated by the Jordanian Department of Statistics[13]. The data indicated that 67% of the participants were male participants in the survey, and 33% were female participants. The data also showed that responses from different cities in Jordan, as shown in Figure 2, have been achieved. Obviously, the vast majority of the survey sample (59.1%) was done in Amman city. However, 20.1% of survey sample was done in Irbid, then in Jarash with the percentage of 13%, Aqaba with the percentage of 6.6%. The lowest participation in the survey was done in Al-Karak (1.2%).The percentages of the survey participants who are working in public and private sectors were 35.3% and 34.6%, respectively. However, 30.1% of participants were jobless. In rate of income terms, as shown in Figure 3, those who earn JD500 and more represent 52% of the sample, and those who earn between JD 351-500 represents only 30.4%. Those who earn between JD 251-350 and JD 150 - 250 were 10.5% and 4.1%, respectively. The percentage of those who have not answered this question was 3%.
3.2. Level of Awareness Toward E-Waste Concept and Components
The survey sample responses to question no. Q1 in the category concerning awareness toward E-waste showed that 49.5% of the study participants are to certain extent knowledgeable about the E-waste. However, 2.5% of the sample participants have not answered this question, and the remaining (48%) did not know about the E-waste. It is worth mentioning that the level of awareness is highly influenced by the lack of information.Moreover, with Q1 the following question no. Q2 was asked to the interviewed people:” Is there any hazardous materials in the E-waste?”. Only 31% of the participants showed awareness responses about the hazardous characteristics of the components of the electronic devices and E-waste. However, those who answered “No hazardous components are in the E-waste” were 22%, and the remaining (47%) has expressed no knowledge about this subject. Therefore, the responses of this question showed poor awareness.As to the responses concerning the question no. Q3 of the existence of precious materials in the electronic devices and E-waste, surprisingly, 71.3% of the participants acknowledged such awareness. The percentage of those who answered “No” was 23.4%. The remaining 6.3% did not respond to this question. Regardless of the this result, the level of awareness on the E-Waste knowledge is still insufficient, this was clear where 48% from the respondents did not know what is the E-Waste. On the other hand, when the survey participants were asked about their opinion concerning the recycling and recovering of these E-waste materials and components, as in Q4, 53.7% of them showed this willingness, however, 29.6% answered “No” because of their uncertainty about the hazards behind the recovering way of these components. With question no. Q5, the following question was asked to the people interviewed: ‘Is there any regulation/law that manages the E-waste?” and aimed at evaluation the people awareness regarding the E-waste management and national policies. About 91% of the sample responded that the E-waste is normally dealt with as any other item of MSW, and there is no specific program for collecting and separating any of the generated E-waste items. However, 9% of the sample responded by “I do not know”. In fact, there are no regulations specific to E-waste management, as well as, no rules to ban Jordanians from any domestic trading of post-consumer electronic and electrical equipment generated within the country. Importing of used EEE is banned in Jordan according to the hazardous waste management Acts under Law No. 43 of 1999. Thus, no permission has been given to any authority or person by the Ministry of Environment thus far. Locally, there is no policy is imposed regarding the E-waste integrated management (collection, separation, recovering, safe disposal, and/or landfill) in Jordan. The E-waste is dealt with as a municipal solid waste, and accordingly, the E-waste is collected and managed.
3.3. The E-Waste Fate Based on the Consumer Behavior
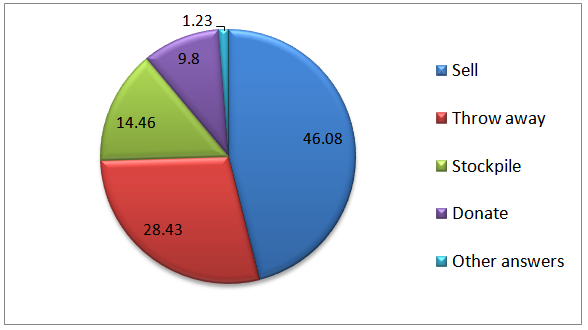
In order to evaluate the social behavior of E-waste consumption, the results related to the questions of this category are presented and discussed. Question no. Q6 and Q7 are aimed at verifying what is the fate of the obsolete electronic device when it becomes as an E-waste. About 46.08% of the respondents prefer to sell those devices to second-hand shops; while 28.43% of the respondents deal with the E-Waste as a solid waste and throw the device away; however, 14.46% of the respondents would store and keep these obsolete devices and they purchase new ones, 9.8% of the respondents would donate these devices. The obtained percentage results are shown in Figure 4.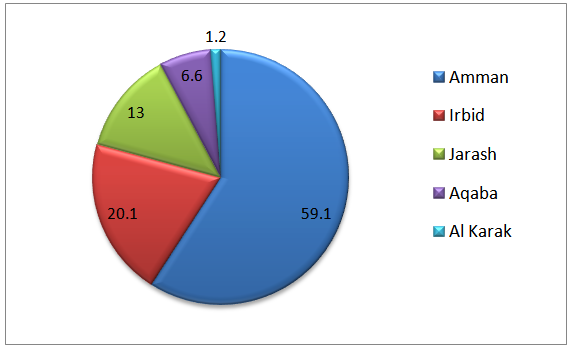 | Figure 2. Geographical distributions of the survey questionnaire samples |
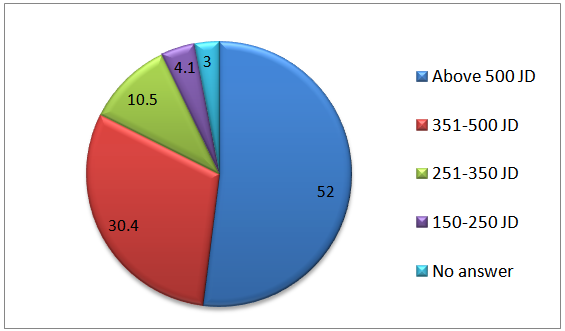 | Figure 3. Monthly income rates of respondents |
 | Figure 4. Consumer behaviors toward obsolete electronic devices |
 | Figure 5. Consumer behavior toward E-Waste disposal practices |
 | Figure 6. Consumer behavior toward dysfunctional but repairable electronic devices |
Table 3. Average percentage of answers to ‘‘public opinion” question no. Q10
 |
| |
|
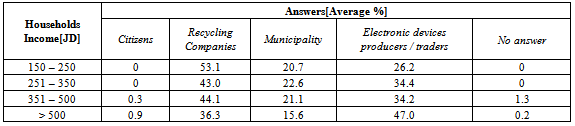
Table 4. Average percentage of answers to ‘‘public opinion” question no. Q11
 |
| |
|
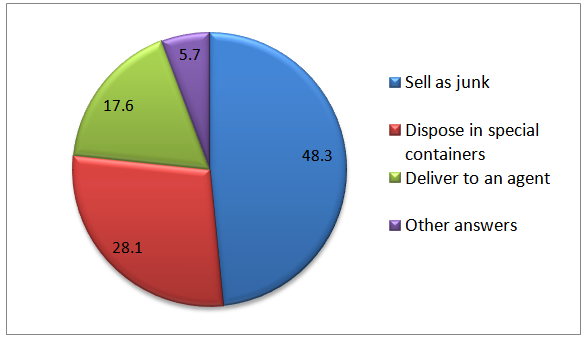
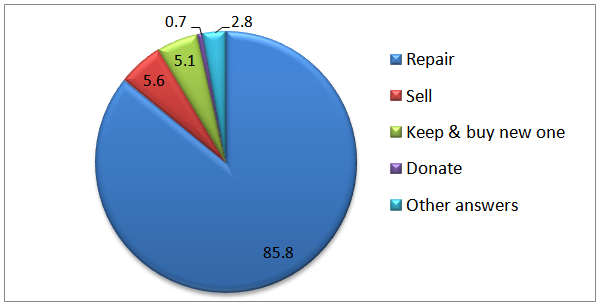
However, as to responses regarding question no. Q7 concerning the way that the participants normally get rid of these E-waste, the responses results are shown in percentages in Figure 5. Obviously, both of those 48.3% who preferred to sell the E-waste to a junk store and 17.6% who are willing to deal with a responsible agent (producer, trader, recycler, etc), to help them getting rid of this E-waste, are showing significant response to cast the concept of Extended Producer Responsibility, and eventually implement it or any other tailored management concept. While 28.1% of the participants showed willingness and readiness to separate and The E-waste from the municipal solid waste and participate in any E-waste management system.Regarding question no. Q8 concerning the dysfunctional electronic devices that can be repaired, the majority of the sample (85.8%) expressed their tendency to fix and reuse these devices. This behavior scenario should be encouraged because it will play a vital role in minimizing the E-waste annual quantities and it will motivate the “Reuse behavior’ among the social community. Moreover, the other behavior scenario is the “ Store Behavior” where 5.1% of the sample has showed it by keeping the dysfunctional device and buy a new one. The other the responses results of this question are shown in percentages in Figure 6.
3.4. The Public Willingness-to-participate and Opinion Toward E-waste Policy
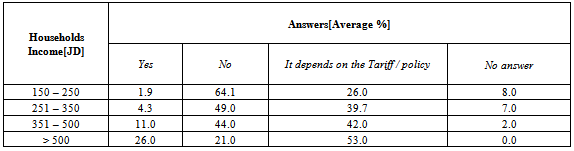
The public opinion towards the necessity for establishing of E-waste management policy is particularly influenced by the survey sample difference in terms of personal behavior and awareness. Question no. Q9 was aimed at verifying the participants readiness and willingness to adopt and implement any cost-effective E-waste management policy and/or strategy. This question is significant in the light of the absence of any imposed laws and regulations to manage the situation of serious E-waste growing quantities in Jordan. About 90.4% of the survey participants showed enthusiastic willingness for having a policy or law that regulates the E-Waste based on effective integrated management system. The 9.6% of participants preferred not to answer this question until they are fully aware of the details and requirements of any proposed E-waste management regulations. With question no. Q9, the following question no. Q10 was asked to the people interviewed: “Are you willing to pay for any management practice of E-waste?”. The obtained percentages are summarized in Table 3.Table 3 showed that the higher the monthly income of the households, the more percentage of their willingness-to-pay they expressed. However, since all households are paying a tariff for the MSW collection and disposal, and since the generation of the E-waste is not as frequent as the MSW, then between 26% to 53% of the study participants have insisted on knowing the value of the tariff and the details of the policy before they decide whether they will pay such cost to safely participate in getting rid of their E-waste. However, the households with the lowest monthly income showed less interest and willingness to pay for E-waste management and disposal policy.However, the final question in the survey, question no. Q11, was asked to identify the households opinion regarding who must be financially responsible to run and manage any E-waste management program. Table 4 summarizes the average percentages of the survey participants responses based on the households monthly incomes.As shown in Table 4, it is obvious that the percentages answers of the sample households are strongly dependent on their monthly income. However, the responses of the households with lowest monthly income showed more confidence in the recycling companies to financially run and manage any E-waste collection and management program. Moreover, they showed no acceptance to incur any financial costs for managing the generated E-waste. The responses of both JD 251 – 350 and JD 351 – 500 shared a consensus responses regarding this question. They both showed more confidence in recycling companies and electronic devices producers and less acceptance for the municipality to financially run and manage the E-waste management program, because they are convinced that the private sector offers better and satisfied services. More importantly, the recyclers and producers may pay more based on negotiation. However, the households with monthly income higher than JD500 responded with more willingness and acceptance for the electronic devices producers/traders to financially manage the E-waste management program, because they believe that such companies are professional and aware about their products and how to recover, recycle, and dispose the E-waste components. Also, they believe that extending the responsibility of producers and traders on the collection, recovering, recycling, and disposing of the E-waste items and components will enhance and quality of these electronic devices, increase the durability, and eventually decrease the cost of the product. General speaking, all of the survey respondents showed more and less the same percentage of acceptance for the municipalities to financially run the E-waste management program. They also showed no willingness to incur any levy for such management program, regardless of their monthly income amount.
3.5. Study Limitations
The present study has the following limitations: First, the study ignored the gender issue and its influence on the study responses. This is because of the subject of the study which directly deals with households who own electronic devices, and their behavior when these devices become obsolete. The survey team has asked the household active member (husband and/or housewife) and took the responses from both of them or anyone who is more enthusiastic to effectively answer the survey questions. Second, the study has not discussed the age influence on the subject of the survey. This is because the study was interested in families who own electronic devices. In most of cases the individuals are not separate from their families and they are not responsible in purchasing new devices or get rid of the old ones, so their responses will not reflect the real situation. Third, it was not successful to compare the public opinion and awareness among the survey chosen cities. This is due to the limited sample size in some of these cities. So making such comparison will come up with heterogeneous output that will not help in making good argument or justification. Finally, the study focused on the consumers of the electronic devices and their behavior in dealing with the E-waste, however, no E-waste scavengers, policy makers, recyclers, and producers have been interviewed. Admittedly, some of those society important components have refused to participate, and others tried to give false inputs just to scatter the analysis, so their inputs have been discarded.
4. Conclusions and Recommendations
The outcome of the public opinion study of E-waste situation in Jordan has provided the policy makers with significant information and vital inputs that help them in orienting their efforts towards setting up of cost-effective E-Waste management policy. The following research findings can be pointed out: § Approximately half of the survey sample showed awareness and knowledge about the E-waste. However, poor awareness were obtained about the hazardous characteristics of the components of the electronic devices and E-waste.§ Better level of awareness were showed by those who expressed knowledge regarding the existence of precious components in the E-waste. While, more than half of the survey sample showed willingness for recovering of these components. However, only one third of the sample were skeptical regarding the health hazard behind E-waste components recovering.§ The responses regarding the E-waste fate based on the consumer choice were very useful to investigate the influence of this behavior on the generation of E-waste in Jordan. Consequently, other management scenarios (such as recovering and recycling activities) and systems (Extended producer responsibility) can be proposed to change the consumer behavior. § Policy based on economic considerations was proposed in the survey. The majority of the sample showed acceptance for having E-waste management policy but without incurring any levy. Depending on their monthly income, the majority of the respondents showed more confidence on the recycling companies and electronic devices producers to run any proposed E-waste management program.
References
| [1] | EU (2002) Directive 2002/96/EC of the European parliament and of the council of 27 January 2003 on waste electrical and electronic equipment (WEEE) — joint declaration of the European parliament, the council and the commission relating to article 9. Official Journal L037:0024-39 |
| [2] | Pucket, J., Smith, T., 2002, Exporting harm: The high-tech trashing of Asia the Basel Action Network, Seattle 7 Silicon Valley Toxics Coalition. |
| [3] | Ministry of Environment, 2004, Final Country Report, Amman- Jordan. |
| [4] | Alfayez, E. K., 2008, Solid Waste Management in Jordan: Present Situation and Future Challenges, Middle East Recycling, Waste & Environmental Management Exhibition & Congress, Dead Sea - Jordan. |
| [5] | Esty, D., Levy, M., Christine, K., Srebotnjak, T., de Sherbinin, A., 2005, The 2005 Environmental sustainability index: benchmarking national environmental stewardship, New Haven: Yale Center for Environmental Law and Policy |
| [6] | Esty, D., Levy, M., Christine, K., Srebotnjak, T., de Sherbinin, A., Mara, V., 2008, The 2008 Environmental Performance Index, New Haven: Yale Center for Environmental Law and Policy. |
| [7] | Furter, L., 2004, E-waste has dawned. Resource, 8–11. |
| [8] | Osibanjo, O., Nnorom, I.C., 2008, Material flows of mobile phones and accessories in Nigeria: Environmental implications and sound end-of-life management options. Environmental Impact Assessment Review, 28, 2-3, 198-213. |
| [9] | Jordanian Department of Statistics, 2009, Annual Report 2009, Jordan. |
| [10] | Jordanian Department of Statistics, 2010, Annual Report 2010, Jordan. |
| [11] | Dillman, D. A., 2007, Mail and Internet Surveys: The Tailored Design Method, 2nd ed., Hoboken, NJ: John Wiley & Sons. |
| [12] | Salant, P., and Dillman, D. A., 1994, How to Conduct Your Own Survey, New York: Wiley. |
| [13] | Jordanian Department of Statistics, 2011, Annual Report 2011, Jordan. |
 Abstract
 Reference
 Full-Text PDF
 Full-text HTML