-
Paper Information
- Next Paper
- Previous Paper
- Paper Submission
-
Journal Information
- About This Journal
- Editorial Board
- Current Issue
- Archive
- Author Guidelines
- Contact Us
International Journal of Ecosystem
p-ISSN: 2165-8889 e-ISSN: 2165-8919
2012; 2(5): 112-139
doi: 10.5923/j.ije.20120205.05
Using Geo-Information Systems in Assessing Water Quality in the Mid-Atlantic Region Agricultural Watershed of Maryland
 Abstract
 Reference
 Full-Text PDF
 Full-Text HTML
E. C. Merem 1, R. Isokpehi 2, D. Foster 1, J. Wesley 1, E. Nwagboso 3, C. Romorno 1, C. Richardson 1
1Department of Urban and Regional Planning, Jackson State University, 3825 Ridgewood Road, P.O. Box 23, Jackson, MS 39211, USA
2Department of Biology, Jackson State University, 1400 JR Lynch Street, Jackson, MS 39211, USA
3Department of Political Science, Jackson State University, 1400 JR Lynch Street, Jackson, MS 39217, USA
Correspondence to: E. C. Merem , Department of Urban and Regional Planning, Jackson State University, 3825 Ridgewood Road, P.O. Box 23, Jackson, MS 39211, USA.
| Email: |  |
Copyright © 2012 Scientific & Academic Publishing. All Rights Reserved.
The applications of agricultural fertilizers, manure and pesticides continue to degrade the quality of streams in different areas of the country including the mid-Atlantic region of Maryland, USA. This paper adopts geo-information systems based method and primary data to assess the status of water quality. Emphasis is on the issues, factors, current efforts and a case study to demonstrate the trend and future line of actions. The results point to a decline in water quality and other environmental resources in the study area. Land use practices threatening the quality of agricultural watersheds were also spatially detected in the area using Geographic Information Systems (GIS). Aside from the current efforts of the state agencies anchored in management, conservation and monitoring of impaired water bodies. The paper offered some recommendations and framework for dealing with the problems. These lines of action ranged from the need to strengthen current policy on land use to the development of regional agro geo-info systems.
Keywords: Water Quality, Agricultural Watersheds, Geo-Information Systems, Environmental Resources
Article Outline
1. Introduction
- This paper adopts geo-information systems based method and primary data to assess the status of water quality trends in an agricultural watershed in the Maryland area of the Mid-Atlantic region. Emphasis is on the issues, current efforts, factors, and a case study to demonstrate the trend and future line of actions. The applications of geo-information system can be helpful in detecting land use practices that threaten the quality of agricultural watersheds[1]. It has the potentials to enhance the design of viable frameworks for the efficient management of water resources in stressed environments with the latest advances in spatial technologies[2, 3, 4]. In the literature, the vital roles of riparian buffers within agricultural watersheds in protecting biodiversity are highlighted in numerous studies[5]. However, in the Mid-Atlantic region of the state of Maryland where agriculture ranks as a leading industry and a major user of land, water quality issues from the sector continue to be a major problem. In the study area, the Chesapeake Bay watershed and other river systems in the state are threatened by various anthropogenic stressors[6]. Pesticides as an essential part of those stressors that are occasionally ignored pose enormous danger to the health of stream habitat species and the local communities[7]. While nutrient overloading duly garner much of the interest now, current studies indicate thatpesticide residues are not only found all through the Chesapeake watershed, but they surpass permissible levels set under water quality standards. In the Bay, where agriculture stands as a key source of pesticide and nutrient pollution of streams[8], the continuous discharge of surplus nutrients into the estuary constitutes a major hazard to the surrounding ecology. Accordingly, the Chesapeake Bay, one of the nation’s precious river systems has now become the site of degradation due to the rapid pace of contamination occurring in the area[9]. Elsewhere Vadas[10] identified groundwater nitrogen and phosphorous levels on a profoundly discarded poultry-grain farm on Maryland’s lower Eastern Shore along the Chesapeake Bay. In a similar work, Hall[6] designed an ecological risk assessment approach to illustrate the menace of copper and cadmium exposure in the Chesapeake Bay. To deal with these problems in other water bodies such as the Patuxent River, The US Geological Survey (USGS) and the Maryland Department of Natural Resources have partnered since 1985 to gauge nutrient level and suspended loads from non-tidal streams in the Patuxent River Basin[11]. Because of the benefits of such initiatives, in the assessment of farm related water quality issues, natural resources managers and agencies are using Geographic Information Systems (GIS) to manage various land uses in a watershed[12]. In realizing these benefits, several scholars have been channelling their GIS data management expertise towards the calibration of watershed and water quality models for the past several years[13].Numerous studies exist in the literature with focus on watershed protection using GIS. In implementing a framework for modelling the impact of land use practices and protection alternatives on nitrate pollution of groundwater in agricultural watershed, Almasri and Kaluarachichi[14] adopted GIS to identify the spatial dispersion of ground nitrogen sources and the corresponding loadings in the state of Washington. Further use of spatial technologies involves a study by Russell[15] that examined the role of GIS in selecting sites for riparian restoration based on hydrology and land use in San Luis Rey River watershed in California. While in other studies, Liu[16] developed a GIS interface that integrates soil and water assessment tool (SWAT) and riparian ecosystem management model (REMM) for estimating water quality benefits of riparian buffers in agricultural watersheds in southern Ontario Canada. Maillard[17] combined a cartographic modelling tool using GIS and statistics to measure the strength of the relationship between water quality, land use, and distance from stream on a large watershed in South Eastern Brazil. Other related studies worthy of mention are those of Prakesh[4] and Davies[3] both authors emphasized water management and GIS analysis of land use composition and catchment areas on a landscape respectively. Turning to the trends at the national level in the United States, it is worth mentioning that the applications of agricultural fertilizers, manure and pesticides continue to degrade the quality of streams in different areas of the country. In some areas, nutrient concentrations are not only at elevated levels in agricultural areas, but pesticides especially herbicides remain widespread in agricultural watershed areas. Convinced that higher levels of these substances are harmful to humans and biodiversity, a USGS work on various agricultural watersheds in the country in the last decade ranked urban and agricultural point source chemical pollution to be major issues. Water quality conditions and the health of aquatic environments as the study indicates are predicated on different variables such as land use, the use of chemicals, management practices, population density and watershed development. Another element of the USGS work touches on concerns about large presence of nitrates and phosphorus in surface water at levels that contribute to too much algae. Notwithstanding the elevated levels of nitrate in shallow ground water adjacent to farmlands, pesticides are widespread and detectable in over 95% of rivers sampled. At the same time, herbicides especially, atrazine and its breakdown product desethylattrazine exist in higher concentrations in agricultural streams than in metropolitan waters[18]. For more information, see the work of De winner[2]; Min[19]); Nelson[20]; and Nengwong[21]. Concerned about the effects, Luo[22] notes that sediment load from agricultural watersheds constitutes a threat to the quality of downstream waters in many areas. In the process, the risks of accumulation of sedimentation in watersheds are becoming prominent with disturbances in the hydrology and soil productivity with some impacts on the economic and environmental profile of water systems. The transportation of nutrients into watersheds results in altered hydrological conditions and pollution that threaten fisheries and other living organisms. Realizing the perils Chambers[23] notes that non-point sources of nitrogen and phosphorous remains major causes of eutrophication of surface waters in agricultural watersheds. Elsewhere, Qiu[24] opines that agricultural runoff remains a major pollution source threatening water quality in streams, lakes and public drinking water reservoirs. In an investigation of the combined effects of best management practices on water quality, Knight[25] shows that success comes not only from cultural BMPs, but from structural measures as well. For related studies see the work of Kyle[26]; Peng[27]; and Knight[25].The problems are further compounded by the role of several socio-economic factors and the lack of access to spatially referenced information showing the mounting threats to stressed watersheds. This can be evidenced by looking at the way different variables such as the prevailing land use types and host of other elements largely associated with the problem in various locations are rarely captured spatially. Notwithstanding the meagre efforts through policy initiatives and watershed management approaches in dealing with the issues, knowledge of the dangers posed by water quality degradation and declines in biodiversity demands a geo based assessment of management practices within agricultural watersheds. For an efficient agro-watershed management in the Mid-Atlantic region of Maryland, a geospatial system anchored in GIS needs to be developed. Such a system has the potential to provide managers spatially referenced data with opportunities to locate stressors and changes threatening agro-watersheds of the Mid-Atlantic region of Maryland[1]. When used properly, GIS can perform the role of an integrating support tool to store, analyze and manage spatial information on hydrological models in order to furnish rational means for strengthening decision making[2]. This paper uses geo information systems based method and primary data to assess the status of water quality in an agricultural watershed in the Maryland area of the Mid-Atlantic region. There is a focus on the problems, the present initiatives to curb the problems, an environmental change case study to capture the trends, socio-economic elements fuelling the issues and some policy recommendations. The paper has five objectives. The first aim is to contribute to the literature on geo-information systems while the second objective is to device a support tool for decision makers. The third one focuses on the development of novel method for identifying water quality stressors in an agricultural watershed. The fourth objective is to provide a viable framework for efficient management of water resources using the latest advances in geospatial information systems. The fifth objective is to analyze the watershed trends in the Mid-Atlantic region of Maryland.
2. Methods and Materials
2.1. Study Area
- The study area of Maryland is situated on the Atlantic coast of the Southern region of the United States. From the Census data in 2007, Maryland ranked as the richest state in the United States, with a median household income of US$65,144. During the fiscal year 2004, The Bureau of Economic Analysis put Maryland's gross state product (GSP) at $228 billion. Two counties in the state, Howard and Montgomery are ranked as the third and seventh richest counties in the country.
 | Figure 1. The study area of Maryland |
 | Figure 2. The distribution of watersheds in Maryland |
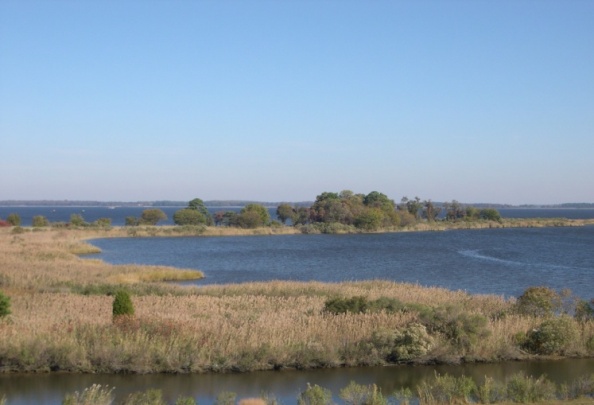 | Figure 3. Tidal wetlands of the Chesapeake Bay |
|
|
2.2. Methods Used
- This paper applies geo information systems based method and primary data to assess the status of water quality in an agricultural watershed in the Maryland area of the Mid-Atlantic region. The study stresses a mix scale approach involving the use of descriptive statistics, regression, correlation analysis and geospatial technologies of GIS in processing data provided through government sources and data bases from other organizations. For the purposes of analysis, the regression component of the methods is presented in section 3.5 with the correlation values. Although the analysis yielded several other statistical residues but those dimensions with acceptable correlation values were retained. This technique was chosen after carefully scrutinizing a range of other possible solutions. It is capable of producing a solution on related elements that can be interpreted very easily and as such, it is better suited for the type of analysis required in the paper. The raw spatial data made up of maps and other kinds of digital information used in the research came from the United States Geological Surveys (USGS) data procurement unit, United States Department of Agriculture, (USDA) and the United States Environmental Protection Agency, (EPA) the Government of Maryland and the United States Census and other organizations such as the University of Maryland On line data unit.
2.3. Step 1: Data Acquisition
- The first step involves the identification of the variables needed to assess the temporal spatial aspects of change influencing water quality trends on agricultural watersheds within counties at the state level. The spatial units of analysis consisted of the counties located in the state of Maryland (Table 3). The variables encompasses socio-economic and environmental data, including land cover elements (of the amount of farmland, fertilized areas, number of impaired watersheds, impaired watersheds due to nutrient flow) population, percentages of change for farmland, percentages of change for population, percentage of change for fertilized areas, sales from agriculture and the percentage of change, etc. This process continued with the design of data matrices covering the various periods from the 1970s, 1980s, 1990s, 2000s, and beyond. In addition, to the design stage, access to databases and abstracts that are presently available within the Federal and state archives in the state of Maryland and the USGS, the USDA, US EPA and host of other entities quickened the search process. The spatial data on state of Maryland used in the study cover regions and watersheds in the area from the separate periods of 1970 through 2005.
2.4. Step 2: Geo Spatial Data Acquisition and Processing
- For the study area of Mid-Atlantic Region of Maryland, multi-temporal spatial data made up of shape files and maps were obtained for the study. The data that were assembled for Maryland cover the various counties of Anne Arundel, Caroline, Dorchester, Kent, Queen Anne’s Somerset, Talbot, Worchester, as well as the metro area counties of Montgomery, Prince George’s, and Baltimore. There were also sizable information covering other counties along the Chesapeake Bay region, the Maryland East shore and other watersheds in the state with a focus on socio-economic and ecological data, shape files, paper and digital maps between 1970 to 2005. All the spatial and temporal data were run through available ARCVIEW and SPSS data processing soft wares. The outputs consist of texts, tables and maps as well as matrices. The processed data displayed under different legends makes ecological and stream habitat variables like water appear as shades of common colors while the other socio-economic and ecological variables were distinguished in different colors as well. Furthermore, the output was visually compared with the trends evidenced in the area to see the changes across time and space along the tributaries of the major agricultural watersheds of the Mid-Atlantic region of Maryland. The remaining procedure involves spatial analysis and output (maps-tables-text) covering the study period using ARCVIEW GIS. This process helped show the extent of temporal-spatial evolution of ecological change induced by agriculture and development activities. It provided opportunities to undertake the sequential mappings of the nature of stressors impacting the water quality in the streams of the Mid-Atlantic Region of Maryland. The idea behind this approach stems from the advantages of carrying out precise delineation and assessment of water quality trends along agricultural watersheds using geospatial information systems in the region. Accordingly, the analysis of water quality trends in agricultural watershed using GIS to capture ongoing disturbances not only improves our knowledge of the scale of changes occurring in these systems, but it provides a framework for evaluating ecosystem decline and the mechanisms for restoration. Considering the usefulness of geo information system in detecting land use practices that threaten the quality of agricultural watersheds, it has enormous potentials in the design of frameworks best suited for the management of water resources in stressed environments. For a brief discussion, of the efforts to deal with water quality problems in the area see Appendix A.
3. Results
3.1. Environmental Analysis
- This part of the paper presents the results of descriptive statistics and temporal-spatial analysis of environmental change with GIS, regression and correlation analysis on a set of indicators associated with stream quality decline already outlined in the methodology. It consists of the snapshot of ecological variables of fertilized areas, impaired water areas, farmland, etc., and socio-economic elements from population to agricultural sales in the region. Later, it highlights the factors fuelling the problems in the study area.
3.2. Fertilized Acreages of Agricultural Land
- From Table 3, note that there is a widespread use of fertilizer along the 24 counties in the state between 1987, 1992, 1997 and 2002 fiscal year. The temporal distribution shows that in 1987, the state of Maryland had a total of 3,598,939 acres of land treated with fertilizer. In the ensuing years of 1987, 1992, 1997 and 2002 respectively, about 3,495,845, 3,723,473 and 3,539,140 acreages of farm land were under the direct applications of more fertilizers. Among the individual 24 counties of the state during the four periods, Queen Anne’s had more land under fertilizer use than the other areas. The figures for Queen Anne’s county ranged from 341,716 in 1987, 417,438 in 1992, 399,969 during 1997 and 354,533 in the year 2002. Aside from Queen Anne’s, five other counties made up of Caroline, Carroll, Frederick, Kent, and Talbot with identical areas of fertilized land were quite active in the applications of chemicals. The size of land treated with fertilizer in these counties during the periods of 1987-2002 in the state exceeded over 200,000 acres than those of the other counties. In the 1987 period, Caroline county started with 235,106 acres of land under fertilizer treatment, by 1992, the number rose to 265,492. In the following periods, the county saw its area of land treated with fertilizer jump to 275,285 in 1997 and 303,043 acres in 2002. Elsewhere, Carroll County had an opening value of 255,057 in 1987, that number changed to 227,489 in 1992 only to pick up steam again with 296,424 in 1997 and 267,048 in 2002. With the exception of 1987 when fertilizer use at Frederick County was estimated at 291,045 acres, the figures for the ensuing years consisted of 320,195, in 1992, 309,968 in 1997 and 326,897 in 2002. Kent county use of fertilizer on farmland during 1987 stood at 256,180, 261,153 in 1992,306,495 in 1997 and 243,725 299 in 2002. Within the same periods, Talbot county farmers fertilized close to 256,740 acres in 1987, 244,269 in 1992, 212,328 during 1997 and 237,724 by 2002 (Table 3). While some of the counties not examined here fully posted modest and high gains in the use of fertilizers. The overall use of fertilizers point to a mix of gains and declines over the years for the individual counties but when tallied for the entire state in terms of the percentage of change, the use of fertilizer varied from -2.86% in 1987-1992 to -4.95 during 1997-2002. During that period, Queen Anne’s county use of fertilizer grew at a rate of 22.15% in 1987-1992 until it dropped to -4.1% between 1992-1997and-11. 35% during 1997-2002. At Caroline county, the use of fertilizers grew most of the time at a rate of 12.92%, 3.68% and 10.08% while in the county of Carol where fertilizer use fell to -10.81, -9.9 % during 1987-1992 and 1997-2002 respectively, the growth rate in 1992-1997 rose by 30.31%. In the county of Frederick, the use of fertilizer rose to 10.01% in 1987-1992 and fell to -3.19% in 1992-1997 and grew further again by 5.46 % in 1997 to 2002. In spite of fertilizer acreage declines of -4.85% and -13.07 % between 1987-1992, 1992-1997 at Talbot county, there were still sizable growth of 11.90% fertilizer applications in the county (Table 3).
3.3. Impaired Water Areas
|
3.4. Farm Land
- The information as indicated in Table 5 describes the farmland use for some of the selected counties. The size of farmland in the entire state of Maryland in the periods under analysis consisted of 1,443,677 in 1992, 1,385,741 in 1997 and 1,355,910 acres during the 2002 fiscal year. Among the sixteen selected counties, six counties (Caroline, Dorchester, Kent, Queen Anne’s, Talbot, Worchester) had higher agricultural land values of over 100,000 acres than the others. The opening value of farmland for Caroline county estimated at 126,981acres in 1992 slid to 111,316 acres during the 1997 period until it moved up to 114,843 acres in 2002. Dorchester County' whose initial agricultural land size of 123,762 acres in 1992 tumbled to 122,928 acres by 1997, devoted about 125,385 acres in 2002 to farming. At Kent County the size of agricultural land in the area were estimated at 131,283, 117,526 and 117,372 respectively during 1992, 1997 and 2002. Queen Anne as the county with the largest concentration of agricultural land contained about 165,349 acres in 1992, 167,957 during 1997 and 155,566 in 2002 while Talbot County that started with 109,108 acres in 1992 saw its size of farmland jump to 109,572 in 1997 until a late fall to 105,729 acres in 2002. At the same time, Worchester County’s opening value of 107,519 acres rose to 111,835 in 1997, and 131,249 in 2002.
|
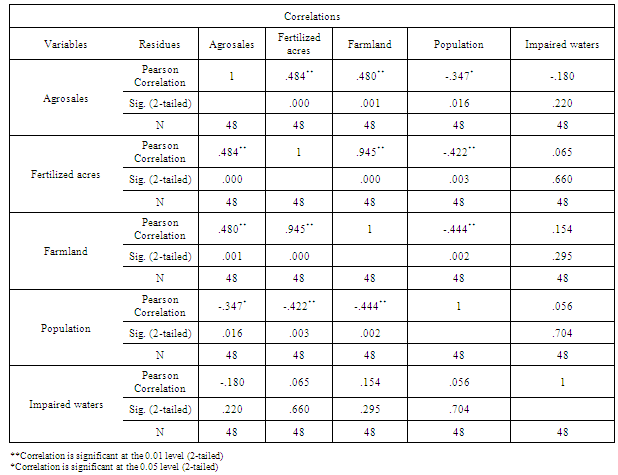
3.5. The Summary of the Regression Analysis
- To buttress the relationships between the different variables, with emphasis on the correlation values, the regression analysis was carried out on the data from Maryland coastal counties (16). The results on the matrix presented in Table 6 indicate the impaired waters are positively related to fertilized acres, farmland and population. As was mentioned before, most of the coastal counties have 2 or more number of impaired waters in 1998 and they continued to have at least 1 impaired water areas till 2004. This is due to the flow of nutrients from the adjacent farmland areas. The population variable also shows an increasing trend in almost all the counties from 1980s-2000.
3.6. Spatial Analysis
- The acreages of land treated with fertilizers presented in blue appeared quite enormous and visible in every scale from 1987, 1992, 1997 and 2002. Also, note how fertilizer treatment exceeding 100,000-400,000 acres remained visibly concentrated in different parts of the state most of the time (Figures 4 -6). The geographic dispersion of the impairment as a result of nutrient flow represented in red color were much more pronounced in both the North and South East shore of the state along the coast. The state has sizable numbers of watersheds across space under impairment over the years due to the flow of nutrients. These impaired water bodies appeared most of the time in 1998, 2002 and 2004. Even though the patterns of 1998 and 2002 spatial distribution seemed somewhat similar, notice how the slight patches of impaired areas in the Southeast area of the state faded lightly in 2002 and 2004 (Figures 7-9). Having said that, it is evident that the Chesapeake Bay and other water bodies are still threatened by fertilizer nutrient flows.
|
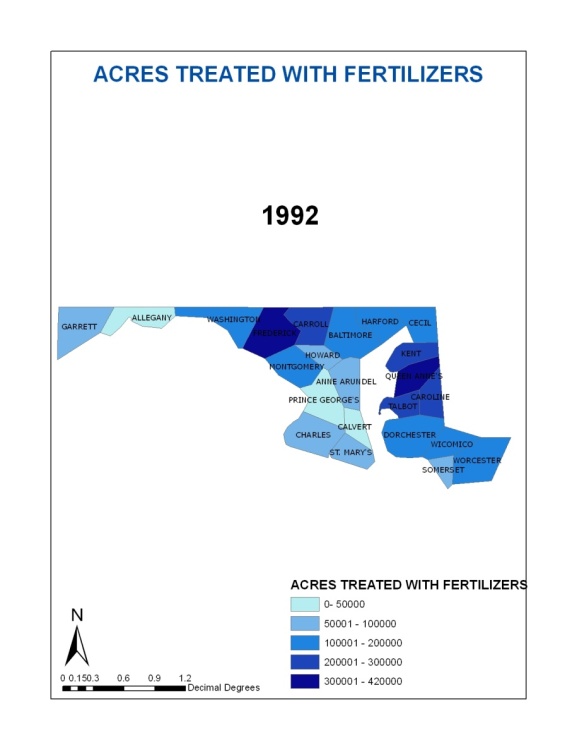 | Figure 4. Acres of land treated with fertilizers |
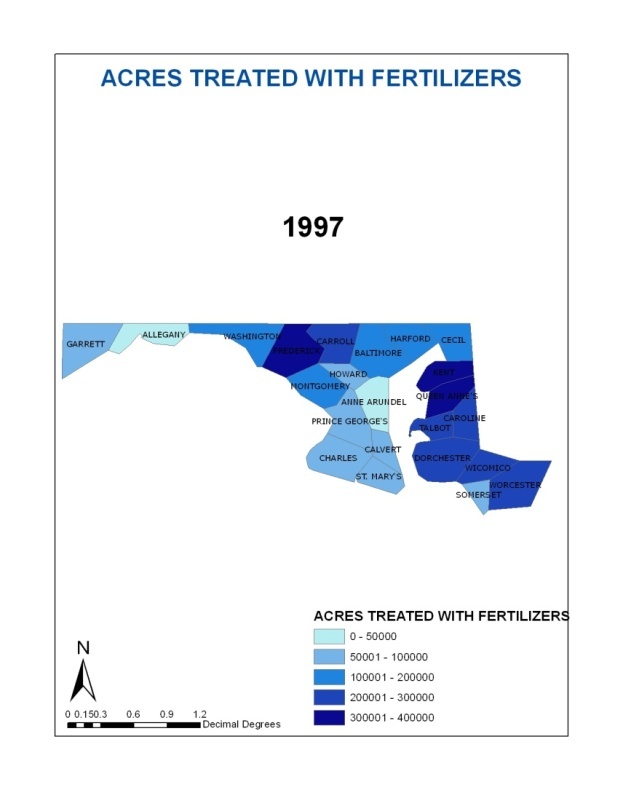 | Figure 5. Acres of land treated with fertilizers |
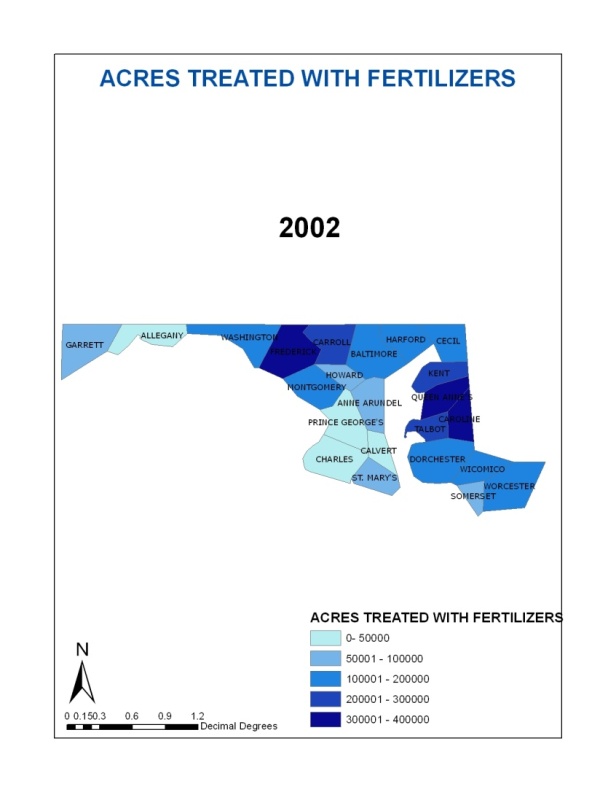 | Figure 6. Acres of land treated with fertilizers |
 | Figure 7. Impaired watersheds due to nutrients in Maryland, in 1998 |
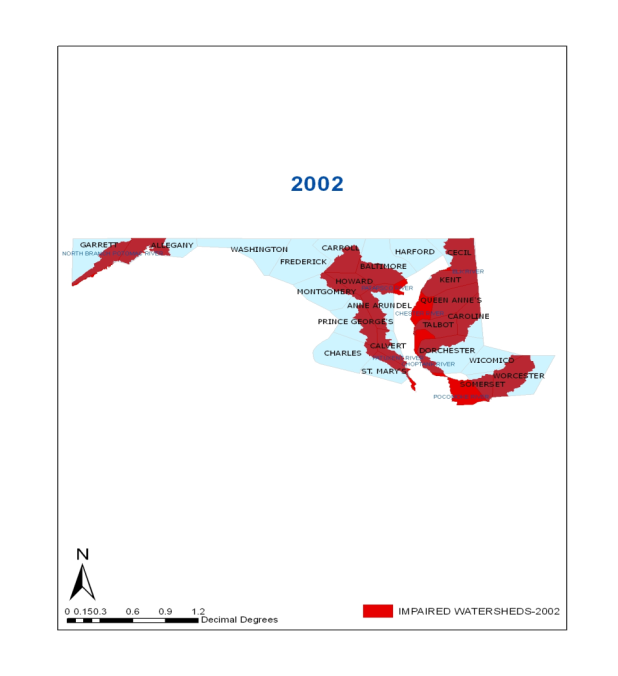 | Figure 8. Impaired watersheds due to nutrients in Maryland in 2002 |
 | Figure 9. Impaired watersheds due to nutrients in Maryland in 2004 |
 | Figure 10. Farmland in acres in 1992 |
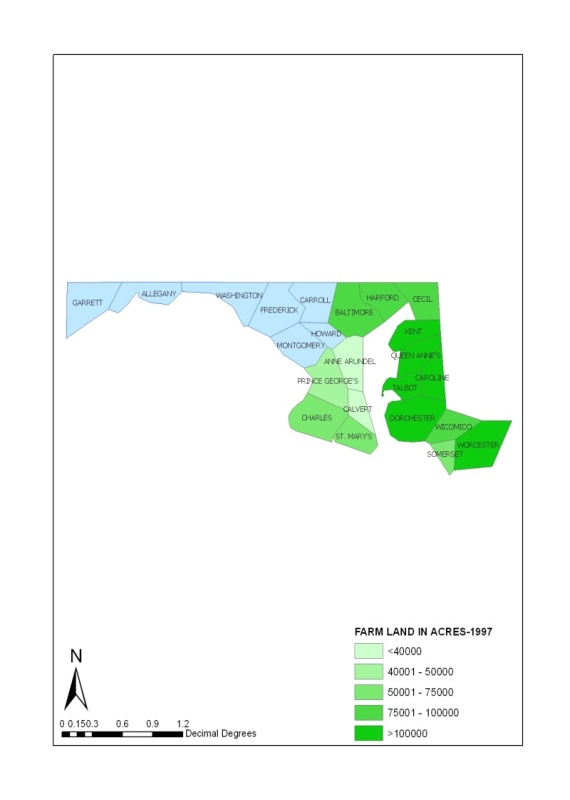 | Figure 11. Farmland in acres in 1997 |
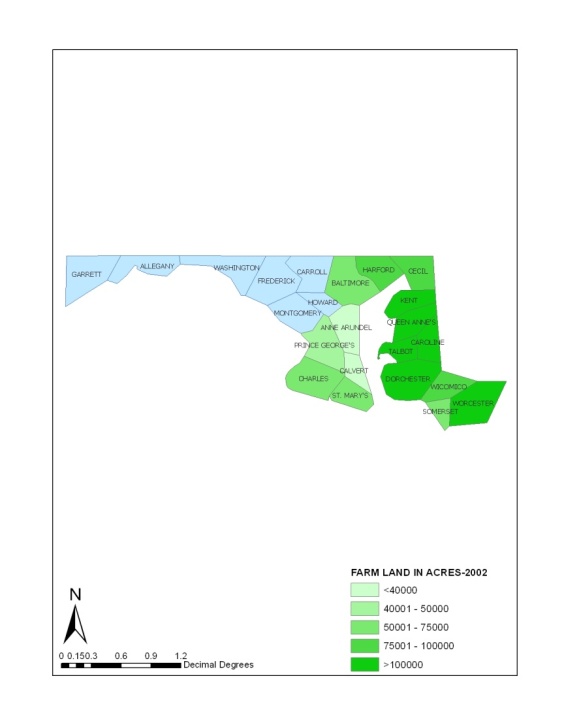 | Figure 12. Farmland in acres in 2002 |
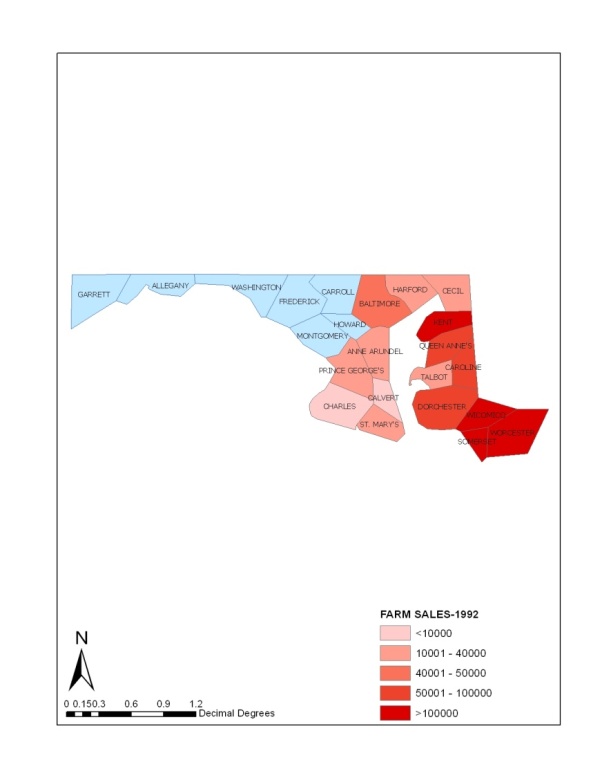 | Figure 13. Total agro-sales from farmlands ($1000) in 1992 |
 | Figure 14. Total agro-sales from farmlands ($1000) in 1997 |
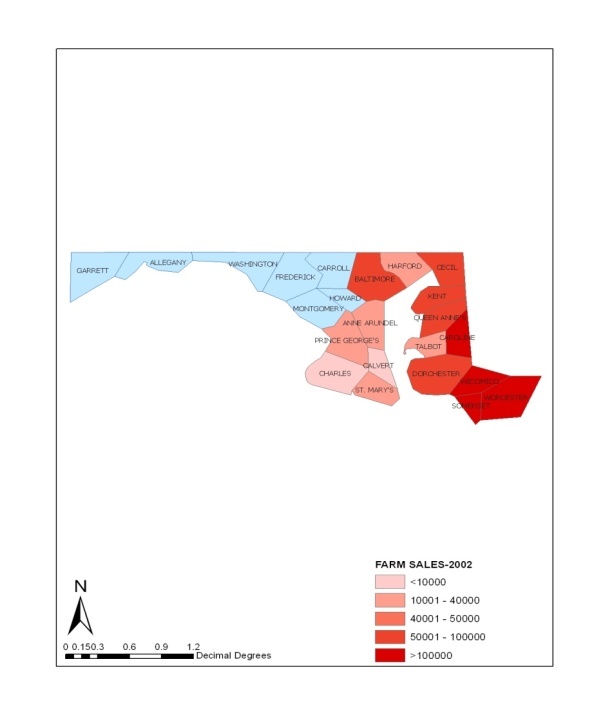 | Figure 15. Total agro sales from farmlands ($1000) in 2002 |
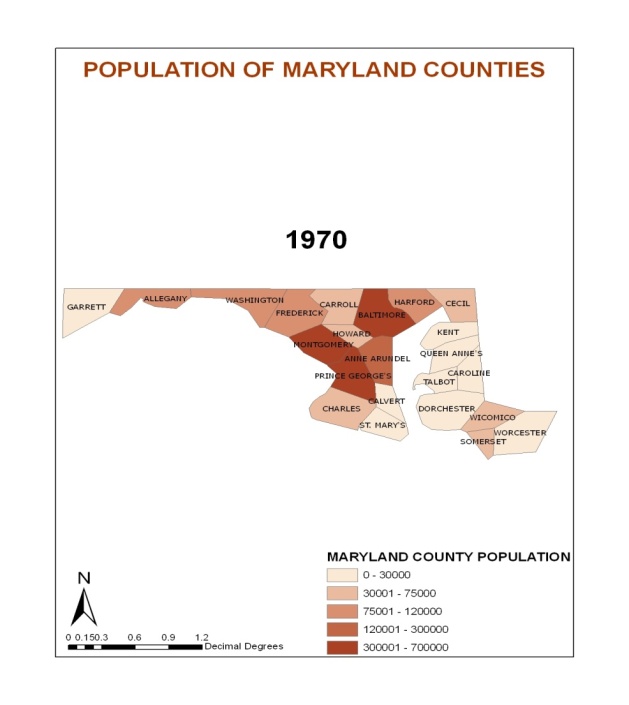 | Figure 16. Spatial distribution of population in 1970 |
 | Figure 17. Spatial distribution of population in 1980 |
3.7. Socio-economic Factors That Influence Water Quality
- The extent and nature of environmental change leading to water quality threats and degradation in the study area did not occur in a vacuum. Several socio-economic elements that played a role in the process are highlighted in this section of the paper.
 | Figure 18. Spatial distribution of population in 2000 |
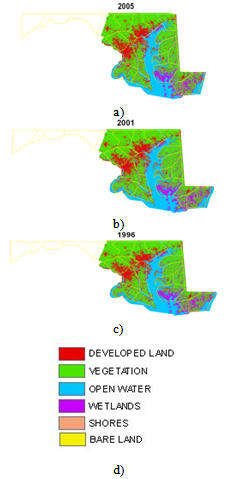 | Figure 19. Land cover maps for Maryland from 1996-2005. Source: www.USGS.gov |
3.8. Demography and Urban Growth
- The study area boosts of some of the largest urbanized areas such as the Washington-Baltimore metro areas. The area has been experiencing one of the most extensive forms of urbanization brought about by rapid pace of economic development. In the process, the population of the state in nearly four decades moved from an initial estimate of 3,016,640 in 1970, to 3,430,200 in 1980. In the remaining decades, it grew from 4,044,739 in 1990 to 4,645, 332 in 2000 (Table 7). Of these periods, large population concentration of over half a million was quite notable in 3 major urban centers. Among those counties, Baltimore had a population of 621,107 in 1970, 655,615 by 1980, 692,134, during 1990 and 754,292 in 2000. Prince Georges county from the Table had over 660,000 residents in 1970 and 1980, by the following decades the population climbed to 728,553 and 873,341 in 1990 and 2000 respectively. Montgomery county whose population stayed at 522,809, and 579,053 in the decades of the 1970 and 1980, emerged as the county with the largest population in 1990 at 757, 027 and 873,341 between 1990 and 2000. In terms of percentages of change, note that while the population growth among the counties far exceeded declines, the total for the state grew by 13.70% during 1970 to 1980, 17.91% between 1980 through 1990 and -14.84 % from 1990 to 2000. This increase has brought high population concentration along the coasts adjacent to the basin at the expense of watershed ecosystem protection (Table 7).
|
3.9. Economic Development and Agricultural Activities
- The economic buoyancy of the state and its counties has already been described on the study area section and as a result, I do not intend to rehash some of the economic factors in this section. There is no doubt the pressures unleashed from economic development has a bearing on the factors threatening water quality in the state. Other economic elements of environmental change likely to impact the quality of streams in the area can be evidenced from the pace of agricultural sales in the region. The volume of farm sales in the study area seemed quite significant among the 17 counties under analysis. Table 8 shows that the total for the counties were $12,203,898 in 1992, $1,139,230 in 1997 and $981,732 in 2002. In the same periods, aside from the large volume of sales for Anne Arundel county estimated at $11,234,000 in 1992, during the other years of 1997, and 2002 the value of tradable farm goods for the county estimated at $12,621 and $10,978 appeared quite miniscule compared to the other top four counties. During that period, the sales from agro-products seemed quite extensive in the counties of Kent, Somerset, Wicomico and Worchester. In 1992 and 1997, Kent County led most counties with $171,317 and $194,131 with the exception of 2002 when the sales figure plummeted to $66,836. Among the other group of counties with significant agricultural sales, Somerset sold farm products worth $102,881 in 1992, $92,532 and $127,277 in 2002. Following a similar path, the sales figures for Wicomico went from $164,682, $186,294, $174,594 between 1992, 1997 and 2002 while Worchester county made sales valued at $131,302,$147,553 and $123,450.In looking at the table generally, notice that the percentages of change from agro-sales stayed on the rise in 13 out of 16 counties between 1992-1997 while 11 counties in 1997-2002 faced severe declines. The only counties that experienced losses in the first years of 1992-1997 were the counties of Anne Arundel at -99.88%, Prince Georges with -14 % as well as Somerset whose sales declined by -6.17%. Conversely, the gains from sales in farm products in 1997-2002 rose in Baltimore County by 21.45%, 9.71 % in Caroline county, 16.18 % in Cecil, 1.79% in Dorchester and 31.07% at Somerset (Table 8). Notwithstanding the gains from farm sales, the externalities from agriculture in the form of nutrient flow into watersheds threaten biodiversity habitats.
|
4. Discussion
- The results not only reveal that the study area experienced some changes across time and space but the estuarine environments and stream quality along the watersheds are threatened by agricultural nutrients run-off and stressors unleashed by current land use activities and other elements. In light of that, the adjoining natural areas along the counties under analysis such as watersheds remain under stress[1]. Over all, the analysis in the literature on the study area and the result of the data analysis point to signs of growing incidence of pollution involving extensive use of pesticides, fertilizer applications and the impairment of water bodies. The presence of large geographic diffusion of fertilizer applications along the counties in the agricultural watersheds of the Mid-Atlantic region exposes the water systems to a great danger[38]. This is similar to the experiences of Savannah River Basin of Georgia as shown in a previous study by Merem and Twumasi in 2008[1]. Judging from the trend, the increase in human settlement as indicated by population growth and the stress from large urban centers and the level of agricultural intensification needed to support large metro areas triggered the loss of arable farmland around the surrounding ecology of the agricultural watersheds[37]. Increased agricultural land use activity known to precipitate large use of agrochemicals like herbicides, pesticides and other type of nutrients as the analysis showed, grew to a great extent at very significant rates especially in much of the state counties. The temporal distribution from 1987-2002, indicates that the state of Maryland had millions of acres of agricultural under fertilizer applications. At the county level, about eight areas were actively involved in widespread spraying of fertilizer on hundreds of thousands of acres of agricultural land that exceeded those of the other counties. With this development, not only were many of the study area’s agricultural water bodies in the counties grossly impaired from nutrient flow, but in those circumstances indicators like agricultural activities likely to spur pollution through fertilizer application, pesticide use, and herbicides were quite visible in the counties[37, 38]. With population exceeding over ½ a million in three core counties (Baltimore, Montgomery, Prince George’s county areas), it is evident that some of the urban counties and those along the costal and agricultural watersheds have very high concentration of human populations likely to exert pressure on the estuarine habitats and the quality of water resources in the agricultural watersheds. In a state bustling with growth, demands for novel development programs in the form of new structures and infrastructure designs likely to create more access to previously protected surface water areas occur at the expense of the surrounding ecology of the region. At the same time, socio-economic indicators of agricultural sales, farmland loss and population as a measure of the intensity of land use activities and transactions centered on sprawl seemed quite pronounced. Large volume of revenues from high agriculture sales and boom in fertilizer and agrochemical use and infrastructure to serve a timing population can put some added stress on the sensitive watersheds as run off from agriculture and other land uses ooze into watersheds already stressed beyond their capacities. All these point to the growing role of socio-economic and human factors fueled by development in orchestrating the threats by stressors to water quality in agricultural watersheds. To buttress the linkages between some of the variables, a correlation analysis confirmed a direct relationship between impaired water surfaces and increase in fertilizer acres, farmland use in the region and population growth. Similar conclusions were also reached on pollution trends in Southern Mississippi Region[39]. The environmental change analysis using GIS in the area identified a cluster of counties where land use activities involving agricultural farming and the widespread applications of fertilizers threatening the environment and stream habitat quality remained visible[1]. From the spatial and temporal analysis, the fresh water ecosystem appears threatened by the growing numbers in the impairment of water bodies in certain areas and widespread use of fertilizers during farming activities[38]. In fact, the geographic dispersal of nutrient flow sites seem fully concentrated along watersheds such as the Chesapeake Bay and the tributaries of other river systems within the environment due to intense development and human settlements activities.In light of this finding, the practical applications of a mix scale approach involving GIS, connected to descriptive statistics and correlation analysis stand as a contribution to the literature pertaining to GIS[37, 38,39, 40]. In tracking the extent to which human activities involving land use impact water quality on agricultural watersheds in coastal environments of the Mid-Atlantic Region of the State Maryland, the study expanded our understanding of novel tools for identifying water quality stressors. Notwithstanding previous efforts to remedy the problems of the impacts of human activities on water quality along the Chesapeake Bay and other water bodies, geospatial technology of GIS as demonstrated in this project has been quite effective in ensuring the mapping of change related information on the agricultural watersheds within a spatially referenced system. As an effective tool for resource management, integrated data analysis using GIS modelling, facilitated the analysis of spatial distribution of stressors fuelling water quality decline and agricultural watershed change[1,38]. Such spatial information technology is of great importance for decision making process in Maryland as managers tackle those problems threatening the water quality within the agricultural watersheds of the state[38].
5. Conclusions
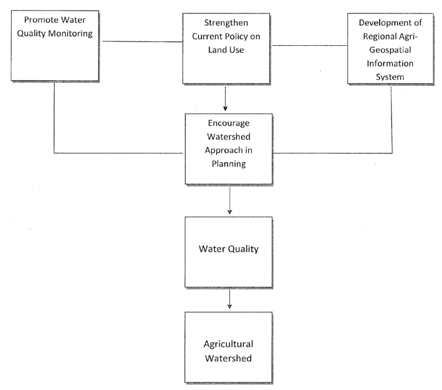
- In this section, we provide a summary of the conclusion with some recommendations. To deal with the problems identified in this research, this portion of the paper offers four abbreviated recommendations anchored in continuous assessment and the protection of the state’s agricultural watersheds. The recommendations for minimizing the problems range from the need to strengthen land use policy, water quality monitoring, the design of spatial information systems and the support for watershed planning framework. See Appendix B for a detailed highlight of the recommendations and the organizational chart outlining the framework.From the onset of the paper, the literature rightfully identified the threats pesticides and agrochemicals pose to water quality. Using geospatial technology of GIS, the paper shows that human-activities and land use lead to the degradation of agricultural watersheds. The results of geo-based analysis in the region point to declines in water quality and other environmental resources in the study area.The assessment of water quality trends and the elements inhibiting it on agricultural watersheds of the Mid-Atlantic region of Maryland using GIS not only enhances our understanding of the scale of changes occurring in these environmental systems, but it provides a framework for assessing watershed ecosystem decline and the mechanisms for mitigation. Nonetheless, in the last decades large levels of nutrient loads in agricultural watersheds triggered by farming and human activities continue to erode the environment and life support systems along the Mid-Atlantic region of the state of Maryland. The results not only reveal that the study area experienced some significant changes in its watershed environments, but the water bodies such as the Chesapeake Bay and host of others within the shores of Maryland are under serious stress. Over all, the results point to threats to water quality, growing incidence of pollution, impairment of water bodies, and increase in human settlement, and agricultural intensification. Several ecological change indicators made up of fertilizer applications, number of impaired watersheds, the use of farmlands and nutrient flow were quite pronounced especially in areas adjacent to watersheds. Other aspects of the results show that socio-economic factors of population and income from agricultural sales, grew in some of the areas. The pressure unleashed from these variables as the analysis showed, puts enormous strain on water quality along the agricultural watersheds. The environmental change analysis in the area using GIS identified a cluster of several land cover type in the form of agricultural areas under use, size of land under fertilizer use, impaired water areas and the diffusion of socio-economic indicators (stress sources) in affected areas. Accordingly, spatial technology of GIS as demonstrated in this paper has been quite effective in ensuring the sequential mapping of stress factors along the estuarine environments in the Mid-Atlantic region of State of Maryland. Being a valuable device for resource management, integrated data analysis through GIS quickened the assessment of geographic diffusion of the variables inhibiting water quality on the watersheds and change involving land use, population pressure and elements of pollution threatening riparian corridors. To mitigate the problems, the paper provided four recommendations ranging from policy to the adoption of watershed approach in planning. The expectation is that the recommendations listed here would help minimize the issues facing the study area. In conclusion, geospatial information technology adopted in the study has great potentials in assisting policy makers in the state assess the elements inhibiting water quality along the agricultural watersheds in the Mid Atlantic State of Maryland. Adopting such an approach offers planners the much needed information for tracking the geographic diffusion of stressors in a watershed environment. At a time when governments are grappling with the problems posed by the widespread degradation of watersheds, the study helps us improve water resource management in three ways. Firstly, it displays spatial location of stressors and management practices that inhibit water quality not previously known by managers and stakeholders whose land use activities trigger the problem. Secondly, managers and land users can benefit from the design of a viable tool that not only enhances education and best management practices but also the acquisition of knowledge in dealing with threats to water quality within agricultural watersheds. Thirdly, it can provide a comprehensive framework that other programs elsewhere can utilize to coordinate activities on individual watershed issues. These benefits will only increase with the applications of geospatial information systems in the assessment of water quality within stressed agricultural watersheds in the years ahead. Much of the findings and observations herein are consistent with others in the literature such as those by Merem and Twumasi, Winner, Prakash, Ryan, Hall, Borbor and McConnell[1,2, 4, 5, 6,7,8].
 | Figure 20. The Recommendation Framework |
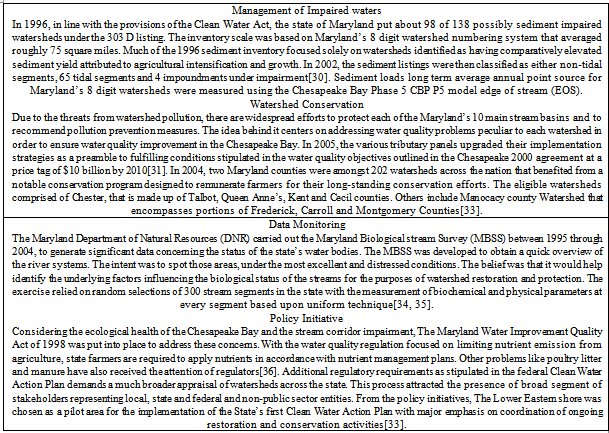
Appendix A
- Efforts to deal with water quality problems
Appendix B
- Recommendations and Strategies


ACKNOWLEDGEMENTS
- The authors would like to thank the US Department of Home Land Security, Science and Technology Directorate for Award 2011-ST-062-000048. Disclaimer: the viewes and conclusions contained here are those of the authors and should not be interpreted as necessarily representing the oficial policies of the funding agencies.
References
| [1] | Merem, E. C., & Twumasi, Y. A. (2008). Geospatial Information Systems Analysis of Regional Environmental Change along the Savannah River Basin of Georgia. International Journal of Environmental Research and Public Health, 281-294. |
| [2] | Winner, D. G. (2007). A GIS Based Approach For Identifying Potential Runoff Harvesting Sites In The Thukela River Basin, South Africa. Physics and Chemistry of the Earth, 1058-1067. |
| [3] | Davies, B. (2008). A Comparison of the Catchments Sizes of Rivers, Streams, Ponds, Ditches and Lakes. Implications for Protecting Aquatic Biodiversity in An Agricultural Landscape. Hydrobiologia , 11. |
| [4] | Prakash, A. (2007). Deciding Alternative Land Use Options in a Watershed Using GIS. Journal of Irrigation and Drainage Engineering ASCE. |
| [5] | Ryan, R. (2003). Farmers Motivations For Adopting Conservation Practices Along Riparian Zones In The Mid-Western Agricultural Watershed. Journal of Environmental Planning and Management, 17-19. |
| [6] | Hall Jr, L. (1998). Ecological Risk Assessment of Copper and Cadmium In Surface Waters of Chesapeake Bay Watershed. Environmental Toxicology and Chemistry, 1-3. |
| [7] | Borbor, M. (2006). Nitrogen and Phosphorus Budgets For a Tropical Watershed impacted by Agricultural Land Use; Guugas , Ecuador. Biogeochemistry, 138-161. |
| [8] | McConnell, L. (2007). Fate and Transport of Pesticides in Chesapeake Waterways. Working Group on Pesticides in the Chesapeake Bay watershed to reduce the volume and impacts of Pesticides on Maryland water ways. Annapolis, MD: Maryland Pesticide Network. |
| [9] | Sierra Club. (1989). Cleaning up Chesapeake. Sierra club. |
| [10] | Vadas, P. (2007). Groundwater Nutrient Concentrations In Ditch-Drained Agro ecosystem. Journal of soil and Water Conservation , 178-188. |
| [11] | Krantz, D., & Bachman, J. (2000). The Potential for Denitrification of Ground Water by Coastal Plain Sediments in the Patuxent River Basin, Maryland. Baltimore, MD: USGS. |
| [12] | Lovejoy, S. (1997). Watershed management for water quality protection: Are GIS and simulation models THE answer? Journal of soil and water conservation, 103. |
| [13] | Usery, L. (2004). Geospatial Data Re sampling and Resolution Effects On a Watersheds Modeling: A Case Study Using The Agricultural One Point Source Pollution Model. Journal of Geographic Systems , 289-306. |
| [14] | Almasri, M., & Kaluarachchi, J. (2007). Nitrate Contamination of Groundwater in Agricultural Watersheds. Journal of Hydrology, 211-229. |
| [15] | Russell, G. (2007). The Role of GIS In Selecting Site For Riparian Restoration Based On Hydrology and Land Use. Restoration Ecology, 56-68. |
| [16] | Liu, Y. (2007). GIS Based integration of SWAT and REMN for Estimating Water Quality Benefits of Riparian Buffers in Agricultural Watersheds Transactions. ASCE, pp. 56-68. |
| [17] | Phillippe, M. (2008). A Spatio-Statistical Approach For Modeling The Effect of Non-Point Source On Different Water Quality Parameters In The Vehas River Watershed Brazil. Journal of Environmental Management, 158-170. |
| [18] | Miller, T. (2001). Selected Findings and Current Perspectives On Urban and Agricultural Water Quality By The National Water –Quality Assessment Program. USGS. |
| [19] | Min, K. S. (2007). Modeling and Assessing The Impact of Reclaimed Wastewater Irrigation and Nutrient Loads From an Agricultural Watershed Containing Rice Paddy Fields. Journal of Environmental science and Health Part A: Toxic/ Hazardous Substances and Environmental Engineering, 305-315. |
| [20] | Erin, N. (2002). Sediment Sources In an Urbanizing Mixed Land Use Watershed. Journal of Hydrology, 51-68. |
| [21] | Nengwang, C. (2006). Assessment of Management Practices In a Small Agricultural Watershed In Southeastern China. Journal of Environmental Science and Health Research, 1257-1269. |
| [22] | Bin, L. (2007). A watershed simulation and hybrid optimization modeling approach for water quality trading in soil erosion. Control Advances in Water Resources , 1902-1913. |
| [23] | Chambers, P. (2006). Changes in nutrient loading in an agricultural watershed and its effects on water quality and stream Biota. Hydrobiologica , 399-415. |
| [24] | Qui, Z. (2007). Managing Variable Source Pollution In Agricultural Pollution Watershed. Journal of Soil and Water Conservation, 115-122. |
| [25] | Cullum, R., Knight, S., Cooper, C., & Smith, S. (2006). Combined Effects of Best Management Practices On Water Quality in Oxbow Lakes From Agricultural Watersheds. Soil and Tillage research, 220. |
| [26] | Kyle, H. (2008). Factors Affecting Denitrification In Agricultural Head Waters Steams In Northeast Ohio. Hydrobiologia , 305-314. |
| [27] | Peng, G. (2007). Suspended Sediment Transport In an Intensively Cultivated Watershed In Southeastern California. CATENA, 239-352. |
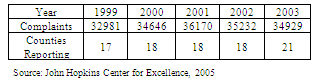
| [28] | Wikipedia. (2008). The free Encyclopedia-Maryland. Retrieved 2008, from Wikipedia: http://en.wikipedia.org/wiki/Maryland John Hopkins University (2005). The Cases of Nuisance Complaints Related to Agriculture. Baltimore, MD: Center For Excellence. |
| [29] | Maryland Department of Agriculture. (2006). A methodology for addressing sediment impairments in Maryland's non tidal watersheds. Washington, MD: MDDA. |
| [30] | Maryland Department of Agriculture. (2005). Annual Report Annapolis efforts Preserving Farmland Protecting Consumers, Promoting Profitable agriculture. Annapolis, MD: MDDA. |
| [31] | Denver, J., & Ator, S. (2006). Pesticides in ground water of the Maryland Coastal plain. USGS. |
| [32] | NRCS, M. (2008). Watershed included in Historic Expansion of the USDA National Conservation Security Program. NRCS. |
| [33] | Kazyak, P. (2001). Maryland Biological Stream Survey Sampling Manual, Monitoring and non-tidal assessment Division. Annapolis, MD: Maryland Department of Natural resources . |
| [34] | Roth, N., Southerland, M., Mercurio, G., Chaillou, J., Kazyak, P., Stranko, S., et al. (1999). State of Streams: 1995-1997; Maryland biological stream survey results. Annapolis, MD: Maryland Department of Natural Resources. |
| [35] | Center for Agriculture and Natural Resources Policy. (2005). Economic Situation and Prospects for Maryland Agriculture Policy Analysis Report No 02-01 pesticides price. University of Maryland. |
| [36] | Merem E.C., & Twumasi Y. A. (2011). Using Geospatial Information Systems In Analyzing Urbanization Impacts On Stream Habitats In Southern Mississippi Coastal Ecosystem. Journal of Environmental Science and Engineering, 5:12-1624-1641. |
| [37] | Merem E.C.,& Twumasi Y. A. (2011). The Applications of GIS In The Analysis of Human Impacts On South Texas Watersheds. The International Journal of Environmental Research and Public Health. 8:6 2418-2446. |
| [38] | Merem E. C., &Twumasi Y. A (2012). The Use of Geospatial Information Systems In The Analysis of Pollution trends In Southern Mississippi Region. The American Journal of Science and Engineering. 1:1:14-29. |
| [39] | Merem E.C.,& Twumasi Y. A.(2010). Using GIS In Ecological Management: Green Assessment of The Impacts of Petroleum Activities In The State of Texas. The International Journal of Environmental Research and Public Health.7:5:2011-2130 |