-
Paper Information
- Next Paper
- Previous Paper
- Paper Submission
-
Journal Information
- About This Journal
- Editorial Board
- Current Issue
- Archive
- Author Guidelines
- Contact Us
International Journal of Ecosystem
p-ISSN: 2165-8889 e-ISSN: 2165-8919
2012; 2(4): 67-73
doi: 10.5923/j.ije.20120204.04
High Dominance of Shorea robusta Gaertn. in Alluvial Plain Kamrup Sal Forest of Assam, N. E. India
Jyotishman Deka , Om Prakash Tripathi , Mohamed Latif Khan
Department of Forestry, North Eastern Regional Institute of Science and Technology, Itanagar, 791109, Arunachal Pradesh, India
Correspondence to: Jyotishman Deka , Department of Forestry, North Eastern Regional Institute of Science and Technology, Itanagar, 791109, Arunachal Pradesh, India.
| Email: |  |
Copyright © 2012 Scientific & Academic Publishing. All Rights Reserved.
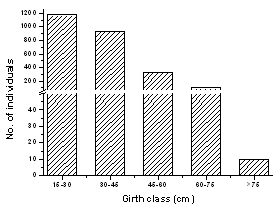
The study emphasizes on the community characteristics of naturally regenerated sal forest of Kamrup district, Assam, India. Sal is one of the most important timber yielding plants and also good source of aromatic gum and non- timber forest product. These forests are exposed to over-exploitation, deforestation, encroachment and alteration in land use and land cover and in return being replaced by secondary regenerated sal forest. Altogether, 71 plant species were recorded from the selected sal forest. Herbaceous layer of the forest was most species rich (30 species) layer followed by tree and shrub species. Leguminosae and Asteraceae were among the most dominant families in the forest while large number of families was monospecious. Shorea robusta has contributed about 90% of the total stand density (2559 individual ha-1) of the forest, while species like Erythrina suberosa, Delonix regia and Pterospermum acerifolium were represented by single stem. Similar to that of stand density, sal have contributed to the maximum basal area of the forest. The girth class distribution confirmed a reverse J-shaped distribution, with higher density in lower girth classes and sharp decline thereafter. Total density of shrubs and herbs was recorded 2 individuals m-2 and 63 individuals m-2, respectively. Based on the dominance, Shorea robusta showed highest dominance followed by Zizyphus rugosus. Diversity index for tree, shrub and herb species was recorded 1.43, 2.30 and 3.28, respectively. Dominance index showed reverse trend to that of diversity index. About 84% of the plant species showed contagious distribution, however none of the species exhibited regular distribution. The forest is heterogenous in composition with high dominance of Shorea and is under regenerating stage. Therefore, for sustainability of the forest it requires effective conservation measures for sal and its associate plant species.
Keywords: Basal Area, Dispersion Pattern, Dominance, Shorea Robusta, Species Diversity, Stand Density
Article Outline
1. Introduction
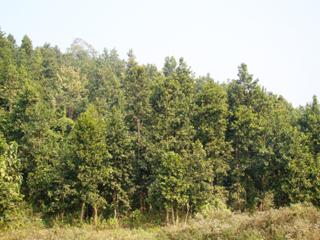
- Forest communities of northeast India have been studied by several workers and considerable information is available on species composition, biodiversity, regeneration potential etc.[1-7]. Disturbance changes the overall forest community structure[8,9]. Tree species diversity in a community declines with increasing disturbance, hence disturbed stands show low equitability or high dominance and undisturbed stands shows high equitability or low dominance which may result in contagious distribution of the tree species with increasing intensity of disturbance[2]. the age and diameter structure of their population[1,12]. However, interaction of biotic and abiotic factors of the environment also had a significant impact on the regeneration potential of any species[13].The sal (Shorea robusta) forests are mainly distributed in South and South-east Asia. In India it occupies two main regions, the northern and central regions separated by the Gangetic Plain. In the northern region, there is almost a continuous belt of sal stretching along the sub-Himalayan tract from Punjab to Assam and at some places it extends some distance into the Plains of the terai region[14]. In India sal is spread over an estimated area of 13 million hectares. Sal forests are typically categorized as ‘Tropical Moist Deciduous Forest’ which in this part of the country can be further divided into ‘Khasi hill Sal forest’ (3C/C1 1a (ii)) and ‘Kamrup Sal forest’ (3C/C2 2d (iv))[15]. Jacob[16] considered ‘Kamrup Sal’ forest type to be secondary invasive and it extended from the foothills down to the alluvial grassland. In Assam, Kamrup Sal forests occupy a considerable area in the Central and Lower parts of the State in the districts of Kamrup, Nagaon, Morigaon, parts of Nalbari and Barpeta, Darrang, Dhubri, Kokrajhar and Goalpara[15]. Sal is one of the most important timber yielding plants and are also a good source of ‘aromatic gum’ which is also known to have medicinal properties. The leaves of Sal tree also acts as an important source of non- timber forest product. But due to over-exploitation, deforestation, encroachment and alteration in land use and land cover, basically in the low-lying areas of the Assam valley, the mother Sal forest was slowly replaced by secondary regenerated Sal forest (Figure 1). Till date no documentation has been done on composition and regeneration of sal forest of Kamrup district, hence the present study was carried out in this secondary regenerated sal forest of Chaygaon, Palasbari and Boko circle of Kamrup district in Assam. Present study aims to provide quantitative information on the community structure and regeneration status of tree species in this secondary Sal forest.
 | Figure 1. Kamrup sal forest in its natural habitat in the study area |
2. Materials and Methods
2.1. Study Site
- The study site is located in Chaygaon, Palasbari and Boko circle of Kamrup district in Assam, northeast India. The district lies between 25.43° and 26.51° N latitude and between 90.36° and 92.12° E longitude. The district is spread over 4345 sq. km and contributes 5.53% of the total geographic area of the state. Total forest cover of the district is 1432 sq. km (32.96% of the total geographic area)[17]. The district is bounded in the North by foot hills of Bhutan and Nalbari district, South by the State of Meghalaya, East by Nagaon and Darrang districts and in the West by Goalpara and Nalbari districts. Kamrup district falls under the Lower Brahmaputra Valley zone. Soil structure of the district is mainly alluvial in nature. About 80% of total population of the district lives in rural areas and are mainly engaged in settled agriculture, allied, non-farm and service related activities which is predominantly subsistence in nature.
2.2. Methods
2.2.1. Plant Species Composition
- Plant species composition was studied by collecting and preparing herbarium. Herbarium specimens were prepared following the protocol of Jain and Rao[18]. Each species was identified by consulting available flora reference; including ‘Flora of Assam’[19].
2.2.2. Community Structure
- Thirty quadrats were laid randomly in sal forest stand for sampling trees, shrubs and herbs. Quadrat size of 20m X 20m was used for trees, 5m X 5m for shrub/saplings and 1m X 1m for seedlings/ground growths. Plants species were categorized into trees, shrubs and herbs based on the habitat characteristics and literatures.The GBH of all the tree species was measured at 1.37 m from the base during the sampling. Frequency, density, basal area, abundance and importance value index (IVI) of plant species were calculated following Misra[20] and Mueller-Dombois and Ellenberg[21]. Basal area of each individual tree species was calculated following g2/4п where g = Girth (cm). Importance value index (IVI) for trees was calculated by summing its relative frequency, relative density and relative dominance. For shrubs and herbs, IVI were calculated from the values of relative frequency and relative density. Species diversity index was calculated following Shannon-Wiener index[23], as: H' = -∑ (ni/N) ln ni/N where H' = Shannon- Wiener index of general diversity, ni = importance value index of ith species, N=sum of importance value index of all the species. Species dominance index was calculated by the formula given by Simpson[24]. Cd = ∑(ni/N)2, ni = importance value index of ith species, N=sum of importance value index of all the species. Spatial distribution of plant species was determined following Whitford index[25], as: WI = Abundance/Frequency (A/F Ratio). If value is <0.025 = regular distribution, value lies between 0.025-0.05 = random distribution and value >0.05 = clumped distribution.
3. Results
- A total of 71 plant species belonging to 68 genera under 38 families were recorded from the present study (total area of 1.2 hectares). This was represented by 25 trees, 16 shrubs and 30 herbs. Leguminosae was the dominant family having 8 species followed by Asteraceae, Malvaceae, Euphorbiaceae and Vebenaceae with 6, 5, 4 and 4 species, respectively. Families like Dipterocarpaceae, Anacardiaceae, Apocynaceae, Dilleniaceae, Lauraceae, Lythraceae, Magnoliaceae, Moraceae, Myrtaceae Rhamnaceae, Theaceae were represented by 1 species each. For shrubs species, both Leguminosae and Malvaceae were the dominant families with 3 species followed by Apocynaceae, Verbenaceae and Vitaceae with 2 species each. Among herb species, Asteraceae was the most dominant family with 5 different genus followed by Poaceae with 3 species. Based on the density, Ageratum conyzoides was recorded as the most dominant herb species followed by Xanthium strumarium, Commelina benghalensis, Borreria articularis etc. (Table 1 and 2).Total stem density in the present study was found to be
|
 | Figure 2. Girth class distribution of the tree species |
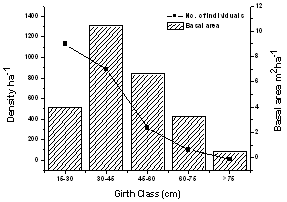
 | Figure 3. Density and basal area of Shorea robusta in different girth class |
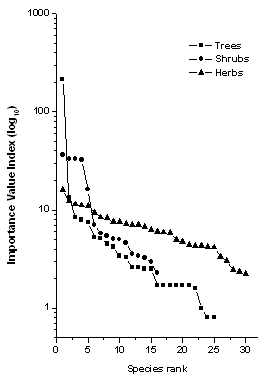
 | Figure 4. Dominance-diversity curve of trees, shrubs and herbs in Kamrup sal forest |
3. Discussion
- The plant species richness in the present study was recorded quite high (71 species in 1.2 ha). Uma Shankar[3] also reported high species richness from Sal forests in Eastern Himalaya and reported 87 species in 2 ha plot. The present species richness was found higher as compared to those reported from Central Himalayas and Central India[25,26]. However, it was found to be lower than the sal forest in Gorakhpur division of eastern terai region (208 species in 24 ha)[14] and Madhupur sal forest of Bangladesh (94 in 3 ha)[27], which may be due to much lesser sampled area in the present study. Leguminosae was found to be the largest family among plant species and is represented by 8 species. Several authors have also reported Leguminosae as the prominent family for Indian deciduous forests[28-30]. Among trees, both Leguminosae and Euphorbiaceae were found to be the dominant families with 4 species each followed by Moraceae, Verbenaceae and Bignoniaceae. Uma Shankar[3] reported Euphorbiaceae as the most dominant group in the Eastern Himalayan lowland forests. Gentry[31] reported Bignoniaceae as the second most specious family from neo-tropical deciduous forests. In shrub layer, both Leguminosae and Malvaceae were recorded as most dominant families. In herbaceous community Asteraceae was the dominant groups while the co-dominant being the Poaceae. Nath et al.[5] also reported Asteraceae as the dominant family followed by Poaceae among the herbaceous communities in tropical forest of north-east India. The stem density of tree species decreases with increase of girth size observed in the present study was in agreement with the findings of other workers[32-34]. The stem density of 1303 stems ha-1 (>30 cm GBH) obtained in the present study was quite high than the reported value (180-860) from tropical forests of different parts of India[14,26,35]. However, Swamy et al.[36] reported that the tree density (> 30 cm GBH) varies from 245-859 individuals ha-1 in the tropical forest of Tamil Nadu, India. Further, the present study confirms to the findings of Singh et al.[37] who reported 1233 individuals ha-1 from the tropical moist deciduous sal forest of Achanakmar Wildlife Sanctuary. Total basal area in the present study was recorded 27.57m2 ha-1. Shukla and Pandey[38] also reported similar basal area (22.23 m2 ha-1) from Sal forest of Gorakhpur division. While, Jha and Singh[35] reported basal area between 7-29 m2 ha-1 from Sal forest in Central India. On the other hand, Uma Shankar[3] reported basal area 26.3 m2 ha-1 from Sal forest of Eastern Himalaya. Similarly, Tiwari et al.[39] also reported a basal area (26.1 m2 ha-1) form Sal Forest in Subtropical Submontane Zone of Garhwal Himalaya. Presence of large number of individuals in the lower girth classes contributed the maximum basal area compared to the other sal forests of India. The tree species Shorea robusta shared the maximum IVI (212.67) then the other plant species, which was much higher than the reported values[3,38,39]. However, Kushwaha and Nandy[40] reported an higher IVI value of 221.78 for Shorea robusta from Chotanagpur Plateau in West Bengal.The diversity index of trees in the present study was recorded 1.43 was within the range of earlier reported values[14,37,41,42]. Nath et al.[5] also reported a diversity value of 1.46 for tropical forest of north-east India. Generally, Shannon-Weiner diversity for tropical forests, ranged from 0.81 to 4.1 for the Indian sub-continent[12,36]. Further, diversity index for shrubs and herbs was recorded 2.30 and 3.28 respectively. Sobuj and Rahman[43] also reported diversity index of 2.56 and 3.27 for shrubs and herbs respectively from tropical moist deciduous forest of Khadimnagar national park in Bangladesh. The Simpson’s dominance index in the present study ranges between 0.04 and 0.51 which is less than the reported value (0.047- 2.11) from 24 different sal communities in Gorakhpur Division[40]. Higher fluctuation of Shannon index (H) value (1.43-3.27) indicates that this tropical moist deciduous sal forests are also species diverse systems.The density girth distribution of tree species in the present study confirmed the reverse J-shaped distribution. Similar distribution pattern for sal forest was also reported by Tiwari et al.[39] and Kushwaha and Nandy[40]. Rao et al.[2] reported that, predominance of lower diameter classes attributed to the reverse J-shaped distribution. Abundance/frequency ratio exhibited that most of the species have contagious distribution, while only two species showed random distribution. Similar distribution pattern was also reported by Tripathi and Singh[44] for sal forest from Katerniaghat Wildlife Sanctuary. Odum[45] reported that contagious distribution is the commonest pattern in nature. Thus, from the present study it can be established that the forest is heterogenous in composition with high dominance of Shorea. Girth class distribution structure of the population also confirms that the forest is under regenerating stage. Girth class distribution decreases exponentially with increasing GBH are characteristic for species with continuous regeneration[46].
4. Conclusions
- From the present study, it can be concluded that Kamrup sal forest has high species diversity. Presence of large number of individuals in the lower girth class in the forest gives a good indication of better regeneration potential in the prevailing climatic condition. Climatic conditions of Kamrup region have also preferred sal and its associates to form a diverse sal forest. It can also be concluded that the present study stand has faced a huge destruction in the past, which at present is regenerating once again into its natural habitat. Therefore this type of forest can also be classified as “Regenerated Sal forests”. Thus, effective conservation and management initiatives are most important for sal and its associate plant species in order to conserve this sal forest.
ACKNOWLEDGEMENTS
- Thanks to the Forest Range Officers of Bamunigaon and Boko for extending their help during the field study. The authors are also grateful to Dr. Ashish Paul and Mr. Sanjeeb Bharali, Silviculture Lab, NERIST for extending their help during the compilation of results and preparation of the report.
References
| [1] | Khan, M.L., Rai, J.P.N. and Tripathi, R.S., (1987). Population structure of some tree species in disturbed and protected sub-tropical forests of north-east India. Acta Oecologica-Oecologia Applicata, 8, 247-255 |
| [2] | Rao, P., Barik, S.K., Pandey, H.N. and Tripathi. R.S., (1990). Community composition and tree population structure in a sub-tropical broad-leaved forest along a disturbance gradient. Vegetatio, 88, 151-162 |
| [3] | Uma Shankar., (2001). A case of high tree diversity in a sal (Shorea robusta)-dominated lowland forest of Eastern Himalaya: Floristic composition, regeneration and conservation. Current Science, 81, 776-786 |
| [4] | Mishra, B.P., Tripathi, R.S., Tripathi, O.P. and Pandey, H.N., (2003). Effect of disturbance on the regeneration of four dominant and economically important woody species in a broadleaved subtropical humid forest of Meghalaya, northeast India. Current Science, 84, 1149-1453 |
| [5] | Nath, P.C., Arunachalam, A., Khan, M.L., Arunachalam K. and Barbhuiya. A.R., (2005). Vegetation analysis and tree population structure of tropical wet evergreen forests in and around Namdapha National Park, northeast India. Biodiversity Conservation,14, 2109–2136 |
| [6] | Lalfakawma, U., Sahoo, K., Roy, S., Vanlalhriatpuia, K. and Vanalalhluna, P.C., (2009). Community composition and tree population structure in undisturbed and disturbed tropical semi-evergreen forest stand of North-east India. Applied Ecology and Environmental Research, 7, 303-318 |
| [7] | Tripathi, O.P., Upadhaya, K., Tripathi, R.S. and Pandey, H.N., (2010). Diversity, Dominance and Population Structure of Tree Species along Fragment- Size Gradient of a Subtropical Humid Forest of Northeast India. Research Journal of Environmental and Earth Science, 2, 97-105 |
| [8] | Sousa, W., (1979). Disturbance in marine intertidal boulder fields: the monequillibrium maintenance of species diversity. Ecology, 60, 1225-1239 |
| [9] | Shaforth, P.B., Stromberg, J.C. and Patten, D.T., (2002). Riparian vegetation response to altered disturbance and stress regimes. Ecological Applications, 12, 107-123 |
| [10] | Khumbongmayum, A. D., Khan, M. L. and Tripathi, R. S., (2005). Survival and growth of seedlings of a few tree species in the four sacred groves of Manipur, Northeast India. Current Science, 88, 1781-1788 |
| [11] | Saxena, A.K. and Singh, J.S., (1984). Tree population structure of certain Himalayan forest associations and implications concerning their future composition. Vegetatio, 58, 61-69 |
| [12] | Bhuyan, P., Khan, M.L. and Tripathi, R.S., (2003). Tree diversity and population structure in undisturbed and human-impacted stands of tropical wet evergreen forest in Arunachal Pradesh, Eastern Himalayas India. Biodiversity Conservation, 12, 1753–1773 |
| [13] | Khan, M.L., Rai, J.P.N. and Tripathi, R.S., (1986). Regeneration and survival of tree seedlings and sprouts in tropical deciduous and subtropical forests of Meghalaya, India. Forest Ecology and Management, 14, 293–304 |
| [14] | Pandey, S. K. and Shukla, R.P., (2003). Plant diversity in managed sal (Shorea robusta Gaertn.) forests of Gorakhpur, India: species composition, regeneration and conservation. Biodiversity Conservation, 12, 2295–2319. |
| [15] | Champion, H.G. and Seth, S.K., (1968). A Revised Survey of Forest Types of India, Manager of Publications, India |
| [16] | Jacob, M. C., (1939). A revised working plan for the Kamrup Sal Forest, Assam, Government Press: Shillong, India |
| [17] | FSI., (2011). Forest and Tree Resources in States and Union Territories, Ministry of Environment and Forests: Dehradun, India |
| [18] | Jain, S.K. and Rao, R.R., (1977). A Handbook of Field and Herbarium Methods. Today & Tomorrow’s Printers and Publishers: New Delhi, India |
| [19] | Kanjilal U.N., Kanjilal, P.C., Das, A., De R.N. and Bora N.L., (1934-1940). Flora of Assam. Vols. 1–5, Government Press, Shillong, India |
| [20] | Misra, R., (1968). Ecology Work Book. Oxford-IBH Publishing Company: Calcutta, India |
| [21] | Mueller-Dombois, D. and Ellenberg, H., (1974). Aims and Methods of Vegetation Ecology. John Wiley & Sons, Inc: New York, USA |
| [22] | Shannon, C.E. and Wienner, W., (1963). The Mathematical Theory of Communication. University of IIIinois Press: Urbana, Illinois |
| [23] | Simpson, E.H., (1949). Measurement of diversity. Nature, 163, 688 |
| [24] | Whitford, P.B., (1949). Distribution of woodland plants in relation to succession and clonal growth. Ecology, 30, 199–208 |
| [25] | Singh, J.S. and Singh, S.P., (1987). Forest vegetation of the Himalaya. Botanical Review, 53, 80–192 |
| [26] | Singh, A., Reddy, V.S. and Singh, J.S., (1995). Analysis of woody vegetation of Corbett National Park, India. Vegetatio, 120, 69–79 |
| [27] | Malaker, J.C., Rahman, M.M., Prodhan, A.K.M.A. and Malaker, S.K. (2011). Journal of Innovation & Development Strategy, 5, 41-47 |
| [28] | Murali, K. S., Uma Shankar., Uma Shaanker, R., Ganeshaiah, K. N. and Bawa, K. S., (1996). Extraction of Non-Timber Forest Products in the Forests of Biligiri Rangan Hills India. 2. Impact of NTFP extraction on regeneration, population structure, and species composition. Economic Botany, 50, 252–269. |
| [29] | Uma Shankar., Murali, K.S., Uma Shaanker, R., Ganeshaiah, K.N. and Bawa, K.S., (1998). Extraction of Non-Timber Forest Products in the Forests of Biligiri Rangan Hills, India.4. Impact on floristic diversity and population structure in a thorn scrub forest. Economic Botany,52, 302–315. |
| [30] | Chaturvedi, R. K., Raghubanshi, A. S. and Singh, J. S. (2011). Effect of Small-Scale Variations in Environmental Factors on the Distribution of Woody Species in Tropical Deciduous Forests of Vindhyan Highlands, India. Journal of Botany, 2011, 1-10 |
| [31] | Gentry, A. H., (1995). Diversity and floristic composition of neotropical dry forests. In Seasonally Dry Tropical Forests; Bullock, S. H., Mooney, H. A., Medina, E., Eds.; Cambridge University Press: Cambridge, UK, 146–194 |
| [32] | Chandrashekara, U.M. and Ramakrishnan, P. S., (1994). Vegetation and gap dynamics of a tropical wet evergreen forest in the Western Ghats of Kerala, India. Journal of Tropical Ecology, 10, 337–354. |
| [33] | Brokaw, N.V.L., Grear, J.S., Tripplett, K.J., Whitman, A.A. and Mallory, E.P., (1997). The Quebrada de Oro forest of Belize: exceptional structure and high species richness. Tropical Ecology, 38, 247–258 |
| [34] | Sahu, S.C., Dhal, N.K. and Bhadra, A.K., (2010). Arboreal Taxa Diversity of Tropical Forests of Gandhamardan Hill Range, Eastern Ghats, India: An Approach to Sustainable Biodiversity Conservation. Taiwania, 55, 208-215 |
| [35] | Jha, C. S. and Singh, J.S., (1990). Composition and dynamics of dry tropical forest in relation to soil texture. Journal of Vegetation Science, 1, 609–614. |
| [36] | Swamy, P.S., Sundarapandian, S.M., Chandrasekar, P. and Chandrasekaran, S., (2000). Plant species diversity and tree population structure of a humid tropical forest in Tamil Nadu, India. Biodiversity Conservation, 9, 1643–1669. |
| [37] | Singh, L., Sharma, B., Agrawal, R. and Puri, S., (2005). Diversity and Dominance of a Tropical Moist Deciduous Forest in Achanakmar Wildlife Sanctuary. Bulletin of National Institute of Ecology,15, 1-9. |
| [38] | Shukla, R. P. and Pandey, S. K., (2000). Plant diversity and community features of the forested landscape adjacent to foot-hills of central Himalayas. In Natural resources: conservation and management for mountain development; Tiwari, S. C., Dabral, P. P., Eds.; International Book Distributors: Dehradun, India |
| [39] | Tiwari, G.B.G. Pananjay. K., Tadele, K., Aramde, F. and Tiwari, S.C. (2010) Community Structure and Regeneration Potential of Shorea robusta Forest in Subtropical Submontane Zone of Garhwal Himalaya, India. Nature and Science, 8,70-74 |
| [40] | Kushwaha, S.P.S and Nandy, S. (2012). Species diversity and community structure in sal (Shorea robusta) forests of two different rainfall regimes in West Bengal, India. Biodiversity Conservation, 21, 1215-1228 |
| [41] | Pandey, S.K. and Shukla, R.P., (1999). Plant diversity and community patterns along the disturbance gradientin plantation forests of sal (Shorea robusta Gaertn). Current Science, 77, 814–818 |
| [42] | Shaheen, H., Qureshi, R. A. and Shinwari, Z. K. (2011). Structural Diversity, Vegetation Dynamics and Anthropogenic Impact on Lesser Himalayan Subtropical Forests of Bagh District, Kashmir, Pakistan Journal of Botany, 43, 1861-1866 |
| [43] | Sobuj. N.A. and Rahman.M., (2011). Assessment of plant diversity in Khadimnagar National Park of Bangladesh. International Journal of Environmental Science, 2, 79-91 |
| [44] | Tripathi, K.P and Singh, K. (2009). Species diversity and vegetation structure across various strata in natural and plantation forests in Katerniaghat Wildlife Sanctuary, North India. Tropical Ecology, 50, 191-200 |
| [45] | Odum, E.P., (1996). Fundamentals of Ecology, 3rd ed.; Nataraj Publishers: Dehra Dun, India, 574 |
| [46] | Khamyong, S., Lykke, A.M., Seramethakun, D. and Barfod, A.S., (2004). Species composition and vegetation structure of an upper montane forest at summit of Mt. Doi Inthanon, Thailand. Nordic Journal of Botany 23, 83-97 |
 Abstract
 Reference
 Full-Text PDF
 Full-Text HTML