-
Paper Information
- Next Paper
- Previous Paper
- Paper Submission
-
Journal Information
- About This Journal
- Editorial Board
- Current Issue
- Archive
- Author Guidelines
- Contact Us
International Journal of Ecosystem
p-ISSN: 2165-8889 e-ISSN: 2165-8919
2012; 2(4): 54-60
doi: 10.5923/j.ije.20120204.02
Spatial Fluctuations in Zooplankton Biotypes of the Imo River in a Niger Delta Area of Nigeria
 Abstract
 Reference
 Full-Text PDF
 Full-Text HTML
Dike Henry Ogbuagu 1, Adedolapo Abeke Ayoade 2
1Department of Environmental Technology, Federal University of Technology, PMB 1526, Owerri, Nigeria
2Department of Zoology, University of Ibadan, Nigeria
Correspondence to: Dike Henry Ogbuagu , Department of Environmental Technology, Federal University of Technology, PMB 1526, Owerri, Nigeria.
| Email: |  |
Copyright © 2012 Scientific & Academic Publishing. All Rights Reserved.
The study identified zooplankton biotypes of the increasingly in-stream sand-mined Imo River in Etche, a Delta area of Nigeria, as indicators of the health of the aquatic ecosystem. Plankton samples were collected with a 55μm mesh size plankton net that was hauled horizontally along the river course for 5 minutes at 7 sampling locations once monthly for 24 months (March 2007-February 2009). Samples were fixed/preserved in 4% formalin solution in labelled plastic containers. In the laboratory, a wide-mouthed pipette was used to withdraw 1ml of the plankton subsample and to place it on a Sedge-wick rafter-counting chamber. Standard keys were used for species identifications and counts made through direct microscopy. The ANOVA, post-hoc plots of group means, hierarchical cluster analysis (HCA), and the Margalef’s species diversity index were used to analyze data. Zooplankton had low diversity index (0.926 ± 0.100) and was made up of 7 taxa and a mean density of 433 organisms/ml; with order of dominance as Cladocera (25.87%)> Copepoda (20.55%)> Protozoans (19.17%)> Rotifera (18.71%)> fish eggs and larvae (9.24%)> Crab larvae (4.62%)> Beetle larvae (0.69%). Plankton abundance peaked in sampling location 1 (140 organisms/ml; 32.41%) and was least in location 3 (21 organisms/ml; 4.86%), even as there was marked spatial heterogeneity in the taxa composition[F(11.94)>Fcrit(3.94)] at P<0.05. The HCA revealed that crab larvae, fish eggs and larvae, beetle larvae, and copepods formed the first and richest cluster, while the rotifers, cladocerans and protozoans formed the sparse 2nd, 3rd and 4th clusters, respectively. The low biotic diversity recorded could be attributed to growth-limiting perturbations created by ongoing in-stream sand mining in water columns.
Keywords: Imo River, Etche Local Government Area, Plankton biotypes, Biotic index, In-stream Sand Mining
Article Outline
1. Introduction
- Etche, one of the 23 Local Government Areas (LGAs) of Rivers State in Nigeria has three major rivers- Imo, Otamiri-Oche and Oge-Ochie rivers. Of these, the Imo River, which rises from the Okigwe/Awka uplands in the neighbouring Imo State, is the major and most extensive. In the LGA, the Imo River confluences first with the Oge-Ochie at Nihi, and later with the Otamiri-Oche at Umuebulu.According to the NADECO[1] and Mogo[2], it is one of the independent straight rivers of the Niger Delta and in the larger Rivers State, the river courses through Etche, Oyigbo, Khana, Opobo/Nkoro and Andoni LGAs, before emptying into the Atlantic Ocean. The regime of the upper and middle courses of the river is alluvial while the lower course is subjected to tidal movements[3].Due to increasing urbanization activities attendant to the exploration and exploitation of oil and gas in the area, in-stream sand mining by local inhabitants has become acommon occupation, serving the many road constructions and building of houses in the area. Other than the benefits derivable from inland sand mining, alteration of hydrological regimes, loss of wetland and floodplains, sediment suspension and increased turbidity are some ecosystem imbalances that could impact negatively on the flora and fauna of aquatic ecosystems[4-9]. According to Spaak and Bauchrowitz[10] and Ogbuagu et al.[11], the impacted resident organisms include algae, macrophytes, protozoa, fish, and other animals. While some of these impacted flora and fauna could provide a general indication of resultant water pollution, others could enable the direct tracking of pollution sources. Of these, plankton[which occupy the base level of food chains that lead up to commercially important fisheries] have severally been used as ideal theoretical and experimental candidates for population ecology studies of water quality[12] due to their small sizes, short generation time and a relatively homogenous habits. Additionally, plankton communities play a major role in the biogeochemical cycles of many important elements such as the carbon cycle, nitrification, denitrification, remineralization and methanogenesis. These cycles bring about such processes as primary production and recycling. It is against these relevancies and for the need to establish the status of this segment of the river under anthropogenic perturbation that the current study undertook the use of zooplankton biotypes as fundamental indicators of pollution.
2. Material and Methods
2.1. Study Area
- Etche, a subsistent agrarian ethnic group in the Niger delta of Nigeria is located between longitude 06˚ 05' and 07˚ 14'E and latitude 05˚ 08' and 04˚ 45' N (Figure 1). The climate is typical of the tropical rainforest zone and rainfall is between 160-236cm; with about 300 rain days especially during March-November periods. Temperature ranges between 24 and 38℃, and the predominant wind direction is Northerly winds, although there is a significant influence from the Southerly winds. Highest humidities of up to 90% are usually recorded during the wet season while values as low as 40% could be recorded at the peak of the dry season[13]. However, some inhabitants also engage in petty trading, palm wine tapping, fishing, hunting and sand mining. In the neighborhoods of majority of the sampling locations are ongoing oil exploitation activities by the Shell Petroleum Development Company of Nigeria (SPDC), whose activities dates back to 1958 when crude oil was first discovered in the ethnic area.
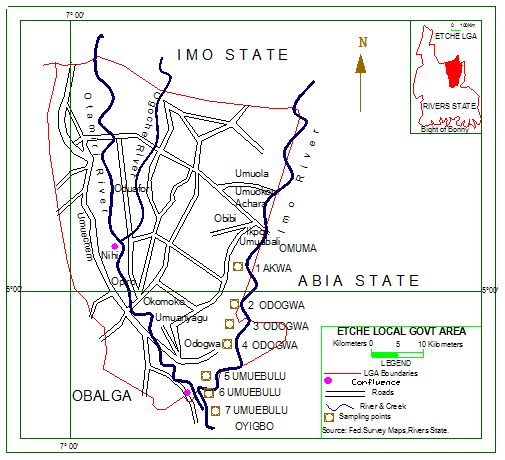 | Figure 1. Map of Etche LGA showing the sampling locations along Imo River |
2.2. Sampling Design and Locations
- Sampling for plankton were done once monthly for 24 months (March 2007-February 2009) at 7 sampling locations. Sand mining activities by local operators as well as other human activities such as washing of cloths and bathing were ongoing at all the sampling locations (though sand mining only commenced during the second year in location 1). Sampling location 1 was situated upstream at Akwa community. Sampling locations 2, 3, and 4 were situated about 1 km apart at Odogwa community; with location 2 situated about 2 km from 1. Locations 5, 6, and 7 were also situated about 1 km apart at Umuebulu community; with location 5 situated about 3 km from 4. Odogwa and Umuebulu communities house oil and gas facilities belonging to the SPDC.
2.3. Sample Collection
- From a locally made canoe used for transportation, plankton net of 55μm mesh size was hauled horizontally along the river course for 5 minutes at each sampling location according to the methods of Grant[14] and Anene[15]. The resultant concentrated plankton samples were later transferred to plastic containers, fixed and preserved in 4 % formalin solution according to Boney[16] and Anene[15] in the field.
2.4. Laboratory Analysis
- In the laboratory, with the use of a wide-mouthed pipette, 1ml of the plankton subsample was withdrawn from the field samples that had been homogenized by inverting the containers few times, placed on a Sedge-wick rafter-counting chamber and observed by direct microscopy. Keys provided by Whitford and Schumacher[17], Needham and Needham[18], Cole[19], Maosen[20], Jeje and Fernando[21,22], Egborge[23], and APHA[24] were used for species identifications. Counts were made in triplicates and their averages taken and expressed as organisms/ml of water.
2.5. Statistical Analyses
- The test of homogeneity in mean variance of the plankton taxa across the sampling locations was made with the single factor analysis of variance (ANOVA) and post-hoc plots of group means was made with means plots. The hierarchical cluster analysis (HCA) was used to explore and reveal natural groupings (or clusters) within the plankton assemblages that would otherwise not be apparent. Species diversity was determined with the Margalef’s index (I)[25].
3. Results
3.1. Taxa Composition and Abundance
- A total of 433 zooplankton organisms/ml, made up of 7 taxa were identified. The cladocerans consisted a total of 112 organisms/ml from 5 genera, thus making up the largest percentage of 25.87% of the zooplankton biotypes. The species included Alonella rostrata, Bosmina longirostris, Chydorus gibbus, Daphnia hyalins and D. carinata (Appendix 1). The copepods consisted 4 genera made up of 89 organisms/ml (20.55%). The common species included Canthocamptus staphylinus, C. carinetus, Paracyclops finibriatus, Limnocalanus macrurus and Senecella calanoides. Other than the cladocerans and copepods, the other crustacean zooplankton (crab larvae) comprised 20 organisms/ml (4.62%), while the piscean fish eggs and larvae consisted 40 organisms/ml (9.24%). The coleopteran beetle larvae consisted 3 organisms/ml (0.69%) while the rotifers consisted 81 organisms/ml (18.71%). Common rotifer species were Colurella spp., Keratella valga and Branchionus forficula. However, the protozoans consisted 3 genera that were made up of 83 organisms/ml (19.17%), with common species as Arcella arenaria, Didinium bolbianii and Peridinium bipes. The order of numerical abundance of the zooplankton taxa was Cladocera> Copepoda> Protozoans> Rotifera> fish eggs and larvae> Crab larvae> Beetle larvae.
3.2. Spatial Abundance
- The highest zooplankton abundance of 140 organisms/ml (32.41%) was recorded in sampling location 1 while sampling location 3 recorded the least abundance of 21organisms/ml (4.86%). The spatial order of numerical abundance of the zooplankton biotypes identified was SL 1> SL 7> SL 2> SL 4> SLs 5&6> SL 3. Of the Cladocera, Copepoda and Crab larvae, highest numerical abundances of 49, 31 and 7 organisms/ml respectively were recorded in SL 1, while least count of 5 organisms/ml and 1 organism/ml were recorded in SL 3 and SL 6 for the cladocerans and copepods, respectively. Crab larvae was absent in SLs 3 and 5 (Figure 2).
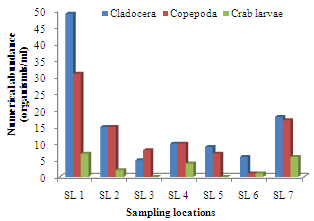 | Figure 2. Spatial variations in Cladocera, Copepoda and crab larvae densities in Imo River in Etche LGA |
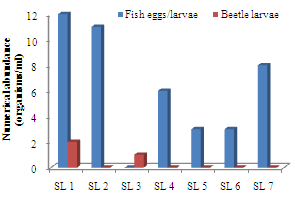 | Figure 3. Spatial variations in fish eggs/larvae and beetle larvae densities in Imo River in Etche LGA |
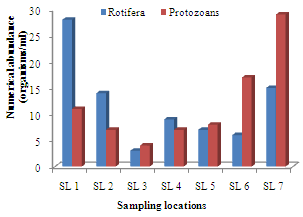 | Figure 4. Spatial variation in rotiferan and protozoan densities in Imo River in Etche LGA |
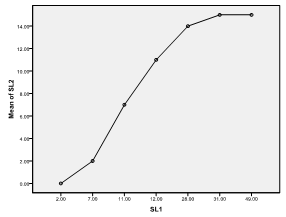 | Fiure 5. Means plot of zooplankton abundance between SL 1 and SL 2 in Imo River in Etche LGA |
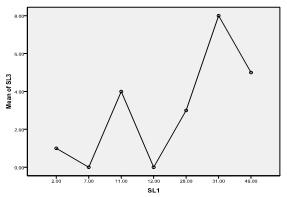 | Figure 6. Means plot of zooplankton abundance between SL 1 and SL 3 in Imo River in Etche LGA |
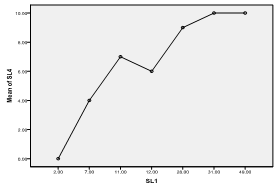 | Figure 7. Means plot of zooplankton abundance between SL 1 and SL 4 in Imo River in Etche LGA |
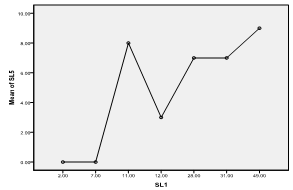 | Figure 8. Means plot of zooplankton abundance between SL 1 and SL 5 in Imo River in Etche LGA |
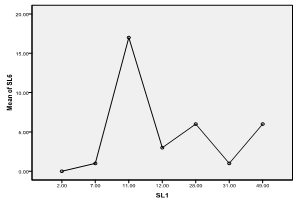 | Figure 9. Means plot of zooplankton abundance between SL 1 and SL 6 in Imo River in Etche LGA |
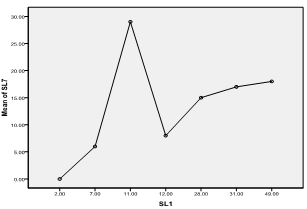 | Figure 10. Means plot of zooplankton abundance between SL 1 and SL 7 in Imo River in Etche LGA |
3.3. Biotic Diversity Index
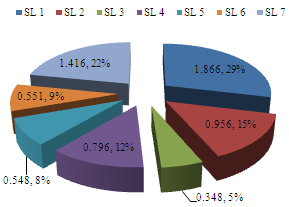
- Zooplankton biotypes recorded Margalef’s Diversity Index (I) ranging from 0.000-3.641; with sampling location 1 again, exhibiting overall highest mean diversity of 1.866 ± 1.300 (29.00%), while location 3 exhibited least mean diversity of 0.348 ± 0.000 (5.00%) (Figure 11). SLs 3, 4, 5 & 6 showed several zero zooplankton diversity than the rest of the locations during the study period. The order of magnitude of spatial diversity was SL 1> SL 7> SL 2> SL 4> SL 6> SL 5> SL 3.
 | Figure 11. Mean spatial diversity of zooplankton of Imo River in Etche LGA |
3.4. Hierarchical Cluster Analysis (HCA)
- The coefficient column of the complete linkage HCA classification revealed a precise classification into four major clusters, as confirmed by the dendrogram (Figure 12). The clusters occurred in stages 19 and 20, 20 and 21, 21 and 22, and 22 and 23. The first cluster, with richer plankton abundance and diversity contained crab larvae, fish eggs and larvae, beetle larvae, and the copepods. The second and third clusters contained the lone rotifers and cladocerans each, while the last cluster contained the lone protozoans.
4. Discussion
4.1. Plankton Abundance and Distribution
- The multiple effects of natural or altered conditions on plankton dynamics and compositions in aquatic environment have been emphasized by several authors, including Eze[26], Chattopadhyay and Barik[27] and Altaf et al.[28]. When compared with the works of Rai et al.[29] and Egborge[23] in other rivers, the Imo River in Etche LGA recorded comparatively lower zooplankton abundance and diversity. This paucity could be attributed to environmental perturbations (as also observed elsewhere by Armitage et al.,[30, 31]; Ogwejifor,[32] and EPA,[33]), especially arising from ongoing intense in-stream sand mining by local inhabitants which causes episodic high turbidity and depletion of nutrients in the river sediments thus, leading to decreased plankton abundance and productivity.The health of the biotic community of any aquatic system is a function of the abundance and diversity of plankton as primary producers. In their study in March and October of 2003 in the segment of the Imo River in the nearby Oyigbo LGA, Zabbey et al.[34] recorded a total of 23 genera of zooplankton, and elsewhere in the Ologe Lagoon in South-western Nigeria, Okogwu and Ugwumba[35] recorded 21 genera of zooplankton.
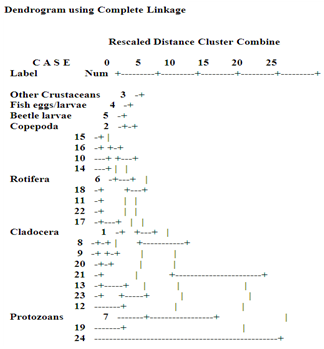 | Figure 12. Dendrogram showing hierarchical clustering of zooplankton in Imo River in Etche LGA |
4.2. Biotic Diversity
- Biotic diversity was low, especially when compared with the work of Ogamba et al.[38] in Elechi Creek Complex of the Niger Delta. Zero diversities (which were also recorded for the zooplankton biotypes of the river by Zabbey et al.,[34]) were recorded at many sampling locations. However, Zabbey et al.[34] recorded mean zooplankton Margalef’s diversity of 0.882, comparable to the current study’s diversity of 0.926. This paucity could be attributed to perturbations in water column, especially from sand mining activities, which could exert selective effects on biological assemblages[39, 40]. Zabbey et al.[34] have also identified sand mining as being responsible for low plankton abundance and diversity in the Imo River, even as Tamuno[41] had also identified it as exerting deleterious effects on plankton community composition elsewhere in the Niger Delta area. Intense in-stream sand mining could cause episodic proximal turbidity as well as depletion of nutrient loads in the sediments of aquatic systems, especially on long-term basis.The absence of beetle larvae in almost all the locations (except location 3) could be attributed to predation and competition by rotifers and fish, which are capable of excluding a particular group of organisms. However, other successional patterns have been observed by Egborge[23] in Warri River.
4.3. Hierarchical Cluster Analysis (HCA)
- HCA is an exploratory tool that reveals natural groupings within a data set that would otherwise not be apparent. Its grouping of plankton clusters that did not depend on numerical nor apparently assumed criteria in this study confirms this. The clustering of crab larvae, fish eggs and larvae, beetle larvae and copepoda together, and the lone rotifer, cladocera and protozoa must have utilized criterion other than numerical abundance. This reveals that there are latent relationships existing between the plankton biotypes, which otherwise were not exposed by numerical abundance and diversity alone. This is in line with Belgrano et al.[42] observation that although non-linear density-dependence has been widely used in population dynamics studies, the existences of non-linear exogenous forces have been less explored. Therefore, the formulation of population dynamics models should include both non-linear endogenous and exogenous responses for a better understanding of the effects of natural systems in the environment.
5. Conclusions
- Zooplankton biotypes identified were spatially dominated by the cladocerans, with beetle larvae and crab larvae as the least taxa encountered. Sampling location 1 recorded the highest plankton abundance and diversity due to its relatively pristine disposition, while location 3 recorded the least due to more anthropogenic activities there. Plankton abundance and diversity were comparatively low, with marked spatial variation. Ongoing in-stream sand mining could be associated with observed declining abundance and diversity of biotypes since this perturbation has been linked to habitat decimation and declining biodiversity elsewhere.
Appendix 1
List of zooplankton divisions and species identified in Imo River in Etche LGA (March 2007-February 2009)
- CladoceraAlonella rostrata (Koch)Bosmina longirostris (O.E. Mūller)Chydorus gibbus LilljeborgDaphnia hyalins (Leydig)D. carinata SarsPleuroxus sppCopepodaCanthocamptus staphylinus (Jurine)C. carinetus Shen et sungParacyclops finibriatus (Fischer)Limnocalanus macrurus Senecella calanoides SarOther crustaceansCrab larvaePiscesFish eggsFish larvaeInsectaBeetle larvaeRotiferaColurella sppKeratella valga EhrBranchionus forficula WierzejskiRotifer sppProtozoaArcella arenaria Greff.Didinium bolbianii (Fabre-Domergue)Peridinium bipes Stein